-
Paper Information
- Paper Submission
-
Journal Information
- About This Journal
- Editorial Board
- Current Issue
- Archive
- Author Guidelines
- Contact Us
International Journal of Statistics and Applications
p-ISSN: 2168-5193 e-ISSN: 2168-5215
2014; 4(5): 217-223
doi:10.5923/j.statistics.20140405.01
Simple v/s Sophisticated Methods of Forecasting for Mauritius Monthly Tourist Arrival Data
 Abstract
 Reference
 Full-Text PDF
 Full-text HTML
Ruben Thoplan
Department Economics and Statistics, Faculty of Social Studies and Humanities, University of Mauritius, Réduit, Mauritius
Correspondence to: Ruben Thoplan, Department Economics and Statistics, Faculty of Social Studies and Humanities, University of Mauritius, Réduit, Mauritius.
| Email: |  |
Copyright © 2014 Scientific & Academic Publishing. All Rights Reserved.
Making proper forecast of the number of tourist arrivals in Mauritius is essential as tourism is a pillar of the Mauritian economy. This paper compares the in-sample and out-of-sample forecast accuracy for the additive version of the Holt-Winters (HW) method, the Autoregressive Integrated Moving Average (ARIMA) method and the Neural Network Autoregression (NNAR) method applied on the monthly tourist arrival data for Mauritius. The aim is to demonstrate that a simple method of forecasting can be more accurate than a complex one in forecasting monthly tourist arrival. To measure the forecast accuracy of the three models, the Mean Absolute Percentage error (MAPE) and the Mean Absolute Scale Error (MASE) are considered as they are scale independent. The results obtained from the MAPE and MASE show that the NNAR model considered as a sophisticated model is poorer than the HW and ARIMA method over both the in-sample and out-of-sample data.
Keywords: NNAR, Holt-Winters, ARIMA, Forecast accuracy, MAPE
Cite this paper: Ruben Thoplan, Simple v/s Sophisticated Methods of Forecasting for Mauritius Monthly Tourist Arrival Data, International Journal of Statistics and Applications, Vol. 4 No. 5, 2014, pp. 217-223. doi: 10.5923/j.statistics.20140405.01.
Article Outline
1. Introduction
- The tourism industry in Mauritius has been flourishing over the past decades and is considered as a pillar of the Mauritian economy. According to the Bank of Mauritius, the earnings from tourism in the first quarter of year 2014 amounted to Rs 11,516 million which is a considerable amount as revenue for the country. The Statistics Mauritius is forecasting 1,030,000 tourist arrivals for the year 2014 as compared to 993,106 in the previous year. A proper forecasting of the number of tourist arrivals in Mauritius is crucial for future policy making by stakeholders. An underestimate of the number of tourist arrivals may lead to inadequate facilities available for tourist. This may result in a loss of goodwill for stakeholders which may eventually impact on long term strategies of the stakeholders to attract tourism. On the other hand, an overestimate of the number of tourist arrival may lead to loss in profitability of stakeholders due to high cost in terms of facilities provided unnecessarily. Accurate forecasting is essential to prudent policy making. “..., accurate forecasts of demand for tourism are crucial for effective planning by all providers of services and products in tourism” [1]. In fact, [2] demonstrates that the artificial neural network is an accurate forecasting method in many applications.This paper aims at comparing the forecasting potential of three models: the Holt-Winters (HW) model, the ARIMA and the neural network autoregression (NNAR) models. The HW model is a suitable model for the tourism arrival data due to its ability to take into account seasonal components of either additive or multiplicative nature, [3]. The ARIMA model is one which is appropriate when the time series is not stationary. The NNAR model is a relatively novel method which is computer intensive and generally yields satisfactory results in terms of in-sample and out-of-sample measures after some proper fine tuning of its parameters. It is important not to apply neural network models blindly in “black box” mode but rather to select the parameters of the neural network model wisely by means of traditional modelling skills, [4]. Often, researchers do not take into account the effect of the parameters of a neural network model on the forecasting performance, [5]. [6] shows that correctly structured neural models can perform better than the naive and the HW method in the short term .The objective of this paper is to fit the HW forecasting procedure, the ARIMA forecasting procedure and the neural network autoregression model to the log of the number of tourist arrival per month over the training data set starting January 1990 to December 2009. The three models will then be used to forecast the log of the number of tourist arrivals over the period starting January 2010 to March 2014. The performance of the three models on the training data set and their forecasting accuracy will then be compared. The aim is to demonstrate the strength of simple methods of forecasting in terms of forecasting accuracy as complex to a complex method of forecasting.
2. The Holt-Winters Method
- The HW method is a widely used forecasting procedure in time series analysis which takes into account any underlying trend and seasonal component irrespective of whether it is additive or multiplicative in nature. The HW forecasting procedure is a robust method which is relatively easy to apply, [7]. The multiplicative version of the HW forecasting procedure can be applied to a time series data directly without any prior transformation. This version of the HW method is non-linear as the point forecast is a non-linear function of past observations, [4]. However, the additive version of the HW method can also be applied under the assumption that the seasonal effects in the time series are linear. This step usually requires prior transformation of the data to ensure that the seasonal effects are linear over time. For instance, it is a usual fact that a fully multiplicative model is applied first by using the log transformation and then by fitting a fully additive model, [8]. This paper proposes to apply the log transformation of the number of tourist arrivals before fitting an additive version of the HW forecasting procedure. The additive version of the HW method can be formulated through the following transition equations for t=1, ... , n.
 | (1) |
 | (2) |
 | (3) |
 | (4) |
 is the vector representing the log of tourist arrivals,
  is the vector of smoothing parameters, m is the seasonal period (m=12 for monthly tourist arrival data) and
  represents the h-step ahead forecast. The values at, bt and st refer to the level, growth and seasonal components of the time series respectively. According to [7], the choice of initial values for the forecasting procedure is important because the forecasts are dependent on the initial values set. [16] initialises the values for a, b and s by fitting a simple linear regression on the deseasonalised data of the starting periods of the time series. The vector of smoothing parameters
  can be estimated by minimising the average squared one-step ahead forecast error. The additive version of the HW forecasting procedure has been successful in some instances in forecasting competitions, [9]. The choice of the forecasting method to use depends on its simplicity, accuracy and stability on the time series, [10]. Given the simplicity of the Holt-Winters method, we would like to compare its forecasting accuracy with a relatively novel method, the neural network autoregression model discussed in the next section.
 3. The Neural Network Autoregression Model
- Artificial neural networks allow the modelling of complex nonlinear relationships among input variables and output variables. In the case of a neural network autoregression model (NNAR), lagged values of a time series are used as input to the model and the output are the predicted values of the time series. One of the main differences between the NNAR and the HW method is that the NNAR does not impose any restriction on its parameters to ensure stationarity. In this paper we shall use the notation NNAR (p, P, k)m proposed by [3] due to the seasonal component present in the monthly tourist arrival data. The structure of the NNAR (p,P,k)m is represented in figure 1.
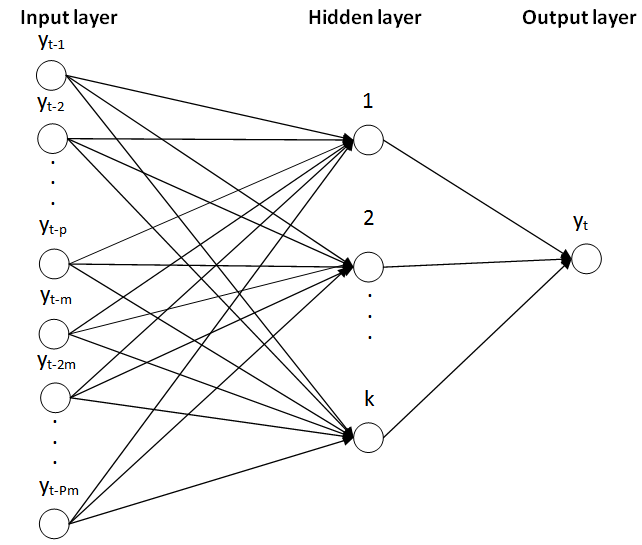 | Figure 1. A diagrammatic representation of the NNAR(p,P,k)m model |
 | (5) |
 | (6) |
4. The Autoregressive Integrated Moving Average (ARIMA) Model
- Another method of forecasting relates to the ARIMA forecasting model. In this paper, a simple ARIMA model is implemented. If a time series is not stationary, a first order differencing of the time series might be necessary. This differencing can be easily incorporated through the ARIMA model. In a nutshell, models can be set up for non-stationary series through the general class of ARIMA models by means of differencing, [11]. The procedure for setting up the ARIMA forecasting model relates to the famous Box-Jenkins forecasting model which starts by identifying the model, estimating the model, performing diagnostic check and considering alternative models if necessary. If the model is appropriate, the latter can be applied as forecasting model. Let yt represents the log of monthly tourist arrival for Mauritius. Adapting the formulation proposed by [3, 11], the term wt is defined as
 where the latter represents a differencing of order d for the time series process yt. Now, a general class of ARIMA(p,d,q) can be formulated as follows:
 | (7) |
 . The forecasting model can now be formulated as follows to obtain 1-step ahead forecast:
 | (8) |
 | (9) |
 to produce the following:
 | (10) |
5. Empirical Results
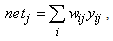
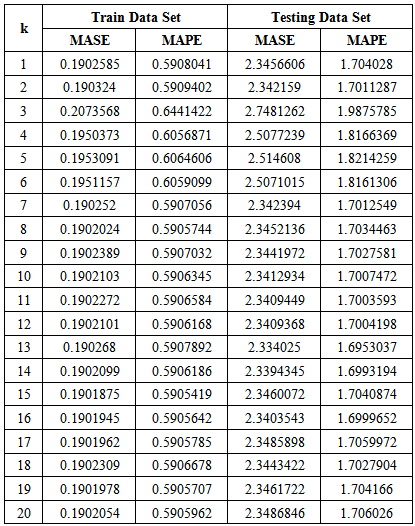
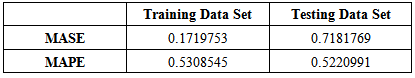
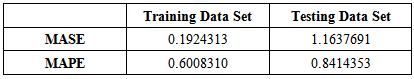
- This paper compares the forecasting performance derived from the three models mentioned above in view of identifying the best suited forecasting procedure for the monthly tourist arrival data and to see whether simple methods can outperform the NNAR. The steps taken are as follows:1. Fit the NNAR model on the training data set (January 1990 to December 2009)2. Fit the Holt-Winters on the training data set3. Fit the ARIMA model on the training data set4. Compare the in-sample forecast accuracy measures for the three models.5. Compare the out-of-sample forecast accuracy measures for the three models over the period, January 2010 to March 2014.Figure 2 depicts the evolution of the monthly tourist arrival data both in actual terms and in log terms. There is a clear multiplicative seasonal component in the data plotted in actual term. By taking the log, the behaviour of the time series becomes linear over time which allows the application of the additive version of the Holt-Winters forecasting procedure.
 | Figure 2. Evolution of monthly tourist arrival in actual terms and log terms |
 where
where | (11) |
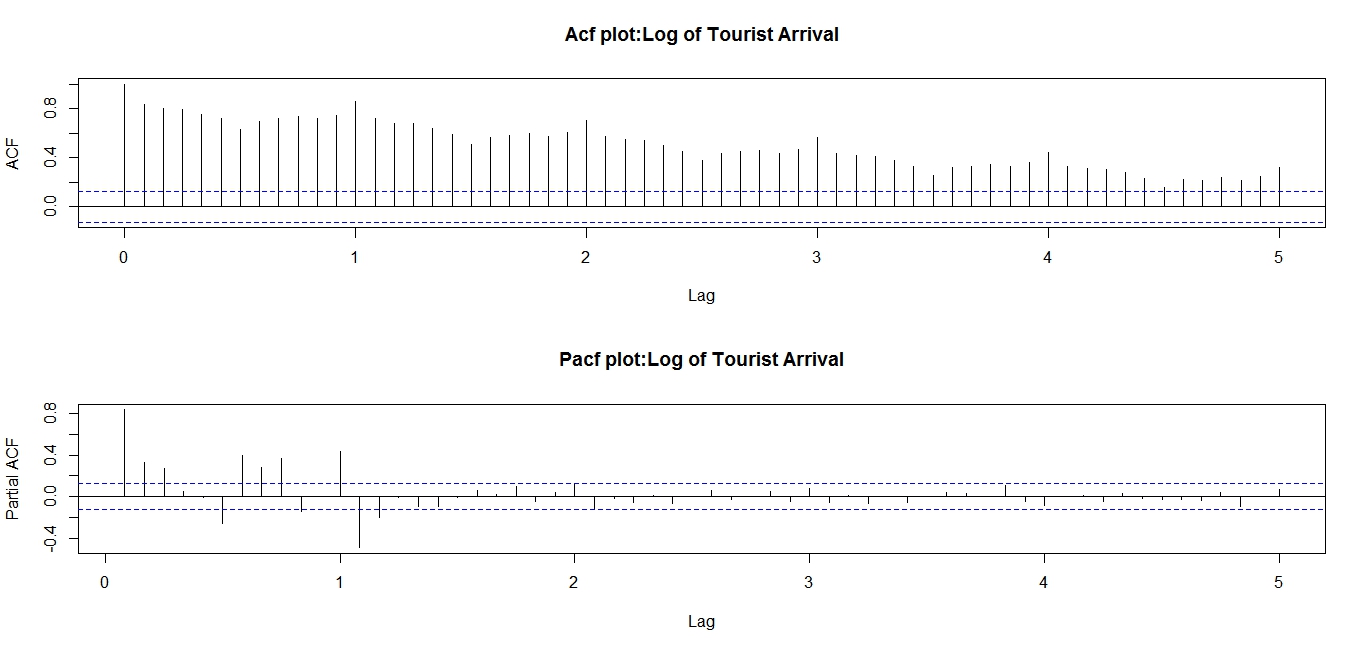 | Figure 3. ACF and PACF plots of log of monthly tourist arrivals |
 where
where | (12) |
|
|
|
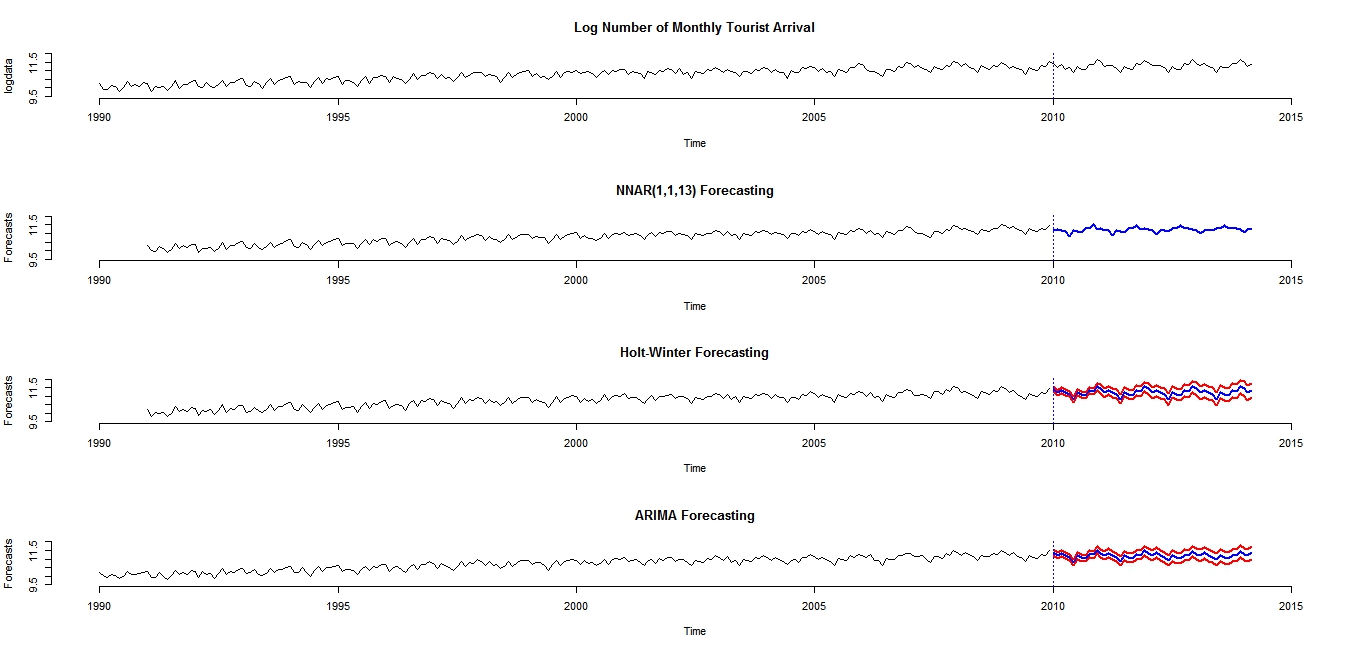 | Figure 4. Predicted log of tourist arrival from NNAR(p,P,13), Holt-Winters and ARIMA methods |
6. Conclusions
- The results in this paper are consistent with the findings of [8] which state that complex methods do not necessarily involve better forecast accuracy than simple ones. The NNAR is computationally more intensive than the Holt-Winters and the ARIMA method as it has to estimate the weights corresponding to 13 nodes, for example, to come up to a relatively good result. On the other hand, the Holt-Winters and the ARIMA method employed in this paper are more parsimonious approaches due to less parameters being estimated compared to the NNAR and, in addition, they yield better results. Findings demonstrate that the NNAR model is poorer in terms of forecasting accuracy on the out-of-sample data compared to the HW and ARIMA methods. This paper showed that in the case of forecasting the monthly tourist arrivals in Mauritius, simple method of forecasting can be more appropriate that complex method of forecasting. However, it is not possible to say that simple methods of forecasting always outperform complex ones. Under certain circumstances where a strong non-linear behaviour permeates a time series, the NNAR model could have performed better than the Holt-Winters method or the ARIMA method. Through the results of this paper, the author recommends that before attempting complex method of forecasting, it is beneficial in trying simple ones as they can provide more accurate results in certain circumstances.