-
Paper Information
- Next Paper
- Previous Paper
- Paper Submission
-
Journal Information
- About This Journal
- Editorial Board
- Current Issue
- Archive
- Author Guidelines
- Contact Us
International Journal of Statistics and Applications
p-ISSN: 2168-5193 e-ISSN: 2168-5215
2014; 4(4): 204-211
doi:10.5923/j.statistics.20140404.05
Comparison of Artificial Neural Network and Binary Logistic Regression for Classification of Chiropteran Dietary Specializations
Eric Adjei Lawer1, Albert Luguterah2, Suleman Nasiru2
1University for Development Studies, Dept. of Range & Wildlife Mgt., Nyankpala Campus, P. O. Box TL1882, Tamale, Ghana
2University for Development Studies, Dept. of Statistics, Navrongo Campus, P. O. Box 24, Navrongo, Ghana
Correspondence to: Eric Adjei Lawer, University for Development Studies, Dept. of Range & Wildlife Mgt., Nyankpala Campus, P. O. Box TL1882, Tamale, Ghana.
| Email: |  |
Copyright © 2014 Scientific & Academic Publishing. All Rights Reserved.
Discrimination between dietary specializations of bats has been largely analyzed using multivariate techniques such as discriminant and principal component analysis. In this study, models based on an artificial neural network (Multi-layer feed forward neural network) and Binary Logistic Regression (BLR) were compared in their ability to differentiate between insectivorous and frugivorous bats using habitat and morphometric measurements on captured bats. Although both models had similar diagnostic performance based on the area under the ROC (99% vrs 99.09%), sensitivity (97.6% vrs 96.8%) and specificity (95.3% vrs 93.8%) values, the logistic model was superior to the neural network model. We therefore recommend that if prediction is the sole objective, then ANNs provide acceptable results whiles BLR could be used to identify factor effects on classification. Further studies on these models may consider incorporating other dietary habits as well as factor effects (predictors) which could improve the accuracy of predictions.
Keywords: Artificial Neural Network, Binary Logistic Regression, Chiroptera, Frugivore, Insectivore
Cite this paper: Eric Adjei Lawer, Albert Luguterah, Suleman Nasiru, Comparison of Artificial Neural Network and Binary Logistic Regression for Classification of Chiropteran Dietary Specializations, International Journal of Statistics and Applications, Vol. 4 No. 4, 2014, pp. 204-211. doi: 10.5923/j.statistics.20140404.05.
Article Outline
1. Introduction
- Over millennia, organisms have evolved different trophic specializations in relation to morphological adaptations to changing ecological patterns. Chiropterans are armed with varied dietary apparatus which enable them to efficiently partition their resources hence, accounting for the success and abundance of this mammalian order. These trophic specializations include insectivory (feeding on insects), piscivory (feeding on fishes), carnivory (feeding on amphibians and small mammals), sanguivory (feeding on blood of mammals), frugivory (feeding on fruits), nectarivory (feeding on nectar, pollen and petals), folivory (feeding on leaves, buds and other green plant parts) and omnivory (reflects dietary overlap between phytophagy and animalivory) (Hill and Smith, 1984; Ferrarezzi and Gimenez, 1996; Simmons, 1998; Patterson et al., 2003; Giannini and Kalko, 2004, 2005). As such, morphometry is an important aspect in animal/wildlife studies. Coupled with appropriate statistical methods (parametric and non-parametric) it has been widely used in wildlife research. Multivariate statistics such as Principal Component and Discriminant Analyses have largely been used to analyze ecological data (McGarigal et al., 2000) especially in bats, to efficiently discriminate between species as well as dietary specializations. For instance, Palmeirim et al. (1989) used Reciprocal Averaging (also known as Correspondence Analysis), a non-parametric analog to Principal Component Analysis (PCA) to study the trophic structure of frugivorous birds and bats. Van Cakenberghe et al. (2002) quantitatively examined the relationship between cranial shape and diet using PCA. Santana et al. (2010) also used discriminant analysis to separate groups of bats with different diets using the mechanics of bite force production. However, such techniques to discriminate between dietary specializations using morphometry, require a lot of effort and in some instances dead bat specimens. Hence, there is the need for more efficient and animal friendly techniques to be adopted by researchers. The use of Artificial Neural Network (ANN) as an alternative to other standard statistical methods is gaining more prominence. For instance, its application has been reported in ecological and environmental science (Colasanti, 1991; Lek et al., 1996; Bastarache et al., 1997; Mastrorillo et al., 1998; Gozlan et al., 1999; Olden and Jackson, 2001; Scardi, 2001), as well as medicine and molecular biology ((Lerner et al., 1994; Albiol et al., 1995; Faraggi and Simon, 1995). This technique seeks to simulate the structure and functionalities of the biological central nervous system in information processing. There is evidence to suggest that ANNs outperform other statistical methods such as Logistic Regression (LR) (Lapuerta et al., 1997; Li et al., 2000; Nilson et al., 2006). In contrast, others have reported that the differences in the results obtained by both ANN and LR models are negligible (Lang et al. 1997; Tafeit et al., 1999; Ergun et al., 2004). This study is therefore aimed at using simple yet commonly measured bat body parameters as well as habitat variables to compare the discriminatory ability of both Binary Logistic Regression (BLR) and Artificial Neural Networks in classifying bat dietary specializations.
2. Methodology
2.1. Study Area
- The study was conducted at Kosane in the Dormaa West district of the Brong Ahafo Region, Ghana. The district was carved out of Dormaa which lies within longitude 3°–3°30' W and latitude 7°–7°30' N. The types of vegetation that characterize the area are unused forest, broken forest, grassland and extensively cultivable forestland and forest reserves. It has a bimodal rainfall pattern with a dry spell that spans from November to February. Mean annual rainfall values in the area are between 1,250mm and 1,750mm with an average temperature high of 30°C and a low of 26.1°C (Dormaa Municipal Assembly, 2006).
2.2. Capture of Bats
- Bats were captured with the aid of 12 x 2.5m mist nets set at ground level at identified fly ways in three of each randomly selected agro-ecosystem type (Citrus farms, Mixed farms, Fallow lands, Teak plantations, Oil palm plantations, Maize farms) following a reconnaissance survey. The elevation and distance of each agro-ecosystem to roosts of bats was measured and recorded. Mist nets were monitored periodically from 18:30 hours each day until they were closed at 02:00 hours the following day. Each captured bat was marked to avoid double sampling and then released at the same site of capture. During this period, species identification and morphometric (body mass and forearm length) measurements of the chiropterans was carried out. Species were later classified into two foraging guilds based on diet (Hill and Smith, 1984; Giannini and Kalko, 2004). Fruit-eating bats were classified as frugivores whiles insect-eating bats were classified as insectivores. Out of the total of 253 captured bats, 128 had a frugivorous diet whiles the remaining 125 were insectivorous. Sexing of individuals was based on the presence of male external genitalia (Racey, 1988). Captured bats were also classified into three age groups namely; juveniles, sub-adults and Adults (Nelson, 1965; Vardon and Tidemann, 1998; Holmes, 2002).
2.3. Artificial Neural Network
- ANNs are modelling techniques that are widely used to solve problems of prediction or to uncover patterns in data. Though there are many different types of ANNs in use today, the multi-layer Feed Forward Neural Network (FFNN) was employed in this research. This ANNs architecture consists of an input layer, a hidden layer and an output layer. After passing the sample through the network, the output value is calculated using the equation;
 | (1) |
 | (2) |
2.3.1. Back Propagation Algorithm
- When using the sigmoid (logistic) function, the slope approaches zero as the input gets larger causing changes in the weights and biases. Hence, the network was trained using the resilient back propagation algorithm on the training data set to eliminate the effects of the magnitudes of the partial derivatives. Weights were first adjusted to meet the minimum of the MSE criterion function after feed forwarding the training set. The equation used for the weights adjustment is given by;
 | (3) |
 | (4) |
2.3.2. Generalized Weights
- The effect of each covariate xi for the neural network model can be expressed as generalized weights (Intrator and Intrator, 2001). These generalized weights however depend on all other covariates in the model. The interpretation of generalized weights for neural network models is analogous to logistic regression and can be defined as the individual covariate’s contribution to the log-odds. The generalized weights for each covariate were computed using the relationship;
 | (5) |
2.3.3. Independent Variable Contribution
- A number of methods have been proposed to determine the impact of input variables (Garson, 1991; Dimopoulos et al., 1995; Goh, 1995; Lek et al., 1996). This study employed Garson’s (1991) algorithm modified by Goh (1995) to determine the relative importance of explanatory variables on chiropteran dietary habits. Since this algorithm uses absolute weight values in its computation, it is difficult to interpret the direction of the relationship between input and output variables. The relative importance of each input variable is therefore defined as
 | (6) |
 | (7) |
 | (8) |
 | (9) |
2.4. Binary Logistic Regression (BLR)
- This research employed BLR to model the dichotomous dependent variable of dietary specialization (insectivore or frugivore) with independent variables (Sex, Age, Agro-ecosystem, Moon phase, roost Distance, Elevation, Forearm length, and Body mass).The logistic regression model for a dichotomous response is given by;
 | (10) |
 | (11) |
2.4.1. Hosmer Lemeshow Test
- An overall goodness-of-fit test is required once a logistic regression model has been fit to a given set of data. Although several goodness-of-fit tests have been proposed (example: Cox, 1958; Tsiatis, 1980; Brown, 1982; Azzalini et al., 1989; le Cessie and van Houwelingen, 1991; Su and Wei, 1991), the Hosmer-Lemshow (1980) test was used in this study. This goodness-of-fit test groups subjects into deciles based on the values of the estimated probabilities such that yij is the binary outcome for observation j(j=1,····,ni) in group i(i=1, ····,g). It then compares the number actually in each group (observed) to the number predicted by the logistic regression model (expected). If
 ij is the probability for the fitted model, then the statistic is given by;
 | (12) |
3. Results
3.1. Classification of Dietary Habits Using FFNN
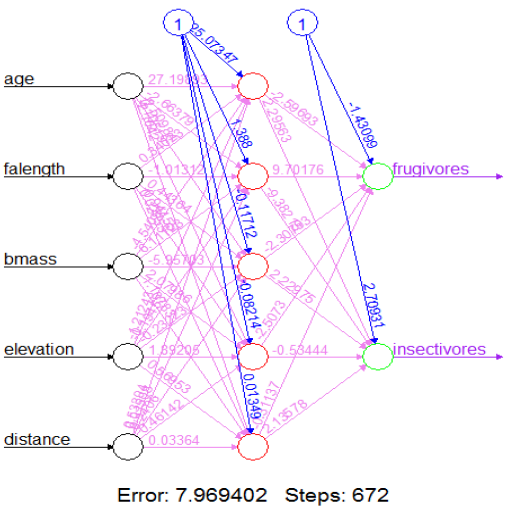
- Figure 1 is a diagram of the trained neural network on the dietary habits of chiropterans evaluated using 75% of the dataset. The remaining 25% was used to validate the model.
 | Figure 1. Trained neural network of chiropteran dietary habits |
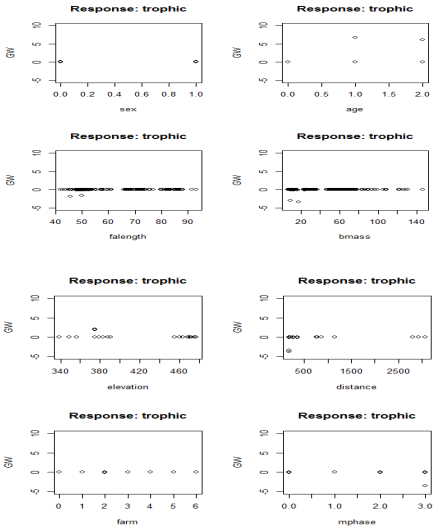
 | Figure 2. Generalized weight plots for dietary covariates |
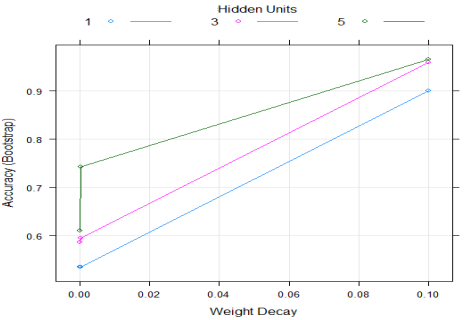
 | Figure 3. Network topology of final neural network model |
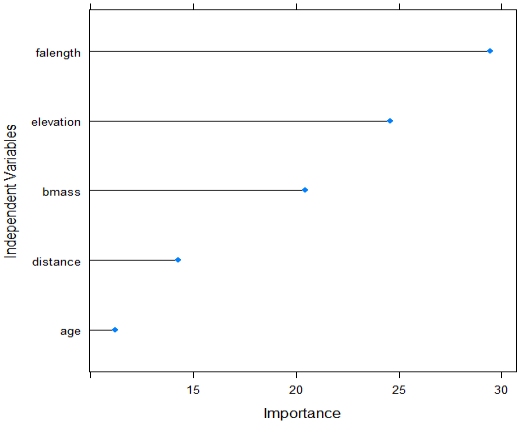
 | Figure 4. Contribution of each of the five independent variables to the classification of bat dietary habits – obtained by Garson’s algorithm |
3.2. Classification of Dietary Habits Using BLR
- A binary logistic regression was used to model the probability of a chiropteran being insectivorous or frugivorous. An a priori model for the analysis included the following independent variables; type of Agro-ecosystem, Sex, Age, Moon phase, Forearm length, Body mass, Elevation and roost Distance from foraging sites. The final model with the variables Body mass, Forearm length, Age, Elevation and roost Distance were jointly found to be statistically significant in determining the dietary habits of chiropterans (Table 1).
3.3. Comparative Analysis of Statistical Methods
- In order to select the most adequate model for the classification of chiropteran dietary habits, the diagnostic performance of BLR and FFNN were compared. The results indicate that both the BLR and FFNN have nearly similar diagnostic performance though most of the tests favored BLR (Table 2).
|
4. Discussion
- The negligible difference in discriminatory power (based on area under ROC curve, sensitivity and specificity) between the two developed models were similar and consistent with other findings (Lang et al., 1997; Ergun et al., 2004). Both the BLR and ANN models indicated that Forearm length, Elevation, Body mass, roost Distance from foraging sites, and Age significantly influenced dietary classification of bats. These factors which were confirmed in studies elsewhere (Fleming, 1991, 1993; Hughes et al., 1995; Adams, 1996, 1997) have been arranged in order of magnitude based on each independent variable’s contribution for the ANN. One important advantage of BLR over ANN is its ability to identify factor effects and their directions on the response variable (interpretability of model parameters). This has often led to the ANNs description as a “black box” in ecological modeling due to its lack of explanatory power (Paruelo and Tomasel, 1997; Özesmi and Özesmi, 1999). Another disadvantage of ANNs is their inability to handle missing data. They however compensate for this by being able to simultaneously handle numerous variables (Bishop, 1995; Zou et al., 2008). As such, other predictive variables could be examined and used to improve the predictive accuracy of the model. Again, the problem of dimensionality is managed well in ANNs than other statistical methods, even with small sample sizes. The dynamic approach employed to analyze dietary specializations enables ANNs to modify their internal structure in relation to a functional objective by using the data to generate the model via learning without supervision. Therefore in complex biological or ecological systems, the predictive range of BLR is extended in ANN by replacing identity functions (linear combinations) with nonlinear activation functions. Hence, ANNs become powerful techniques when underlying relationships are unknown. Thus, they are able to explore hidden layers to find nonlinearities, interactions, and nonlinear interactions among independent variables.
5. Conclusions
- The study revealed that both models (FFNN and BLR) had similar diagnostic performances. Also, the two models clearly indicated that Forearm length, Elevation, Body mass, roost Distance from foraging sites, and Age had significant effect on the dietary classification of chiropterans. We therefore conclude that if prediction is the sole objective, then ANNs provide acceptable results whiles BLR could be used to identify factor effects on classification. Also, ANNs could be used to achieve globally more accurate predictions when further studies incorporating other dietary habits (dependent variables) as well as predictors (independent variables), are to be conducted.
References
| [1] | Adams, R. A. (1996). Size-specific resource use in juvenile little brown bats, Myotis lucifugus (Chiroptera: Vespertilionidae): is there an ontogenetic shift? Canadian Journal of Zoology, 74: 1204-1210. |
| [2] | Adams, R. A. (1997). Onset of volancy and foraging patterns of juvenile little brown bats, Myotis lucifugus. Journal of Mammalogy, 78: 239- 246. |
| [3] | Albiol, J., Campmajo, C., Casas, C., and Poch, M., (1995). Biomass estimation in plant cell cultures: a neural network approach. Biotechnology Progress, 11: 88-92. |
| [4] | Azzalini, A., Bowman, A. W., and Härdle, W., (1989). On the use of nonparametric regressionfor model checking. Biometrika, 76(1): 1-11. |
| [5] | Bastarache, D., El-Jabi, N., Turkkan, N. and Clair, T. A. (1997). Predicting conductivity and acidity for small streams using neural networks. Can. J. Civ. Eng. 24: 1030-1039. |
| [6] | Bishop, M. C. (1995). Neural Networks for Pattern Recognition. Clarendon Press, Oxford, UK, p. 482. |
| [7] | Brown, C. C. (1982). On a goodness-of-fit test for the logistic model based on score statistics. Comm. Statist. Theory Meth. 11(10): 1087-1105. |
| [8] | Colasanti, R. L. (1991). Discussions of the possible use of neural network algorithms in ecological modelling. Binary, 3: 13-15. |
| [9] | Cox, D. R. (1958). Two further applications of a model for binary responses. Biometrika, 45: 562-565. |
| [10] | Dimopoulos, Y., Bourret, P. and Lek, S. (1995). Use of some sensitivity criteria for choosing networks with good generalization. Neural Process. Lett. 2: 1-4. |
| [11] | Dormaa Municipal Assembly (2006).http://dormaa.ghanadistricts.gov.gh/ Date Accessed: 19th July, 2014. |
| [12] | Ergün, U., Serhatlıoğlu, S., Hardalaç, F. and Güler, İ. (2004). “Classification of carotid artery stenosis of patients with diabetes by neural network and logistic regression”, Computers in Biology and Medicine, 34: 389-405. |
| [13] | Faraggi, D. and Simon, R. (1995). A neural network model for survival data. Stat. Med. 14: 73-82. |
| [14] | Ferrarezzi, H. and Gimenez, E. A. (1996). Sytematic patterns and the evolution of feeding habits in chiroptera (Archonta: Mammalia). Journal of comparative Biology, 1: 75-94. |
| [15] | Fleming, T. H. (1991). The relationship between body size, diet, and habitat use in frugivorous bats, genus Carollia (Phyllostomidae). Journal of Mammalogy, 72: 493-501. |
| [16] | Fleming, T. H. (1993). Plant-visiting bats. American Scientist, 81: 460-467. |
| [17] | Fowler, C. J. and Clarke, B. J. (1996). Corporate distress prediction: a comparison of the classification power of a neural network and a multiple discriminant analysis model. Accounting Forum, 20(3-4): 251-269. |
| [18] | Garson, G. D. (1991). Interpreting neural-network connection weights. Artif. Intell. Expert., 6: 47-51. |
| [19] | Giannini, N. P. and Kalko, E. K. V. (2004). Trophic structure in a large assemblage of phyllostomid bats in Panama. Oikos, 105: 209-220. |
| [20] | Giannini, N. P. and Kalko, E. K. V. (2005). The guild structure of animalivorous leaf-nosed bats of Barro Colorado Island, Panama, revisited. Acta Chiropterologica, 7: 131-146. |
| [21] | Goh, A. T. C. (1995). Back-propagation neural networks for modeling complex systems. Artif. Intell. Eng. 9: 143–151. |
| [22] | Gozlan, R. E., Mastrorillo, S., Copp, G. H. and Lek, S. (1999). Predicting the structure and diversity of young-of-the-year fish assemblages in large rivers. Fresh. Biol. 41: 809–820. |
| [23] | Haykin, S. (1999). Neural networks: a comprehensive foundation, 2nd edn. Prentice-Hall, Upper Saddle River, New Jersey. |
| [24] | Hill, J. E. and Smith, J. D. (1984). Bats: a natural history. University of Texas Press, Austin: 243 pp. |
| [25] | Holmes, J. L. (2002). Roosting ecology of the grey headed flying fox, Pteropus poliocephalus: spatial distribution in a summer camp. M.S. thesis, University of Tennessee, Knoxville. |
| [26] | Hosmer, D. W. and Lemeshow, S. (1980). Goodness-of-fit tests for the multiple logistic regression model. Comm. Statist. Theory Meth. A A9 (10):1043–1069. |
| [27] | Hughes, P., Rayner, J. M. V. and Jones, G. (1995). Ontogeny of “true” fl ight and other aspects of growth in the bat Pipistrellus pipistrellus. Journal of Zoology (London), 235: 291-318. |
| [28] | Intrator, O., and Intrator, N. (2001). Interpreting neural-network results: a simulation study. Computational Statistics and Data Analysis, 37: 373-393. |
| [29] | Lang, E. W., Pitts, L. H., Damron, S. L., and Rutledge, R. (1997). Outcome after severe head injury: an analysis of prediction based upon comparison of neural network versus logistic regression analysis. Neurol Res., 19: 274-280. |
| [30] | Lapuerta, P, Rajan, S. and Bonacini, M. (1997). Neural networks of outcomes in alcoholic patients with severe liver disease. Hepathology, 25: 302-307. |
| [31] | le Cessie, S. and van Houwelingen, J. C. (1991). A goodness-of-fit test for binary regression models, based on smoothing methods. Biometrics, 47: 1267-1282. |
| [32] | Lek, S., Delacoste, M., Baran, P., Dimopoulos, I., Lauga, J. and Aulagnier, S. (1996). Application of neural networks to modeling nonlinear relationships in ecology. Ecol. Model., 90: 39-52. |
| [33] | Lerner, B., Levinstein, M., Rosenberg, B., Guterman, H., Dinstein, I. and Romem, Y. (1994). Feature selection and chromosomes classification using a multilayer perceptron neural network. IEEE International Conference on Neural Networks, Orlando (Florida), pp. 3540-3545. |
| [34] | Li, Y. C, Chiu, W. T. and Jian, W. S. (2000). Neural networks modeling for surgical decisions on traumatic brain injury patients. International Journal of medical informatics, 57: 389–405. |
| [35] | Marzban, C. and Stumpf, G. (1996). A neural network for tornado prediction based on Doppler radar-derived attributes. J. Appl. Meteorol., 35: 617-626. |
| [36] | Mastrorillo, S., Dauba, F., Oberdorff, T., Guégan, J.F., and Lek, S. (1998). Predicting local fish species richness in the Garonne River basin. C.R. Acad. Sci. Paris, Sciences de la vie 321: 423-428. |
| [37] | McGarigal K., Cushman S., and Stafford, S., (2000). Multivariate statistics for wildlife and ecology research. Springer Science+Business Media, Inc. New York, USA. 283p |
| [38] | Nelson, J. E. W. (1965). Movements of Australian flying foxes (Pteropodidae: Megachiroptera). Australian Journal of Zoology, 13: 53-73. |
| [39] | Nilsson J., Ohlsson M., Thulin L., Höglund P., Nashef S. A. and Brandt J. (2006). Risk factor identification and mortality prediction in cardiac surgery using artificial neural networks. J. Thorac Cardiovasc Surg, 132: 12-19. |
| [40] | Olden, J. D. and Jackson, D. A. (2001). Fish-habitat relationships in lakes: gaining predictive and explanatory insight by using artificial neural networks. Trans. Am. Fish. Soc. 130: 878-897. |
| [41] | Özesmi, S. L., and Özesmi, U. (1999). An artificial neural network approach to spatial habitat modeling with interspecific interaction. Ecol. Model., 116: 15-31. |
| [42] | Palmeirim, J. M., Gorchov, D. L., and Stoleson, S. (1989). Trophic structure of a neotropical frugivore community: is there competition between birds and bats? Oecologia, 79: 403-411. |
| [43] | Paruelo, J. M. and Tomasel, F. (1997). Prediction of functional characteristics of ecosystems: a comparison of artificial neural networks and regression models. Ecol. Model., 98: 173-186. |
| [44] | Patterson, B. D., Willig, M. R. and Stevens, R. D. (2003). Trophic strategies, niche partitioning, and patterns of ecological organization. In: Bat Ecology (eds Kunz TH, Fenton MB), pp. 536–579. University of Chicago Press, Chicago. |
| [45] | Racey, P. A. (1988) Reproductive assessment in bats. In Ecological and Behavioral Methods for the Study of Bats (eds T. H. Kunz). pp. 31-45. Washington, D.C.: Smithsonian Institution Press. |
| [46] | Santana S. E., Dumont, E. R. and Davis J. L. (2010). Mechanics of bite force production and its relationship to diet in bats. British Ecological Society. Functional Ecology. doi: 10.1111/j.1365-2435.2010.01703.x |
| [47] | Scardi, M. (2001). Advances in neural network modeling of phytoplankton primary production. Ecol. Model., 146: 33-46. |
| [48] | Simmons, N. B. (1998). A reappraisal of interfamilial relationships of bats. In Kunz, T. H. and Racey P. A.: Bat biology and conservation. Smithsonian Institution Press - Washington, D.C.: 3 - 26. |
| [49] | Su, J. Q. and Wei, L. J. (1991). A lack-of-fit test for the mean function in a generalized linear model. J. Amer. Statist. Assoc., 86(414): 420-426. |
| [50] | Tsiatis, A. A. (1980). A note on a goodness-of-fit test for the logistic regression model. Biometrika, 67(1): 250-251. |
| [51] | Van Cakenberghe, V., Herrel, A. and Aguirre, L. F. (2002). Evolutionary Relationships between Cranial Shape and Diet in Bats (Mammalia: Chiroptera). Topics in Functional and Ecological Vertebrate Morphology, pp. 205-236. P. Aerts, K. D’Août, A. Herrel and R. Van Damme, Eds. |
| [52] | Vardon, M. J. and Tidemann, C. R. (1998). Reproduction, growth and maturity in the black flying-fox, Pteropus alecto (Megachiroptera: Pteropodidae). Australian Journal of Zoology, 46: 329-344. |
| [53] | Wong, P. M., Taggart, I. J. and Gedeon, T. D. (1995). Use of neural network methods to predict porosity and permeability of a petroleum reservoir. AI Appl., 9(2): 27-37. |
| [54] | Zou, J., Han, Y. and So, S. (2008). Overview of artificial neural networks. Methods Mol. Biol. 458: 15–23. |
 Abstract
 Reference
 Full-Text PDF
 Full-text HTML