Ruben Thoplan
Department Economics and Statistics, Faculty of Social Studies and Humanities, University of Mauritius, Réduit, Mauritius
Correspondence to: Ruben Thoplan, Department Economics and Statistics, Faculty of Social Studies and Humanities, University of Mauritius, Réduit, Mauritius.
| Email: |  |
Copyright © 2014 Scientific & Academic Publishing. All Rights Reserved.
Abstract
This paper considers the judgmental approach to forecasting and three quantitative methods of forecasting; naive, seasonal naive and SARIMA. The quantitative methods are applied on the monthly tourist arrival data and the results are aggregated to obtain yearly forecasts for tourist arrival from 2007 to 2013. The results demonstrate that the qualitative approach to forecasting is accurate but does not implicate prediction intervals where uncertainties can be considered. The SARIMA forecasts are more accurate compared to the naive and seasonal naive methods of forecasting. However, the quantitative methods considered in this paper cannot take into account the changes in the dynamics of the tourism sector compared to the qualitative approach. It is therefore suggested for a forecaster to combine the two methods through a Bayesian approach to forecasting.
Keywords:
SARIMA, Prediction Intervals, Naïve, Seasonal Naïve, Bayesian
Cite this paper: Ruben Thoplan, Qualitative v/s Quantitative Forecasting of Yearly Tourist Arrival in Mauritius, International Journal of Statistics and Applications, Vol. 4 No. 4, 2014, pp. 198-203. doi: 10.5923/j.statistics.20140404.04.
1. Introduction
Forecasting is a key tool for planning and decision making in modern business organisations. In the tourism industry in particular, forecasting has become even more important with the increasing competition among nations for international tourism. Tourist arrivals worldwide reached 1087 million in 2013 compared to 1035 million in 2012 with a growth of 5%, [1]. With such an upsurge in the tourism sector around the world, it is increasingly essential to make accurate forecast of tourist arrival in Mauritius because of the competitiveness of this sector. The Statistics Mauritius (SM), the national Statistics office, commonly uses the judgmental approach to forecast the total number of tourists who will visit the island during a year. These judgmental forecasts are derived in a committee comprising major stakeholders with a wide experience of the tourism industry in Mauritius. However, instead of using judgmental forecast alone it is advised to combine the forecast with other methods as this could raise accuracy in forecasts, [2]. Hence, it is important to consider alternative forecasting schemes.The major aim of this paper is to propose alternatives to the judgmental forecasts of tourist arrivals made by SM. Indeed, [3] believes that there need to be some form of consensus among researchers and practitioners. In this effect, a naïve, seasonal naïve and seasonal autoregressive integrated moving average (SARIMA) models are proposed as promising forecasting tools from researchers which could be adopted by practitioners to come up with mature forecasts. In fact, the SARIMA model introduced in [11], is a model which allows a forecaster to take into consideration the seasonal behaviour inherent in a time series. The model is discussed further in section 3 of this paper. The forecasting accuracy of the different models is then compared with the judgmental forecast. Section 2 of this paper discusses the judgmental, naïve and seasonal naïve method of forecasting. Section 3 introduces the SARIMA model and the same is fitted to the monthly tourist arrival data to obtain yearly forecasts. Section 4 briefly compares the different forecasts obtained through the models mentioned in sections 2 and 3. Section 5 attempts some discussions and recommendations.
2. Judgmental and Naïve Forecasts
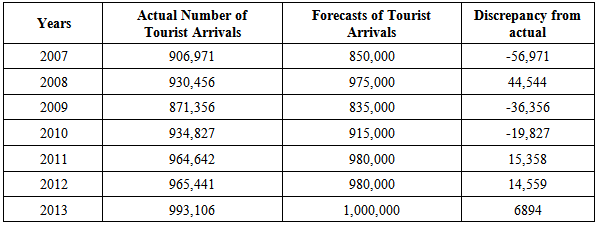
Judgmental forecast is a subjective method of forecasting which has its pros and cons. Even if the intervention of human can prove to be advantageous in terms of forecasting accuracy, it can be subject to many biases, [4]. However, the limitations of this method can be reduced by adopting systematic and well-structured approaches which eventually reduces forecasting error, [5]. As a matter of fact, [6] argue that the judgmental approach is overall not necessarily less accurate than statistical forecasting and in certain circumstances is more accurate. SM performs judgmental forecasts as mentioned earlier. The forecasts are updated several times during a certain year where the first forecast for the year is generally published in February of the same year. “A Tourism Statistics Committee grouping various stakeholders of the tourism industry meet regularly under the chairmanship of Statistics Mauritius to discuss performance of the tourism sector and to provide information for short-term forecast of tourist arrivals”, [7]. Table 1 gives the yearly forecasts made by SM for the years 2007-2013. The forecasts provided in table 1 relate to the first forecasts made for a specific year provided by SM based on available publications. In 2009, there was a fall in the forecast and the actual number of tourist arrivals. This is explained by as being due to economic downturn observed in the main markets of Mauritius during that period. There is an evident tendency for the SM to make better forecast over years. The method incontestably indicates the capacity of the Tourism Statistics Committee to use expert information to make judgmental forecast. However, this judgemental approach rests heavily on human conclusion and is therefore subject to bias even if the method gives high forecast accuracy.Table 1. Judgmental Yearly Forecasts provided by SM
 |
| |
|
The qualitative approach to forecasting is sometimes favoured over the quantitave approach by practioners for several reasons which include lack of exposure to methods such as Autoregressive Integrated Moving Average (ARIMA) or econometric forecasting models, lack of forecasting software, risk-aversion to implement new techniques and little incentive to improve forecast accuracy, [9]. In fact, a number of studies have revealed that simple quantitative forecasting methods provide viable alternatives to more complex time series modelling. Therefore, we present the results from two very simple quantitative forecasting methods (naïve and seasonal naïve) in view of identifying whether these two very simple quantitative approaches could be adopted by practitioners. These two methods do not require much of expertise information for application. In addition, there is even no need for any specific statistical software to be able to apply these two methods. For example, point forecasts from these two methods can be directly obtained through Excel. However, by using the R Statistical language [10], it is possible to produce prediction intervals as well.From the naïve method, also known as “no change” method of forecasting, each forecast is set to the last observed value which makes it a very simple method of forecasting. More formally, the naïve method can be viewed as a random walk without drift where  | (1) |
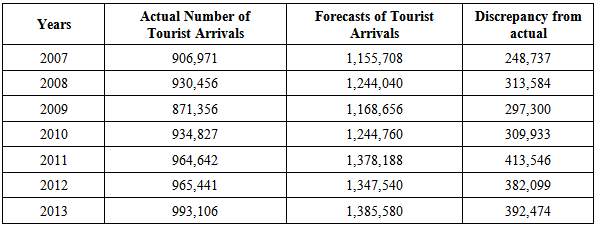
To obtain the prediction interval, it is assumed that the errors are normally distributed and uncorrelated. For this reason, the prediction intervals are not produced as this assumption will not hold for our data as pattern in the residuals will be present due to the seasonal component. Only point forecasts are produced for this method as the prediction interval would be insensible. The results from the naïve forecast are presented in table 2. The naïve forecast method distinctly does not show strength in accuracy with discrepancies of a magnitude of around 300 thousands. This method actually has a strong limitation as it does not capture the seasonal effect present in the data and is not recommended for application in the presence of a seasonal component in the data.Table 2. Yearly Naïve Forecasts
 |
| |
|
To curb the limitations of the naïve forecasts, a seasonal naïve forecast is proposed. This method of forecasting is such that the predicted value is set to the last observed value from the same season of the year. Following the notation of [5],  | (2) |
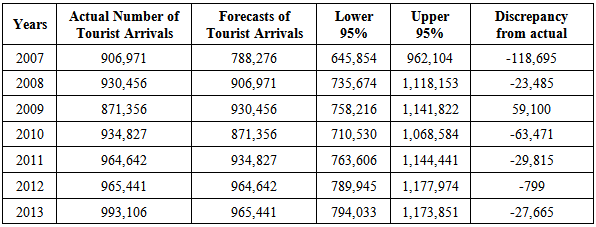
where m represents the seasonal period and k=((h-1)/m)+1. The seasonal naïve forecasting model can be viewed as an ARIMA(0,0,0)(0,1,0)m model, that is a seasonal random walk. The parameters of an ARIMA model are (p,d,q) (P,D,Q). Where p and P are the parameters of the non-seasonal and seasonal AR terms respectively, q and Q are the parameters of the non-seasonal and seasonal MA terms respectively. d and D are the differencing order for the non-seasonal and seasonal component respectively. In the above stated model, there are no autoregressive or moving average terms except a seasonal differencing where the period is m. In fact, an ARIMA(p,d,q) (P,D,Q)m is also refered to as a SARIMA(p,d,q)(P,D,Q)m.. For the seasonal naïve model, in addition to the point forecasts, the 95% prediction intervals are also produced to know the uncertainty associated with each forecast. The results are shown in table 3. Table 3. Yearly Seasonal Naïve Forecast
 |
| |
|
The results from the seasonal naïve method shows a remarkable forecast for year 2012 with a discrepancy of 799 tourists. Such a remarkable forecast for a specific year is not acquired from the judgmental approach. When the 95% prediction interval is considered, all the actual number of tourist arrivals per year since 2007 to 2013 are located within the limits of the intervals provided. This method of forecasting should not be disregarded as it has the capacity to provide accurate interval estimates for the tourist arrival data. The seasonal naïve model nevertheless systematically understimates the number of tourist arrivals except for year 2009 where there was an economic downturn. The reason for this systematic underestimate of the number of tourist arrival every year is the increasing trend that can be observed from figure 1 for the yearly tourist arrival. This increasing trend cannot be captured through the seasonal naïve method as it assumes no change from year to year and therefore underestimate the tourist arrival data. The next section deals with a forecasting model which requires a technical proficiency.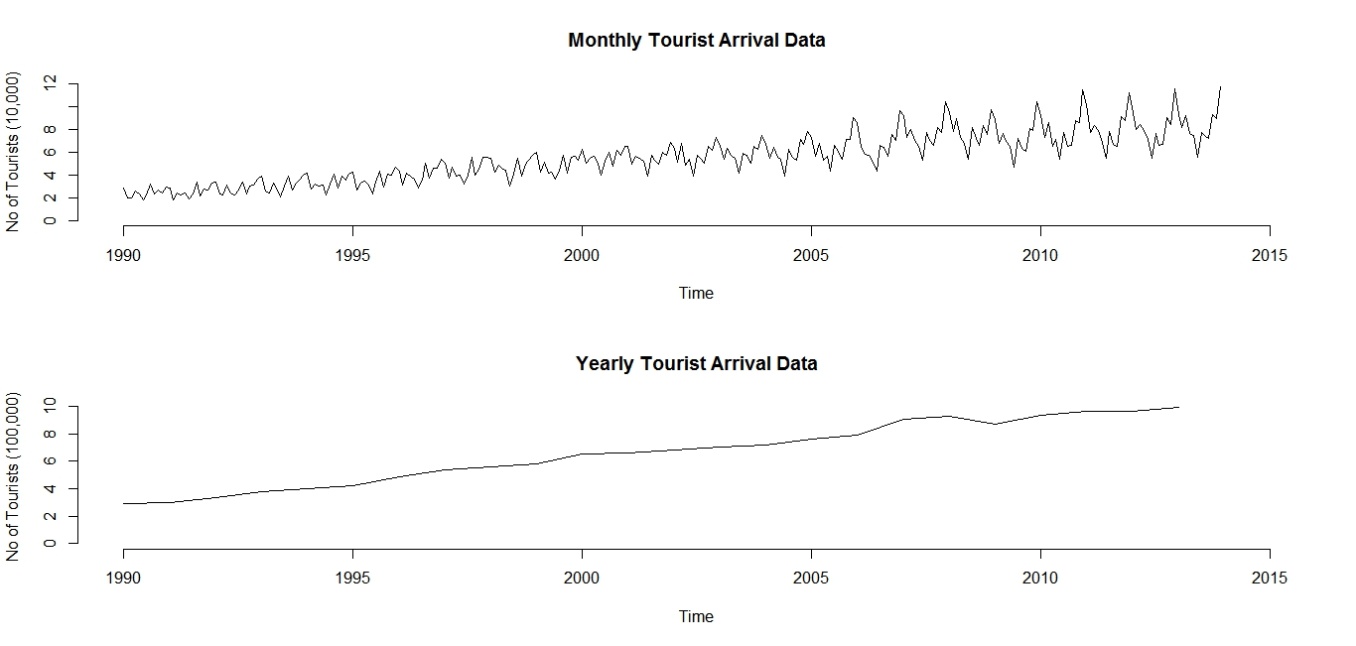 | Figure 1. Monthly and Yearly Tourist Arrival Data |
3. SARIMA Forecast
The seasonal autoregressive integrated moving average (SARIMA) model enables one to model a time series data where there is seasonal effect. Using the notation from [11], a general seasonal model can be denoted as  | (3) |
Where:B is the backward shift operator (AR operator of order p)
 (Seasonal AR operator of order P)
 (MA operator of order q)
 (Seasonal MA operator of order Q).
 xt is the log number of tourist arrival per month.at is an independent random variable with zero mean and constant variance. The SARIMA model is generally denoted as a SARIMA(p,d,q)(P,D,Q)m where p, d and q are the order of the non-seasonal AR term, differencing and MA term respectively. P, D and Q are the order of the seasonal AR term, differencing and MA term respectively.Based on the Box-Jenkins procedure, building a SARIMA model involves three steps; model identification, model estimation and model checking. A SARIMA model can usually be identified through the autocorrelation function (acf) and partial autocorrelation function (pacf) plots of the first difference of the series and the first seasonal difference.As forecasts have to be derived from the SARIMA models for years 2007 to 2013, the Box-Jenkins procedure is repeated seven times in this paper. In a first instance, the monthly tourist arrival data from January 1990 to December 2006 is used to fit a SARIMA model using the Box-Jenkins procedure. The next step involves applying the Box-Jenkins procedure to fit a SARIMA model again over the period January 1990 to December 2007. This operation is continued until December 2012. So, seven SARIMA models are fitted over seven monthly training datasets as explained above and each model is used to derive forecasts over a horizon of 12 months which are aggregated to obtain a yearly forecast.The order (p,d,q)(P,D,Q) for each model is identified from the acf and the pacf plots of the first difference and the first seasonal difference of the log of tourist arrival data. After having identified the model, the parameters of the model are estimated but not presented in this paper as the focus is about forecasting. The diagnostic checks are carried out for each model to ensure that its assumptions are held. If any pattern remains in the acf plot of the residuals, the assumption of independence in the error terms would not hold. Therefore, the acf plot of residuals is produced for each model. In addition, the normal quantile-quantile plot of standardized residuals is produced for each model to check for the normality of residuals. Then, the Ljung-Box test is carried out on the residuals to test if the residuals are independently distributed. Using the notation in [12], the new test statistics of the Ljung-Box test is given by
 | (4) |
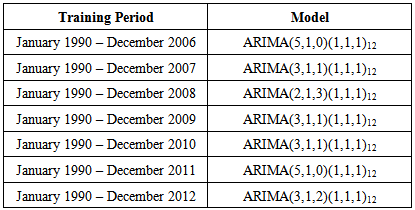
where n is the sample size, m is the number of lags tested, and  is the sample autocorrelation at lag k.The SARIMA models identified for the different time periods are provided in table 4. For all of these models mentioned, the assumptions of normality are held and the acf plots of residuals are not statistically significant. Besides, the p-values for the lags of the residuals are greater than 0.05 indicating that the residuals are independently distributed.
Table 4. SARIMA models identified
 |
| |
|
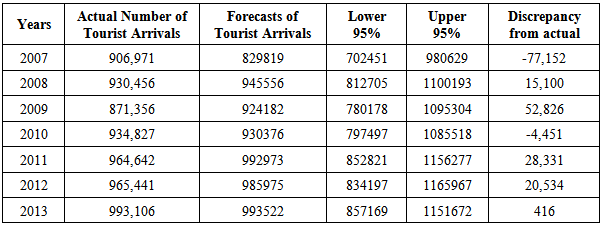
Table 5 gives the forecasts obtained from the SARIMA models mentioned in table 4. Overall, the results of the SARIMA forecasts tend to overestimate the actual number of tourist arrival except for year 2007 and 2010. Nevertheless, the point forecasts are relatively close to the actual number of tourist arrival per year. For example, in 2010 and 2013, the SARIMA forecasts are outstanding. All the prediction intervals include the actual number of tourist arrivals per year showing the accuracy of the SARIMA models used in forecasting data with seasonal component. Table 5. Yearly SARIMA Forecasts
 |
| |
|
4. Forecasts Competition
We here compare the forecasts of the four methods mentioned earlier. Figure 2 shows the forecasts from the judgmental, naïve, seasonal naïve and SARIMA methods of forecasting. The naïve method is very poor in terms of forecast accuracy compared to all the other methods. This model is not to be considered in the presence of seasonal effect. In addition, the forecasts from the seasonal naïve method is better than the naïve method which is intuitive because the seasonal naïve method captures the seasonal effect present in the data. The seasonal naïve forecasts are also relatively close to the actual values but are less consistent compared to the judgmental and SARIMA forecasts.The method which is closer to the actual value as a whole is the judgmental forecasting method. However, the judgmental forecasts have more variation compared to the SARIMA forecasts. One of the remarkable point of the SARIMA forecasts is that it is the only method to produce two forecasts very close to the actual values.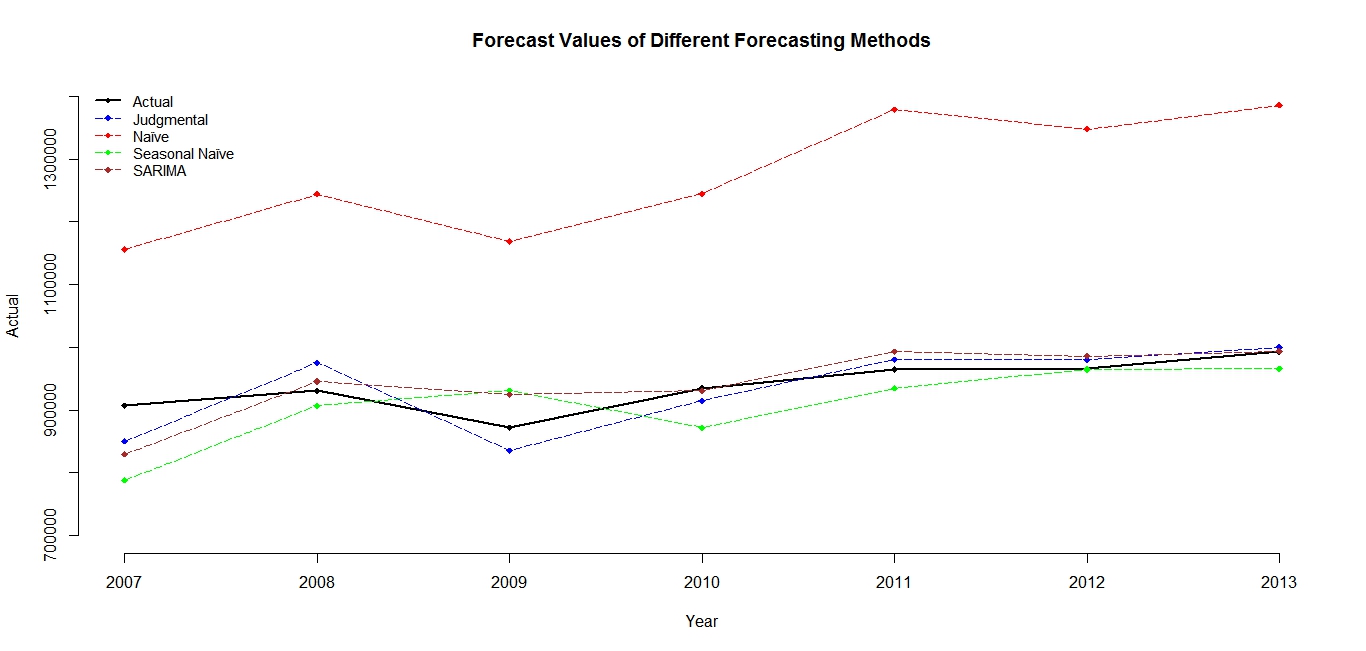 | Figure 2. Forecasts of Different Methods |
All the quantitative models do not predict well the yearly tourist arrival for years 2007 and 2009. For these two years, it is the qualitative method of forecasting which win over the quantitative ones. In this regard, the qualitative method has proved to be potentially powerful when there are changes in the dynamics of the tourism sector. Changes like the economic turndown in 2009 could be captured only through the judgmental forecast but not through the quantitative methods.
5. Conclusions
Both the judgmental and the SARIMA forecasts have proved to be unequivocal as a whole. The SARIMA has the benefit of providing unbiased interval estimates as compared to the judgmental approach which does not produce prediction intervals. Indeed, the prediction intervals of the SARIMA are narrrower than the seasonal naïve and are all accurate. It is thefore a model which should be considered while forecasting the monthly tourist arrival data. It should be acknowleged that even if the seasonal naïve method does not give point forecasts as accurate as the judgmental approach, it does provide accurate interval estimates at the 95% confidence level. Therefore, the forecaster should not neglect this method of forecasting. On the contrary, it is advised that the forecaster considers the seasonal naïve method and the SARIMA method if the data is highly seasonal and tries to obtain a consensus with the judgmental approach to forecasting.It is believed that both the qualitative and quantitive methods (excluding the naïve forecasting method) have their own fortes which should be exploited by the forecaster. The seasonal naïve is simple. The judgmental adapts to changes that cannot be easily captured through the other methods in this paper. The SARIMA provides more consistent results with higher prospect of obtaining more accurate forecasts. Consequently, as a further research, a forecaster can consider the Bayesian approach to forecasting. The Bayesian approach allows one to incorporate information from the tourism sector in the forecasting procedure to come up with more accurate forecasts in a quantitative manner. So, if one wants to obtain mature forecasts, it is suggested that both researchers and practitioners meet to come up with forecasts which are unbiased and accurate through the Bayesian approach.
References
| [1] | W. T. Organisation, "UNWTO Annual Report," World Tourism Organization (UNWTO), Madrid, Spain, 2013. |
| [2] | M. J. Lawrence, R. H. Edmundson and M. J. O'Connor, "The Accuracy of Combining Judgemental and Statistical Forecasts," Management Science, vol. 32, no. 12, pp. 1521-1532, 1986. |
| [3] | S. Makridakis, "The art and science of forecasting An assessment and future directions," International Journal of Forecasting, vol. 2, no. 1, pp. 15-39, 1986. |
| [4] | M. Lawrence, P. Goodwin, M. O'Connor and D. Önkal, "Judgmental forecasting: A review of progress over the last 25 years," International Journal of Forecasting, vol. 22, no. 3, p. 493–518, 2006. |
| [5] | R. J. Hyndman and G. Athanasopoulos, Forecasting: principles and practice, OTexts, 2012. |
| [6] | M. J. Lawrence, R. H. Edmundson and M. J. O'Connor, "An examination of the accuracy of judgmental extrapolation of time series," International Journal of Forecasting, vol. 1, no. 1, pp. 25-25, 1985. |
| [7] | SM, "International Travel and Tourism Year 2013," Statistics Mauritius, Port Louis, 2013. |
| [8] | SM, "International Travel and Tourism Year 2008," Central Statistics Office, Port Louis, 2009. |
| [9] | G. A. Gianakis and H. A. Frank, "Implementing Time Series Forecasting Models: Considerations for Local Governments," State & Local Government Review, vol. 25, no. 2, pp. 130-144, Spring, 1993. |
| [10] | R Core Team (2014). R: A language and environment for statistical computing. R Foundation for Statistical Computing, Vienna, Austria. URL http://www.R-project.org/. |
| [11] | G. E. Box and G. M. Jenkins, Time series analysis, forecasting and control, San Francisco: Holden-Day,1976. |
| [12] | G. M. Ljung and G. E. P. Box, "On a measure of lack of fit in time series models," Biometrika, vol. 65, no. 2, pp. 297-303, 1978. |
 Abstract
 Reference
 Full-Text PDF
 Full-text HTML