Sedigheh Shams, Masoomeh Zarshenas
Department of mathematics, Alzahra University, Tehran, Iran
Correspondence to: Sedigheh Shams, Department of mathematics, Alzahra University, Tehran, Iran.
| Email: |  |
Copyright © 2014 Scientific & Academic Publishing. All Rights Reserved.
Abstract
Modeling dependence between financial returns is regarded as a difficult task. It has been shown that, gold and oil prices and exchange rate are skewed and leptokurtic which illustrate tail dependence and asymmetric distributional properties. In this study a new methodology based on copula functions and application of GARCH models with focus on fitting these models to mention financial time series during 2001 to 2008, is used, to show their co-movement. This co-movement is very important in economic policies.
Keywords:
Co-movements, Copula, Exchange rate, GARCH, Gold price, Oil price
Cite this paper: Sedigheh Shams, Masoomeh Zarshenas, Copula Approach for Modeling Oil and Gold Prices and Exchange Rate Co-movements in Iran, International Journal of Statistics and Applications, Vol. 4 No. 3, 2014, pp. 172-175. doi: 10.5923/j.statistics.20140403.05.
1. Introduction
Oil and gold have the vital role in economics. Sharpincrease in these prices are followed by high inflation, high risk for investment and economics problems. Analysis of financial time series co-movement is very important in monetary policies. In these time series, linear correlation may fail for showing dependence structure between oil and gold and exchange rate. However there would be no cynicism over the non-normality and skewness of many financial variables. This empirical fact often rules out the use of the multivariate normal distribution.Most financial data exhibit skewness and are often modeled with GARCH models; see Christian Francq and Jean-Micheal Zakoian (2010). In these models the conditional distribution is normal or student-t. To overcome the distributional constraint, copula – GARCH models are used; see Jondeau and Rockinger (2006), Fortin and Kuzmics (2002), and Patton (2006). Copula provides grounding to join different margins in a dependence structure.The aim of this survey is to examine how oil and gold prices and exchange rate move together during8 years from 2001 to 2008 in Iran. We examine data for two periods before and after 2007, when prices started to fluctuate noticeably after asignificant upward trend. To illustrate this co-movement, copula GARCH models are used.The copula has an appealing feature which is called tail dependence. Tail dependence is a measure of probability that two variables are in lower or upper joint tails of bivariate distribution. In modeling co-movement, tail dependence shows how variables go up and down with each other.Copula-GARCH model requires the marginal distribution for the residuals of fitted time series models. Since the residuals of some autoregressive moving-average (ARMA) models are dependent, generalized autoregressive conditional heteroscedasticity (GARCH) model introduced by Angel (1982), is considered.In section 2, we note GARCH model, correlation and copula. In section 3, descriptive statistics for pre-2007 and post-2007 and also correlation coefficients are showed. In section 4, appropriate time series models are fitted.In section 5, marginal distribution for residuals will be found. In the last section, the best copula for residuals is fitted.
2. The Model Specification
2.1. GARCH Model
If an autoregressive moving average model (ARMA) be assumed for the variance of error, the model is called generalized autoregressive conditional heteroscedasticity (GARCH). In that case, the GARCH  (where
  is the order of GARCH terms,
  is the order of arch terms) is given by
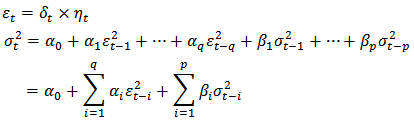 Where
Where  is the variance of error at time
  and
and  is a white noise process and
  is a sequence of (i.i.d) variables with unit variance and
 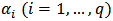 ,
, 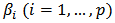 are nonnegative constants and
  is a positive constant. ARMA
  - GARCH
  model:When residuals of an ARMA model are correlated, ARMA GARCH would be beneficial which leads to uncorrelated residuals. In this model,
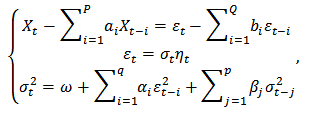 Where
Where  is an ARMA process and
  ,
,  are ARMA coefficients.
2.2. Correlation and Copula
Correlation measures are used to measure dependence of variables, such as Pearson correlation coefficient, Spearman and Kendal. Pearson correlation coefficient is based on linear association between two variables which has some disadvantages. For instance the relationship may be nonlinear and also may be asymmetric during co-movements hence this correlation would not be beneficial. Spearman correlation coefficient is a nonlinear measure associated with dependence of ranks and is useful with analyzing data in extreme observation. Kendal correlation coefficient measures dependence between ranked data. Left or right tail dependence measures tendency of variables to go up and down at the same time, which would be beneficial in economics and risk management. These types of correlations have association with copula functions. By Sklar’stheorem, it can be possible to construct joint distribution,  , for two continuous random variable
  , with marginal distributions
  ,
,  through copula function C by
 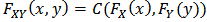 .A copula is a cumulative distribution function with uniform marginal distributions
  and
and  ,
, 
 where
where  and
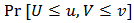
and  . Note that the copula connects margins to a multivariate distribution function without any constrains on marginal distributions. The most striking feature of copula could be regarded as tail dependence by defining
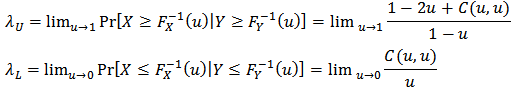 If
If  , Chas uppertail dependence, and if
  then C has not.There are some advantages in analyzing dependence structures via copula functions. First; copulas are more flexible in modeling and estimating marginal distribution using parametric multivariate distribution function. Second; copulas are invariant under monotone transformation. Third; copulas provide information not only about the strength of dependence but also about the dependence structure.Here we mention two types of most applied copulas in finance.Normal copulaIf
  have bivariate standard normal distribution with correlation
  , then the copula for
  and
and  is:
is: In which
  is the normal standard distribution function and
  is the bivariate normal distribution function with correlation parameter
  .T-student copulaLet
  are bivariate t-distributed withparameter
  as the degree of freedom and
  as correlation parameter. Then the copula for
  and
and  is:
is: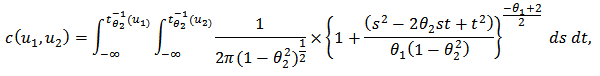 In which
  is the inverse of t-student distribution with degree of freedom
  .
.
3. Data Description
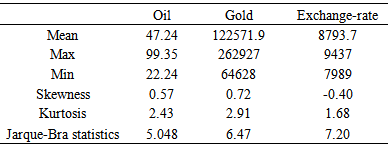
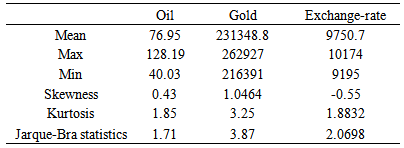
Data are considered in two periods, before and after 2007 when a noticeable fluctuation is occurred.Descriptive statistics are presented in Table 1 for two periods.All returns showed excess kurtosis. Kurtosis was generally greater inpre-2007 than post-2007, it can be interpreted as heaviness of tails in this period. For gold prices, skewness increased. Normal assumption was rejected for all the series by Jarque-Bra test.Table 1(a). Descriptive statistics (pre-2007)
 |
| |
|
Table 1(b). Descriptive statistics (post-2007)
 |
| |
|
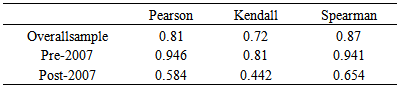
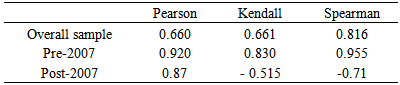
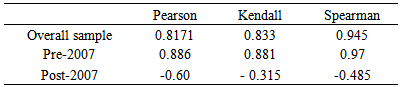
Table 2 summarizes correlation estimates for oil and gold and ex-change rate for pre and post 2007. The positive linear correlation coefficient values between oil and gold prices and exchange rate indicate that these three series moved together in a same direction, in both periods. This high correlation for overall sample, pointing to great sensitivity of these variables. Kendall’s tau and Spearman’s rho presented similar evidence. The co-movements between these prices were in general negative in post-2007 exception between oil and gold prices.Table 2(a). Correlation coefficient estimates (oil and gold)
 |
| |
|
Table 2(b). Correlation coefficient estimates (oil and exchange rate)
 |
| |
|
Table 2(c). Correlation coefficient estimates (gold and exchange rate)
 |
| |
|
4. Modeling Oil-gold Prices and Exchange Rate Co-movements
The best ARMA  -GARCH
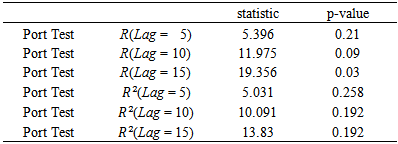
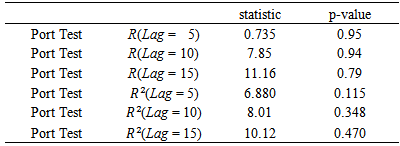
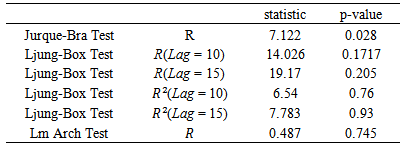
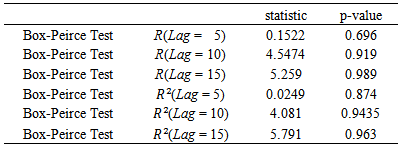
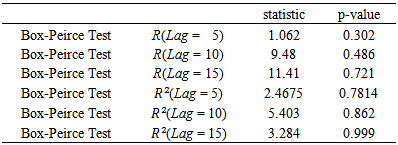
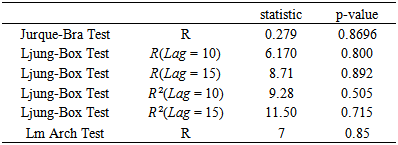
  models were estimated for the periods before and after 2007 by identifying the orders and using AIC values. As we know, after fitting ARMA models, the residuals and their squares should be uncorrelated.We examine serial correlation via Portmanteau (L-jung statistic) or Box-Peirce test; see Box, G.E.P. and Pierce, D.A. (1970). If the correlation between residuals and their squares is remained, a suitable GARCH model should be examined. In this case, the residuals became uncorrelated.In this survey, as these tables show for first period, ARIMA (1,1,1) for oil prices, ARIMA (1,1,2) for gold prices and GARCH (1,1) for exchange rate were suitable with the least AIC (Table 3).Results for second period were; ARIMA (1,2,1) for gold prices, ARIMA (1,1,1) for oil prices and GARCH (1,0) for exchange rate. The relative test results are presented in table (4).
Table 3(a). Standardized Residuals Tests (oil-pre 2007)
 |
| |
|
Table 3(b). Standardized Residuals Tests (gold-pre 2007)
 |
| |
|
Table 3(c). Standardized Residuals Tests (exchange rate-pre 2007)
 |
| |
|
Table 4(a). Standardized Residuals Tests (oil-post 2007)
 |
| |
|
Table 4(b). Standardized Residuals Tests (gold-post 2007)
 |
| |
|
Table 4(c). Standardized Residuals Tests (exchange rate-post 2007)
 |
| |
|
5. Marginal Distributions of Residuals
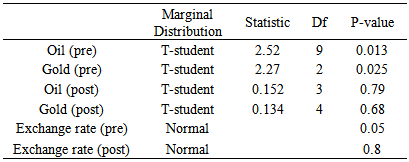
In this section, marginal distribution of residuals will be found. The goodness of fit for the margins were done by Kolmogorov-Smirnov test. The conditional normal distribution for the selected GARCH models for exchange rate was not rejected by Jurque-Bra test at the level for pre and p-value: 0.8 for post 2007. The margins for fitted ARMA models were t-student. The results are presented in Table (5). Table 5. Marginal Distributions
 |
| |
|
6. Copula Models for Describing Co-movements
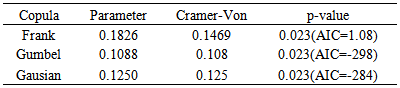
In this section, several copula function are considered to capture different patterns of dependence: tail dependence, symmetric and asymmetric tail dependence. The performance of the different copula models were evaluated by AIC and Cramer –Von statistic for goodness of fit. The results for oil and gold prices and exchange rate dependence are presented in Tables 6.Table 6(a). Fitted copula (pre-2007)
 |
| |
|
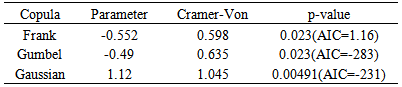
Table 6(b). Fitted copula (post-2007)
 |
| |
|
All the fitted distributions were not rejected for pre-2007. The best copula model, selected by the least AIC, was Gumbel copula. For post-2007, Gumbeland Frank were not rejected, and Gumbel copula is selected. For pre-2007, as table shows the dependence structure was positive and for post-2007 was negative. The estimated parameters indicated weak dependence for pre-2007.
7. Conclusions
Looking at the marginal distributions of the residuals of fitted time series to exchange rate and oil and gold prices we conclude that exchange rate is well described by normal and oil and gold prices are well described by t-student distribution.To model dependency, comparing different copula model, Gumbel copula for the first period and Normal copula for the second period were the best. We found a considerable decrease in oil-gold and exchange rate after 2007.Looking at asymmetric tail dependence, the parameter estimate for Gumbel copula in pre-2007 is not very high which shows that the upper and lower tail dependence are not significant.
ACKNOWLEDGMENTS
The authors acknowledge the department of mathematics, Alzahra University.
References
| [1] | Box, G.E.P. and Pierce, D.A. (1970). Distribution of residual autocorrelations in autoregressive- integrated moving average time series models, Journal of American Statistical Association 65. |
| [2] | Chih-chiang Wu, Huimin Chung and Yu-Hsien Chang (2012). The economic value of co-movement between oil price and exchange rate using copula –based GARCH models. Energy Economics,34, 270-282 |
| [3] | Christian Francq and Jean-Micheal Zakoian (2010). GARCH Models: Structures, Statistical Inference and Financial Applications. Wiley. |
| [4] | Jondeau, E. and Rockinger, M. (2006). The Copula GARCH model of conditional dependencies: An international stock market application. Journal of International Money and Finance, 25, 827-853. |
| [5] | Fortin, I. and Kuzmics, C. (2002). Tail dependence in stock return-pairs. International Journal of Intelligent in Accounting, Finance &Management 11 (2), 89-107. |
| [6] | Patton, A. J. (2006). Modelling asymmetric exchange rate dependence .International Economic Review 47 (2),527-56. |
| [7] | Reboredo, J,C.(2011). Modelling oil price and exchange rate co-movements. Journal of policy modeling, 34(3) 419-440. |
 Abstract
 Reference
 Full-Text PDF
 Full-text HTML