H. G. Dikko, Abdulhameed A. Osi
Department of Mathematics, Ahmadu Bello University, Zaria, Nigeria
Correspondence to: Abdulhameed A. Osi, Department of Mathematics, Ahmadu Bello University, Zaria, Nigeria.
| Email: |  |
Copyright © 2014 Scientific & Academic Publishing. All Rights Reserved.
Abstract
Discriminant Analysis (DA) is a technique for the multivariate study of group differences. More specifically, it provides a method of exermining the extent to which multiple predictor variables are related to a categorical criterion. Official crime statistics in Nigeria are not easily accessible by public, where available the reliability and validity of such are subject to questioning and therefore it is not very useful. In this paper DA has been applied to create a rule to classify the State into a Safe one or unsafe one even without using the actual crime statistics. The classification result shows, Quadiratc Discriminant Analysis (QDA) method classfied 18 States as unsafe and 19 States as safe, no misclassfication which yeild an apparent error rate of 0%. The results of Linear Discriminant Analysis (LDA) method 16.7% of the unsafe States and 10.5% of the safe States are misclassfied.
Keywords:
Discriminant Analysis, Quadratic Discriminant Analysis, Linear Discriminat Analysis, Official Crime Statistics
Cite this paper: H. G. Dikko, Abdulhameed A. Osi, Discriminant Analysis as an Aid to the Classification and Prediction of Safety across States of Nigeria, International Journal of Statistics and Applications, Vol. 4 No. 3, 2014, pp. 153-160. doi: 10.5923/j.statistics.20140403.03.
1. Introduction
The safety and security topology is much more sophisticated today than in the past. Crime has been identified as a major socio-economic problem of contemporary Nigerian society. It is one that continues to attract the attention of all stakeholders, including the government and political leaders, the management and leadership of the Nigeria Police Force, corporate organizations, the organized private sector and individual citizens, as well as the international community. The challenge of crime in contemporary Nigeria is one of the major impediments to the attainment of sustainable development and economic growth.Several criminal justice, law enforcement, intelligence and security agencies exist in Nigeria to guarantee personal safety and security of property. However, the level of effectiveness and efficiency of these agencies is unsatisfactory due to several constraints that are internal and external to the organizations [1]. One of such factors is that nearly all of these organizations operate without reliable statistics and information [2]. Lack of reliable data and statistics has adversely affected the ability of the police to achieve high clearance rates, effective prosecution and high conviction rates. Due to lack of reliable criminal intelligence analysis, the prosecution department, courts and prisons are congested. Inmate population statistics in the Nigerian prisons during the past one and half decades show that between three-fifths and two-thirds of inmates were being remanded awaiting trial. Overall, the absence of reliable and valid information management systems within each of the criminal justice and security agencies has inhibited the nation’s capacity for crime prevention and control. It has also undermined the effectiveness of measures deployed against threats to security and safety in the country.Criminal statistics is define by [3] as: uniform data on offence or offenders that can be expressed in numerical terms, (2) derived from records of primary official agencies, (3) classified, tabulated and analysed to demonstrate inter-group relationships, and (4) published periodically. In Nigeria the main source of official crime statistics is the annual Abstracts of Statistics published by the National Bureau of Statistics (NBS) using Police, Courts and Prison records.A major problem in the utilization of official crime statistics in Nigeria is that of accessibility, reliability and validity: Official statistics on crime in Nigeria are not easily accessible by the public. Where available, they are not current or up-to-date. For instance, as we said the main avenue for accessing statistics on crime is the Annual Abstract of Statistics published by the NBS and the last edition of the publication is the 2011 edition which contained information about year 2010. Up to the mid-1980s the Nigeria Police Force regularly produced and published annual reports that provide meaningful data and statistics. The Report by the police contained data on arrest, cases prosecuted or under investigation, establishment and strength of personnel; discharges and discipline of personnel. At present police do not publish these reports on regular basis.The starting point here is to ask whether Crime Statistics in Nigeria, as furnished by the police are valid, reliable, and utilizable. Validity refers to the extent to which the crime figures are correct representation of actual criminality. Reliability refers to the extent to which the crime figures are the result of a consistent measure of the same phenomenon from village to village, town to town and State to State. Utility refers to the extent to which the crime figures contribute to the knowledge of crime, improving the understanding, and providing enough information for projection and planning for the future. Crime statistics produced by the Nigeria Police Force are often inaccurate and sometimes incomplete due to administrative and technical problems, includes the statistics sometimes do not include returns from some state commands that fail to submit their crime returns promptly. And because crime statistics are often now computed on demands by government or the Inspector-General of Police in order to make pronouncements, rather than on an institutionalized basis, the crime statistics produced are often inconsistent as they depend at any point on the number of state commands that have submitted returns, the diligence of officials to locate all returns from files, and the competence of compiling officers to ensure accuracy. Therefore, Existing inaccuracies in police crime statistics go beyond the traditional deficiencies, the police record is not valid relative to the actual or “true” volume of crime in the country, this is due to dark figures (unreported crimes), grey figures (reported but unrecorded crime and manipulation of records to satisfy political and, or institutional interest (as when reported increase or decrease may be advantageous to regime in power or the police force).At this point one may ask: what factors may be related to safety? Are there some variables we can observe to predict the safety and security of states even without using the actual crime rate statistics? How we construct a baseline lead to classify a particular state?The objective of this paper is to provide answers to the above questions with the help of multivariate statistical techniques based on some variables on States of Nigeria, we will use the Discriminant Analysis to create a rule to classify a State into ‘a safe’ one or ‘an unsafe’ one. The potential results are valuable for; (i) police department to increase enforcement and step up patrols in unsafe States (ii) Those living in States with high crime rates to be on the lookout for criminal offenders and (iii) State governments to decrease the crime rate by increasing or decreasing certain variables.
1.1. Multivariate Analysis in Criminology
Different researchers in criminology study different features relating to the concept, nature, prevention and control of crime. For instance, the location in space and time is an essential feature of any criminal event. The two components are so closely linked that they are considered simultaneously. This has led to so much focus upon spatial domain called the “hot spots” of crime [4].Techniques such as Multivariate Analysis of Variance, Discriminant Function Analysis, Factor Analysis, Cluster Analysis [5], Log-Linear Analysis [6], Multi-Dimensional Scaling [7], and the more sophisticated Structural Equation Analysis [8] were used by criminal justice scholars in the examination of the crime phenomenon. An Application of Multivariate Statistical Analysis on crime in U.S cities, analyzed 14 variables on 100 US cities using Principal Component Analysis, Factor Analysis and Discriminant Analysis to categorize the cities into two groups: high crime rate and low crime rate [9].Principal component analysis can also be used to determine the overall criminality. When the first eigenvector shows approximately equal loadings on all variables then the first PC measures the overall crime rate. In [10] for 1977 US crime data, the overall crime rate was determined from the first PC, and the same result was achieved by [11] for the 1985 US crime data. The second PC which is interpreted as ‘type of crime component’ has successively classified the seven crimes into violence and property crimes. Also two researches were conducted on the analysis of Crime data Using Principal Component Analysis: A case study of Katsina State [12] and An investigation on the Rate of Crime in Sokoto State using Principal Component Analysis [13].In contrast to the deterrence theory which might lead to prediction that a longer period in detention might lead to a decrease rate of future offending, the review of the empirical literature by [14] on variance estimation using two population means, concluded that length of incarceration had no clear effect on the post release behavior. Also it was found by using Multiple Regression analysis that the faster the police respond to crime the lower the crime rate may be in a given community [15].
2. Materials and Methods
2.1. Data Collection and Exploration
When talking about factors which may have impact on the crime rate, everyone can think of several variables. Fortunately, variables affecting crime has been the investigation subjects of many discipline historically. Therefore, we can summarize those known factors to impacting crime volume and crime type occurring from place to place [16] as follows:-1. Population density and level of urbanization2. Composition of the population, particularly percentage of youth3. Mode of transportation system4. Economic condition5. Cultural and Educational factors6. Climate factors7. Effective strength of law enforcement agencies8. Citizens’ attitudes toward crime
2.2. Description of Data
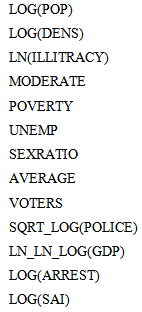
The data of poverty rate, unemployment rate, average household size, youth illiteracy rates and percentage moderate income household livelihood was collected from National Bureau of Statistics (Annual Report 2013), population, population density, sex ratio from the National Population Commission (2006 census), GDP(PPP) from ministry of finance, drug arrest and seizure arrest index(SAI) from National Drug Law Enforcement Agency (Annual report 2011), 2011 Presidential election percentage voters turnout for Independent National Electoral Commission (INEC) and police strength from Nigeria Police force. The dataset totally has 37 entries; each entry represents the information of a particular state in Nigeria. Table 3.1 gives entries of the data set, Table 3.2 are the list of all the variables and what they stand for. It’s worth mentioning that we do not include all the common variables listed above because some statistics of a States in Nigeria are not measurable, applicable or are difficult to find.
2.3. Discriminant Analysis Theory
Discriminant Analysis is a method used in statistics and pattern recognition to find a combination of features which characterize or separate two or more classes of objects or events. The resulting combination may be used as a classifier to assign objects to previously defined classes. What discriminant analysis does is to assign objects to previously defined groups. The process of classification, which is what we utilize, defines guidelines such that when followed one can determine which group an object belongs to. In our analysis, we are only concerned with the case of two groups, π1 and π2, where  and
and  are two multivariate normal populations.We distinguish between our two groups based upon the values of our random variables
  , where each group’s values for each variable differ to some degree. Each group has a population consisting of the values of its variables defined by a probability density function
  . The above mentioned guidelines are developed via a training sample. Two regions are formed, R1 and R2. The training sample splits the majority of the original sample into two known or correctly classified (by characteristics) regions and then each region R1 and R2 is associated with the group, π1 and π2 respectively. The remaining sample, n minus the size of training sample, is called the test sample. This is used to test the validity of the classification rule formed by the training sample.Measurements of all objects of one class k are characterized by a probability density function
  which is seldom known. And there might be some prior knowledge about the probability of observing a member of class k, the prior probability
  with
with  to estimate
  a training sample is used. Most often applied classification rules are based on the multivariate normal distribution.
 | (1) |
Where  are the class
  population mean vector and covariance matrix. Under such assumption, the probability that one object with given vector
  to belong to class k can be calculated by the formula below
 | (2) |
Taking the logarithm of Equation (2) will lead to the discriminant function | (3) |
and the classification rule | (4) |
The rule described in Equation (3) and Equation (4) is called Quadratic Discriminant Analysis (QDA). When a special case that all k class covariance matrices are identical  , the discriminant function can be simplified to Equation (5) which is called the Linear Discriminant Analysis (LDA).
 | (5) |
Therefore, our first step in performing Discriminant Analysis is to check to see whether or not our covariance matrices, Σ1 and Σ2, from our two group model are equal. We check the equality of our covariance matrices in order to know if we could apply linear Discriminant Analysis or Quadratic Discriminant Analysis. We check the equality of the covariance matrices by testing the null hypothesis H0: Σ1 = Σ2 against H1: Σ1 ≠ Σ2. To test the null hypothesis, we evaluate the pooled unbiased estimate of the common covariance matrix under H0, which is given by  | (6) |
Where  is the sample size of group i and
  is the
  sample covariance matrix. After evaluating Sp, we calculate the test statistic for the equality of the covariance matrices, which has a chi-square (
 ) distribution and is equal to M/c.
 Incorrect classification sometimes does occur in discriminant analysis due to the fact that the characteristics or variables of the two populations may not always be readily distinguishable. Some contributing factors to misclassification are incomplete knowledge of future performance, exhaustion of the object required for faultless information, and the event of information not being readily accessible. The guidelines followed for classification should minimize the frequency of a misclassification occurring. When determining guidelines one must look at factors such as prior probabilities and the cost of misclassification. To minimize the expected cost of misclassification (ECM) one would want the following to hold for each region:
 Where c is the cost that an object is misclassified and
  are the prior probabilities for
  . The left side of the inequalities is known as the density ratio. Under a multivariate normal population, the rule for assigning an object to either group becomes:Allocate x0 to π1 if
 Allocate x0 to π2 otherwise. Another method used to attain optimal classification would be to minimize the total probability of misclassification (TPM):
 Where Φ(z) is the cumulative distribution function of the standard normal and
3. Result and Discussion
3.1. Normality of the Data
Often, before doing any statistical modeling, it is crucial to verify whether the data at hand satisfy the underlying distribution assumptions. Multivariate normal distribution is one of the most frequently made distributional assumptions when using multivariate statistical techniques, e.g. Principal Component Analysis and Discriminant Analysis. Also, from an important property of multivariate normal distribution, we know that if  follow the multivariate normal distribution, then its individual components
  are all normally distributed. Therefore, we need to examine normality of each
  to guarantee that
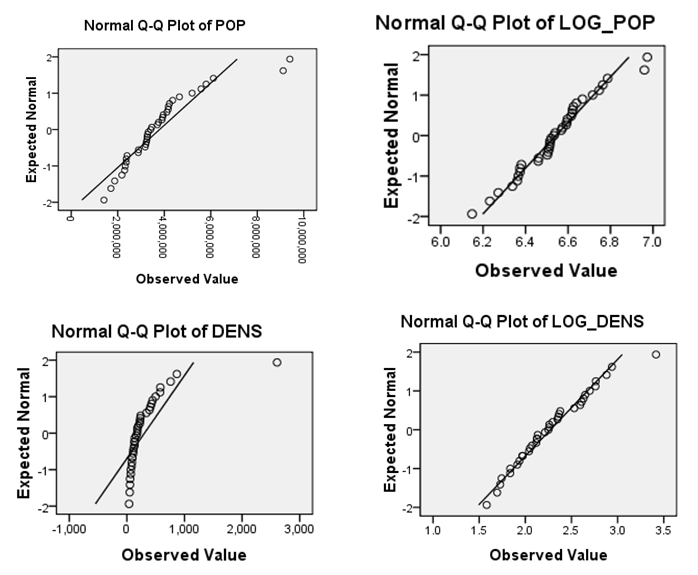
  is multivariate normal distributed.Here, we use quantile-quantile plot (QQ plot) to assess normality of data though there are more formal mathematical assessment methods. The reason is that with a large dataset, formal test can detect even mild deviations from normality which actually we may accept due to the large sample size. However, a graphical method is easier to interpret and also have the benefit to easily identify the outliers. In QQ plot, we compare the real standardized values of the variables against the standard normal distribution. The correlation between the sample data and normal quantiles will measure how well the data is modeled by a normal distribution. For normal data, the points plotted should fall approximately on a straight line in the QQ plot. If not, data transformation like logarithm, square root and power transformation can be applied to make the data appear to more closely normal distribution.Drawing QQ plot of each variable reveals that 6 out of the 13 variables approximately follow normal distribution, they are: MODERATE, POVERTY, UNEMPLOYMENT, VOTERS, SEXRATIO and AVERAGE. We try different forms of transformation on the remaining 7 variables to obtain the substitute variables which perform better on normality. Table 1 list the specific forms used to get the new variables. Figure 1 is the QQ plot of POP and GDP in terms of both before-transformation and after-transformation. We can see the effectiveness of data transformation method because data tends to be normally distributed after transformation.
Table 1. New Variables
 |
| |
|
 | Figure 1. Normality check samples |
3.2. Discriminant Analysis
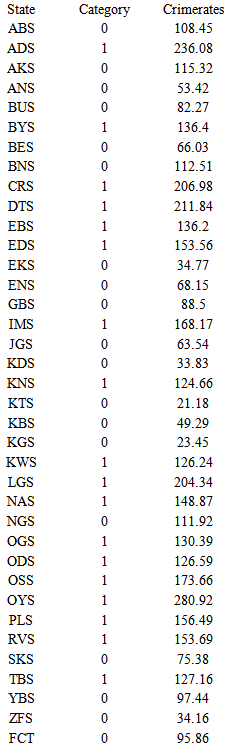
The original data is a data set that has 13 variables for 37 states of Nigeria. Here, one more response variable named CRIME will be introduced. This variable is a record of number of crimes per 100,000 people for two years (2007 and 2008). We can see Table A1 of Appendix A for reference. So our objective is to describe the 37 states as safe or not, by using DA on the known information. One thing may be noticed that the period is not consistent with other 13 variables, but we just assume it is acceptable, because one, our focus is on the DA method and two, 2007-2008 crime rate is the only crime record we are able to find for the states.Afterwards, the States have been classified as either ‘high’ or ‘low’ in crime rate based on the State’s average, which is 117.24 crimes per 100,000 people. Assign “1” to states which are above the average and “0" to those below the average. Thus, we have 19 “0s” and 18 “1s” for the 37 states.Since the data only contains 37 entries, which is felt too small data size to get the accurate classification rule if it is split into training sample and testing sample, the whole 37 by 13 data matrix is used to form the baseline of classification and test its effectiveness on these 37 observations, too. In performing the Discriminant Analysis the first step is to check whether or not the covariance matrices  are equal. Result of Chi-square test convince us that they are significantly unequal, which implies that Quadratic Discriminant Analysis (QDA) should used on the data.
3.3. Discriminant Analysis Application
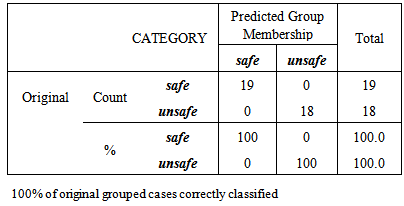
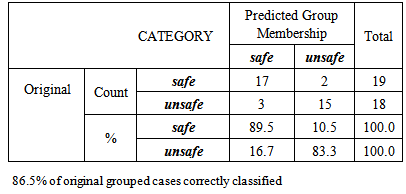
the normalized original variables are still used here, which satisfy the underlying assumption of multivariate normal distribution of DA method.Although the covariance matrices from two classes are not equal, we decided to run Linear Discriminant Analysis (LDA) as well in order to have an idea of its performance when compared to QDA. Using the classification rule generated from 37 observations to re-classify them gives the results below. Table 2 and Table 3 respectively summarize the number of misclassification and the apparent error rate of misclassification. For instance, QDA method correctly classify 18 out of 18 as unsafe states, no misclassifications which yield an apparent error rate of 0% and correctly classify 19 out of 19 as safe states also no misclassification causing an error rate of 0%, hence the percentage of correctness is 100%. However, the results of LDA method in Table 3. 16.7% of the unsafe States and 10.5% of the safe States are misclassified. We acquire 86.5% correct rate. Thus we conclude that QDA does perform better than LDA and the quite high correct rate makes us believe QDA can be effective procedure for classifying unknown observation.Table 2. Classification result of applying QDA on the original Variables
 |
| |
|
Table 3. Classification result of applying LDA on the original variables
 |
| |
|
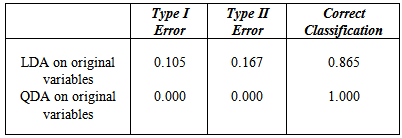
To have better view of all four circumstances conducted above, the summary of the rate of type I error (misclassify ‘safe’ to ‘unsafe), rate of type II error (misclassify ‘unsafe’ to ‘safe’) and rate of correct classification listed in Table 4. below:-Table 4. Summary of performance of all two conditions
 |
| |
|
As seen above QDA models applied on the original variables has an overwhelming advantage in classification accuracy, therefore it will be use when classifying State without using actual crime rates.
4. Conclusions
To make up the fact that the common features PCA extract is the “global” features, using not enough or inadequate representatives for discriminant on class from another, a more suitable method for discriminating different pattern classes, Discriminant Analysis could then be applied to classify the states which have no data records of crime commission rates. Apply DA on original variables and PCs' space respectively. For our case, model of discriminant function on the original variables performs best. Safety is the most important issue for everyone in Nigeria, let alone everyone in the world. We now see that we, as Nigerians, are willing to give up some of our freedom to make sure that our children grow up in a safe environment. With the help of the multivariate statistical method of Discriminant Analysis we have created a method that helps to classify a State as safe or unsafe even without using the actual crime rate statistics of the State. QDA method classified 18 States as unsafe and 19 States as safe, no misclassification which yield an apparent error rate of 0% while LDA method 16.7% of the unsafe States and 10.5% of the safe States are misclassified. We have shown certain variables such as population, sex ratio, voter turnout, police strength, unemployment rates, among others are suitable for analysis to classify a State as safe or unsafe and to help improve the safety of the State. The State Governments will be able to decrease the crime rates of their States by increasing or decreasing certain values of our variables. Thus, this study illustrates the usefulness of multivariate statistical techniques for the classification, predictions of safety, and identification of factors influence a crime rates.RecommendationsOur analysis has established that Illiteracy rates, population density, unemployment rates and poverty rates impact positively on crime, state with high illiteracy rate, unemployment rates, poverty rates and densely populated state is expected to have high crime rates. Secondly population and police strength, have impact on crime; as the lower the number of police personnel in a state, the lower the effect of crime control efforts while the higher the number of people in the state the higher the crime rates.It is therefore recommended that government should double its efforts to reduce the levels of poverty, unemployment and illiteracy through better funding and actualization of small scale industries, invest in Agriculture and Education as well. Secondly government should employ more police personnel as this would first, provide more hands in crime management and secondly reduce unemployment.For effective crime prevention and control, and promotion of safety and security through effective law enforcement, intelligence gathering and analysis, police criminal statistics need to be useful. In view of this, the Nigeria Police Force policy makers should seriously consider the development of non-uniform and non-policing personnel who are professional in Criminology and Social Statistics to handle (collation and analysis) it crime data and suggest lines of research and planning. With at least one such qualified professional in each State Police Command and about five in the Abuja Headquarters, the problem of Crime Statistics should be solved. Improvements for future study(1) The variables we choose is based on the historical study of possible factors causing crime, and also are up to the accessibility of the variables. If data resources are sufficient, we can analyze additional variables especially category variables such as major traffic mode, alcohol consumption amount because discriminant analysis has superiority when dataset involves category variables which are not verified in our research.(2) Discriminant analysis can only tell the likely class of a certain observation but do not know certain properties of an observation in a very specific degree such as within a confidence interval. Hence, we may further use regression method to find the significant variables for further prediction work.
ACKNOWLEDGEMENTS
The authors sincerely thanks ACP Garzali A. Azeez, CSP Lawal M. Lawal and ASP Ahmad U. Kyari all of Nigeria Police Force Katsina Command for their support, useful comments and suggestion to improve the quality of this articles.
Appendix A
Table A1. Crime rates
 |
| |
|
References
| [1] | Adeyemi, A. A. (1993) “Information Management for National Development, Planning and Security” in T. N. Tamuno; I. L. Bashir; E. E. O. Alemika and A. O. Akano eds. Policing Nigeria: Past, Present and Future (Lagos: Malthouse Press Limited). |
| [2] | Adeyemi, M. N. (1989) “Information Management for Crime Control in Nigeria” in B. J. Takaya ed. Security Administration and Human rights in Nigeria, Jos: University of Jos, Centre for Development Studies and the Federal Ministry of Internal Affairs. |
| [3] | Sellin, T. and Wolfgang, M.E. (1964). ‘Measurement of Delinquency’, in New Thinking in Criminal Statistics. Journal of Criminal Law, Criminology and Police Science (September, 1965) Vol. 56, No. 3: 227-284. |
| [4] | Sherman, L. W., P. R. Gartin and M. E. Buerger. 1989. “Hot Spots of Predatory Ccrime: Routine Activities and the Criminology of Place.” Criminology 27: 27-55. |
| [5] | Mc Gurk et al (1981) Log-linear analysis. |
| [6] | Crowly Joan E. and Lynne M. Adrian. 1992. “Women Misdemeanants in the Allegheny County Jail 1892-1923”. Journal of Criminal Justice 20:311-331. |
| [7] | Smith, William R.; Smith, Randall D. and Noma, Elliot. 1986. “The Multidimensionslity of Crime: A Comparison of Techniques for Scaling Delinquent Careers” Journal of Quantitative Criminology 2 (4):329-352. |
| [8] | Liu, Xiaoru and Howard B. Kaplan. 1999. “Explaining the Gender Difference in Adolescent Delinquent Behavior: A Longitudinal Test of Mediating Mechanisms.” Criminology 37 (1):195-215. |
| [9] | Williams, K and Gedeon, R (2004); Howard University http://www.users.muohio.edu/porterbm/sumj/2004/CrimeStats. |
| [10] | Printcom (2003),http://support.sas.com/onlinedoc/912/getDoc/common.hlp/images/ copyrite.htm. |
| [11] | Hardle, W. and Zdenek, H. (2007). Multivariate Statistics: Exercises and Solutions. New York: Springer-verlag. |
| [12] | Shehu U. Gulumbe, H. G. Dikko and Yusuf Bello “Analysis of Crime Data using Principal Component Analysis: A case study of Katsina State” CBN Journal of Applied Statistics. |
| [13] | U. Usman, M. Yakubu and A. Z Bello (2012) “An Investigation on the Rate of Crime in Sokoto State Using Principal Component Analysis” Nigeria Journal of Basic Applied Science 20(2): 152-160. |
| [14] | Hood Roger and Richard Sparks (1990) Key issues in Criminology. New York Mc Graw Hill. |
| [15] | Kohfeld Carol W., and John Sprague (1990): Demography, Police behavior and Deterrence. Criminology 28:11-136. |
| [16] | U.S Department of Justice, “Variables Affecting Crime", Crime in the United States, 2009, 2010. |
| [17] | Hardle, W. and Simar, L. (2003). Applied Multivariate Statistical analysis, 2nd edition. New York: Springer-verlag. |
| [18] | Rencher, A.C (2002). Methods Multivariate Analysis, 2nd edn. New York: Wiley. |
| [19] | Richard, A.J and Dean, W.W (2001). Applied Multivariate Statistical Analysis, 3rd edn. New Delhi: Prentice-Hall. |
| [20] | Bohn, R. M. And Haley, K. N. (2002). Introduction to Criminal Justice, 3rd edition, California: McGraw Hill. |
 Abstract
 Reference
 Full-Text PDF
 Full-text HTML