Muhammad Nur Aidi 1, I Made Sumertajaya 1, Lukman Maulana Yusuf 2
1Statistics Department, Bogor Agricultural University, Dramaga Bogor, Indonesia
2Alumny of Statistics Department, Bogor Agricultural University, Dramaga Bogor, Indonesia
Correspondence to: Muhammad Nur Aidi , Statistics Department, Bogor Agricultural University, Dramaga Bogor, Indonesia.
| Email: |  |
Copyright © 2014 Scientific & Academic Publishing. All Rights Reserved.
Abstract
Life Expectancy Rate (LER) is one of indicators that reflect the degree of health as a reference in planning of health programs in region. LER for each region depends on the potential of region and efforts of local government through programs to improve degree of health. In its application, the potention and effort to improving LER performed by government can be affected by adjacent surrounding areas. This is due to the limited potention in a region that encourage inter-regional cooperation in implementing programs to improve degree of health. The linkage due to location between the regions, is expected to give spatial variation effects in LER. LER modeling using classical regression is less precise due to the assumption of homogeneity which are not met. This problem can be overcome by Geographical weighted regression modeling (GWR). Geographical weighted regression (GWR) is expanded from the classical regression model into locally weighted regression. The selection of weighting functions is one determinant of GWR analysis. Classical regression model has four explanatory variables that significantly affect to response variable LER at 10% significance level. The four explanatory variables are the number of poor people (X1), the number of health facilities (X2), the percentage of health complaints (X4), and the percentage of children under five years old were immunized (X5). The classical regression model applies globally to all districts /cities in East Java province. GWR model gave resullt that eight regions with LER is influenced by three explanatory variables ie, number of poor people (X1), the number of health facilities (X2), and the percentage of children under five years old were immunized variables (X5). They are Pacitan, Ponorogo, Trenggalek, Madiun, Magetan, Ngawi, Bojonegoro districts, and Madiun City. While other thirty regions entered into the second group. They are affected by the four explanatory variables ie, number of poor people (X1), the number of health facilities (X2), the percentage of health complaints (X4), and percentage of children under five years old were immunized (X5).
Keywords:
Life Expectancy Rate (LER), Geographical Weighted Regression (GWR), Kernel gaussian weighting function
Cite this paper: Muhammad Nur Aidi , I Made Sumertajaya , Lukman Maulana Yusuf , Geographical Weighted Regression with Kernel Gaussian Weighted Function in Life Expectancy Rate (Case Study: Life Expectancy Rate of Regencies / Cities in East Java Province), International Journal of Statistics and Applications, Vol. 4 No. 3, 2014, pp. 144-152. doi: 10.5923/j.statistics.20140403.02.
1. Introduction
1.1. Background
Life Expectancy Rate (LER) is a value to be used to approximate years that can be taken by a person for life. This figure is one indicator that reflects the degree of health in area or region. It is as a reference in planning health programs in the region (BPS 2010) [2]. The success of health development in an area can be seen by increase this figure. So it can be said that LER is one tool for evaluating the performance of the government in improving the welfare of the population in general, and improve health in particular.LER depends on potential area and government programs to improve health status. The efforts to increase LER performed by the local government can be affected by adjacent surrounding areas. Because of this encouraging inter-regional cooperation in implementing programs to improve health status is urgent.One of the spatial models to take into account the spatial effect is Geographical weighted regression (GWR). GWR is one method used to overcome the problem of error variance heterogeneity due to spatial correlation of error. (Saefuddin et al. 2011) [8]. GWR is a regression model with locally weighted. According to Fotheringham et al [5]. (2002) selection of locally weighting function is urgent factor to analysis result by GWR. Weighting function is used to build the model is kernel gaussian. Weighting function was chosen because it involves the distance between the locations. So that each location will receive weighted by use the distance of the location with other locations.
1.2. Objectives
The objetives of this research are1. Applying Geographical weighted regression (GWR) model to LER of East Java province in 2010 with using a kernel gaussian. 2. Comparative model between classical regression and GWR models 3. Identify variables that affect the LER for each districts in East Java province in 2010.
2. Literature Review
2.1. Life Expectancy Rate
Life Expectancy Rate (LER) is a measure of the ability to survive or approximate years for life that can be taken by a person (BPS 2010) [3]. Life expectancy Rate is one indicator that reflects the degree of health in the region as a reference in planning health programs.The increase in LER can be affected by environmental factors, health behaviors, poverty, health care, and offspring. Low LER in a region is a problem. That region should be followed by the development of health programs, and other social programs including environmental health.
2.2. Regression Analysis
Regression analysis is a model of causal between response variable with explanatory variables. (Draper & Smith 1992)4. In general, multiple regression model can be expressed as follows: the y is the vector of response variable size (n × 1), X is the matrix of explanatory variables with size (n × p), β is the vector of regression parameters with size (p × 1), ε is the error vector with size (n × 1), and p is k + 1 where k is the number of explanatory variables.Estimation of parameters in multiple regression is obtained through ordinary least squares (OLS) as follows (Draper & Smith 1992) [4]:
 Multiple Regression Model assumptions1. Distribution normal with zero error expectation (E [εi] = 0), homogeneous variance error (E [εi2] = var [εi] = σ2), and no error autocorrelation E [εi, εj] = 0, i ≠ j).2. No multicollinearity between explanatory variables. According to Gujarati [6] (2004), detecting the presence of multicollinearity is used by VIF (Variance Inflation Factor) of each explanatory variables, the following formula:
 RK2 is the coefficient of determination when Xk regressed with other explanatory variables for k = 1,2, ... 5. If the VIF value > 10, it indicates the presence of multicollinearity between the explanatory variables.
2.3. Spatial Diversity Test
The difference value of the data between locations can lead to spatial diversity. According to Anselin [1] (2009), the identification of the spatial diversity can be performed with Breusch-Pagan test.Hypothesis Breusch-Pagan test is:H0: σ2(ui, vi) = … = σ2(un, vn) = σ2H1: minimum one σ2(ui, vi) ≠ σ2(uj, vj) for i ≠ j, and i, j =1,2,…,nstatistics test with,
with, Criteria:
 z is the standardized y response variable with size (n × 1). While ei2 is squared error for the ith observation and σ2 is the variance of ei. BP has chi-squared distribution with k degrees of freedom, where k is the number of explanatory variables.
2.4. Geographical Weighted Regression
Geographical Weighted Regression (GWR) is one of the effective approaches to address the point data have spatial diversity issues. Basically GWR bring classical linear regression model framework into a model locally weighted regression (Fotheringham et al. 2002) [5]. According to Fotheringham et al. (2002) [5], in general the model GWR can be written as follows: yi is the value of the i-th response variable, (ui, vi) states the coordinate location at location-i, Xik is the value of the k-th explanatory variable of the i-th location, βk (ui, vi) is the k-th parameter value of the i-th location, and εi is the error value of the regression between the explanatory variables on the response variable to the location-i, with i = 1,2, ..., 38.Estimation of parameters in GWR obtained through weighted least squares method (Weighted Least Square) (Fotheringham et al. 2002) [5], the following equation:
 W (ui, vi) is a diagonal matrix with size (n × n) is a spatial weighting matrix that contain the distance i-th location with other locations. Weighting function is used to construct a weighted matrix in this study is a kernel gaussian weighting function. In the kernel gaussian weighting function, each location will receive weighted according to the distance of the location with other locations, the following formula is:
 with dij is the Euclidean distance from location-i to location-j, and b is the optimum window width. In the kernel gaussian weighting function, (wj (i)) will be close to one as the closer the distance between the location of the i-th with the j-th location and value weighted (wj(i)) will decline as increasingly distance between the location-i to location-j. Illustration of the spatial weighting using a kernel gaussian function can be seen in Figure 1.
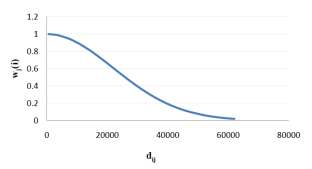 | Figure 1. Spatial weighted by kernel gaussian function |
2.5. Cross Validation
Cross validation is one of the techniques to obtain the optimum value of the width of the window. The optimum window width is the width of the window that produces the value of cross validation (CV) minimum. According to Fotheringham et al. [5] (2002) cross validation in general can be formulated as follows: with
with  is the estimated value of y where i-th location is removed from the prediction process. Search the optimum window width values obtained through the iteration process by changing the value of the width of the window (b) to obtain the minimum CV.
2.6. Test Parameters GWR Model
Testing the model parameters for each location is done partially in order to know which are the parameters affect the response variable at each location. The hypothesis is: H0: βk (ui, vi) = 0 H1: at least one βk (ui, vi) ≠ 0For k =1,2,…5 and i =1,2,…,38.Statistics test: Criteria:
 ,
,  is diagonal matrix of CC' where C=(X’W(ui,vi)X)-1X’W(ui,vi).
  is mean sum square of error of GWR model, and v is degrees of freedom (n-k-1), k is number of explanatory variables (Nakaya et al. 2005)[7].
3. Result and Discussion
3.1. Data Exploration
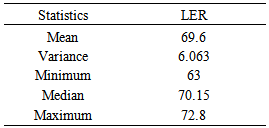
Table 1 shows that the average LER of districts/ cities at East Java Province in 2010 is 69.6, which means that survival of population of East Java Province in 2010 is 69.6 years old. Maximum LER of 72.8 and minimum of 63 which indicate that the longest survival of the population is 72.8 years old and the lowest survival was 63 years old.Table 1. Descriptive statistics of LER
 |
| |
|
Mean and median values of LER are similar. It indicates that data has normal distribution. It is also shown in Figure 2, which ploting of LER spreads in a straight line.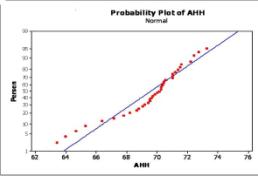 | Figure 2. Plot of LER |
3.2. Classical Regression Model
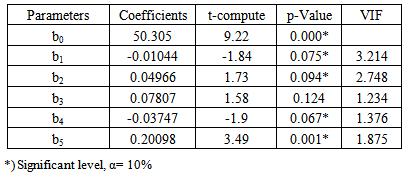
Classical regression model has four explanatory variables that significantly affect to response variable LER at 10% significance level. The four explanatory variables are the number of poor people (X1), the number of health facilities (X2), the percentage of health complaints (X4), and the percentage of children under five years old were immunized (X5). The classical regression model applies globally to all districts / cities in East Java province.Classical Regression Model is : The regression equation showed that LER will decrease by 0.0104 if there is an increasing of one unit of the number of poor people (X1) with other explanatory variables are constant. In contrast, LER will increase by 0.0497 if there is increasing of one unit of health facilities (X2) with other explanatory variables are constant. Percentage of the population that has a sanitary facility (X3) does not have effect to LER. Percentage of health complaints (X4) has a negative relationship with LER. This shows an increase of one percent in this variable will cause a decreasing of 0.0375 for LER with other explanatory variables are constant. An increase of one percent in the percentage of children under five years old were immunized (X5) will lead to an increasing of 0201 of LER with other explanatory variables are constant .AIC for the classical regression model was 155.93 and the coefficient of determination of 58.5%. The coefficient of determination of 58.5% shows the diversity of LER able to be explained by the model, while the remaining 41.5% is explained by other variables outside the model. .
3.3. Classical Regression Model Assumptions
Error has normal distribution, that be proved by the Kolmogorov - Smirnov (KS). KS-Value is 0.111 with p-value (> 0:15). Pvalue is greater than 5%. That means accept H0, which means that the error has normal distribution.Figure 3, it can be seen that the ploting of errors spread in a straight line which indicates error has normal distribution. Figure 4 shows that model has independent error. It is showed the sequence error plot of classical regression model does not form a specific pattern. Formal test of the assumption independent of error is Durbin-Watson test (DW). DW value is 1.496 at k = 5, n = 38, and 5% significance level be resulted dL = 1.2042 and dU=1.7916. It is not reject H0, which means that the error is independent.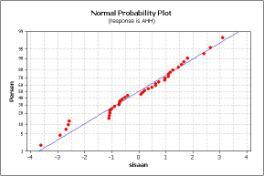 | Figure 3. Kolmogorov-Smirnov test for error |
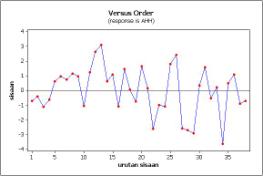 | Figure 4. Error plot with sequence error of clasical regression model |
Glejser test resulted p-value (0.008) which less than 5% significance level. It rejects H0, that means the presence of heterogeneity of the error of variance. Heterogeneity that occurs in the error variance due to the influence of spatial. To test multicollinearity in the explanatory variables is done by the Variance Inflation Factor (VIF). In Table 2 it is known that the VIF for each of the explanatory variables are less than 10. This shows that there is no multicollinearity in the explanatory variables.Table 2. Estimating and testing parameters of classical regresssion model
 |
| |
|
3.4. Spatial Diversity Test
Breusch-Pagan test (BP) generate BP value of 13.9884 with a p-value (0.016) is less than 5% significance level. It rejects H0 which means there is spatial variability of LER of districts/cities at the province East Java in 2010. This situation needs local modeling. One of models is geographical Weighted Regression (GWR).
3.5. Geographical Weighted Regression Model
The initial step in the analysis is to determine the weighting matrix of GWR. Weighting matrix was used in this study was built by kernel gaussian. The optimum window width is obtained through cross-validation technique of the equation  which is lowest CV value. The lowest CV from Kernel Gaussion be provided in Figure 5.
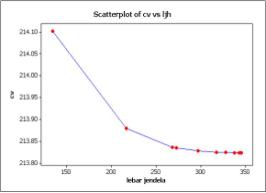 | Figure 5. Lowest CV of kernel gaussion |
In Figure 5 it was known that the optimum window width (b) for the kernel gaussian is 345.4 km with the smallest CV ie, 213.8. The width of window (b) is substituted into the kernel gaussian function.
3.6. Partial Test Parameters Each Region
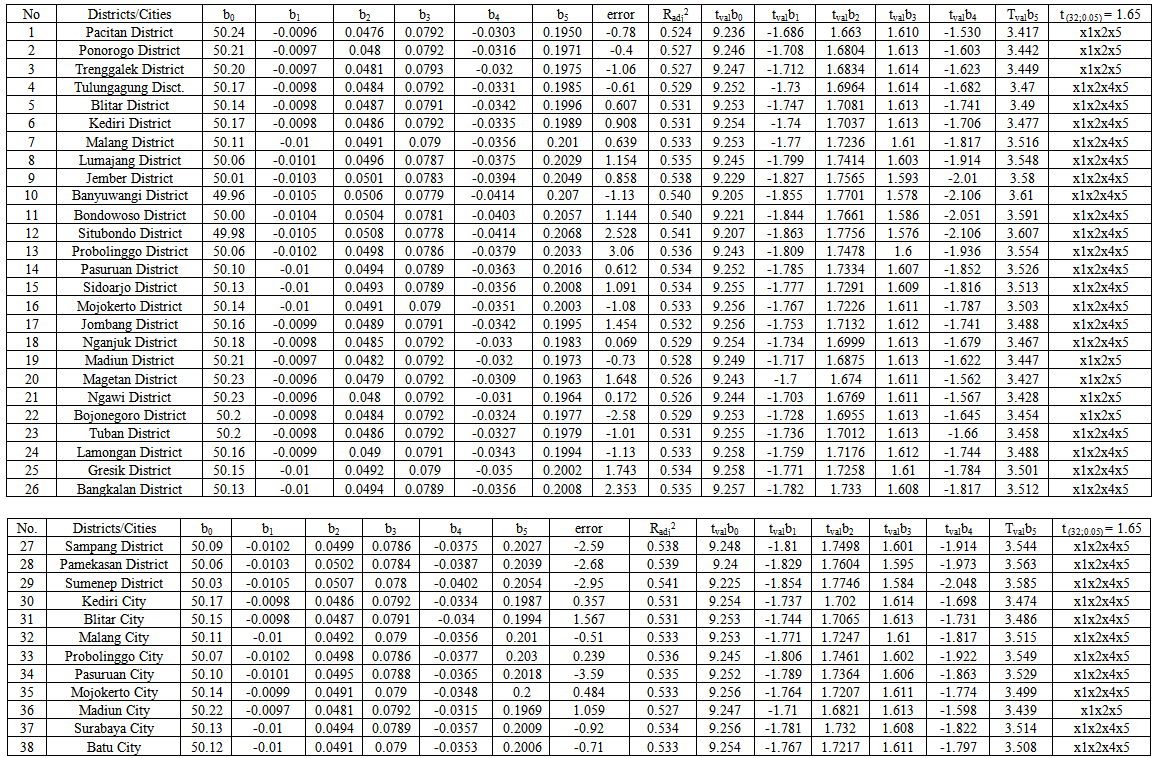
Partial test parameters (t-test) was conducted to determine the explanatory variables that significantly affect LER in each region. Partial test parameters uses α = 10%, and 32 degrees of freedom has t-value 1.65. Based on Classical Regression model, There are four explanatory variables that have significant affect to LER. They are number of poor people (X1), the number of facilities health (X2), the percentage of health complaints (X4), and percentage of children being immunized (X5). Partial test of the parameters of GWR model formed two groups based on the explanatory variables that significantly affect to LER. Appendix 1 shows that eight regions with LER is influenced by three explanatory variables ie, number of poor people (X1), the number of health facilities (X2), and the percentage of children under five years old were immunized variables (X5). They are Pacitan, Ponorogo, Trenggalek, Madiun, Magetan, Ngawi, Bojonegoro districts, and Madiun City. While other thirty regions entered into the second group. They are affected by the four explanatory variables ie, number of poor people (X1), the number of health facilities (X2), the percentage of health complaints (X4), and percentage of children under five years old were immunized (X5). LER modeling using RTG with Gaussian kernel weighting function showed no areas that LER is affected by percentage of the population that has a sanitary facility (X3). The modeling also shows that there are three explanatory variables that affect the LER in all districts/cities in East Java Province, namely, number of poor people (X1), the number of health facilities (X2), and the percentage of children under five years old were immunized (X5) (Figure 6).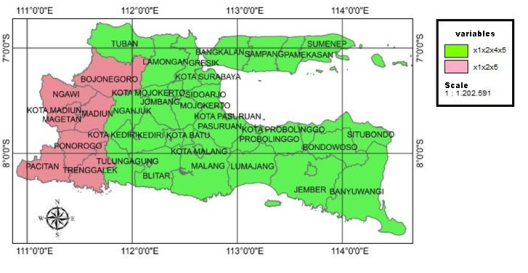 | Figure 6. Distribution of variables affect to LER at each Region |
3.7. Parameter Estimation of GWR Model
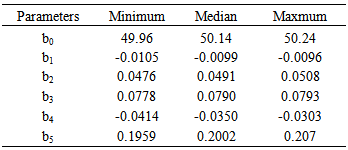
In Table 3, parameters b1 and b4 in GWR model with Gaussian kernel have negative values. This means increasing in number of poor people (X1) and the percentage of health complaints (X4), LER will decrease. While the parameters b2, b3, and b5 have positive values, that means one of each variables, such as the number of health facilities (X2), the percentage of people who have sanitary facilities (X3), and the percentage of children under five years old were immunized (X5) increase, LER will decrease.Table 3. Summary of Parameter Estimated of GWR model with Kernel Gaussion
 |
| |
|
3.8. Estimated Value of Parameters
The values of the parameter estimated of GWR modeling presented map form. The region has the highest estimated value parameter for each variable is shown with solid shading and will increasingly tenuous as more low value of the parameter values. In Figure 7, it is known that high value of parameters of number of poor people (X1) occurred in 15 districts/cities in the western part of East Java Province, namely, Pacitan, Trenggalek, Ponorogo, Magetan, Ngawi, Bojonegoro, Tulungagung, Kediri. Nganjuk, Tuban Districs and Madiun, Kediri, Blitar Cities. The high value of parameters of percentage of health complaints (X4) occured in Pacitan, Tenggalek, Ponorogo, Magetan, Ngawi, Bojonegoro, Tuban Districs and Madiun City.Regions with high value of parameters of number of poor people (X1) and percentage of health complaints (X4) mean government gives more attention because those two variables have negative effect to LER. So the improvement of both variables (decrease value of those variables) in those regions will give effect LER greater than other areas.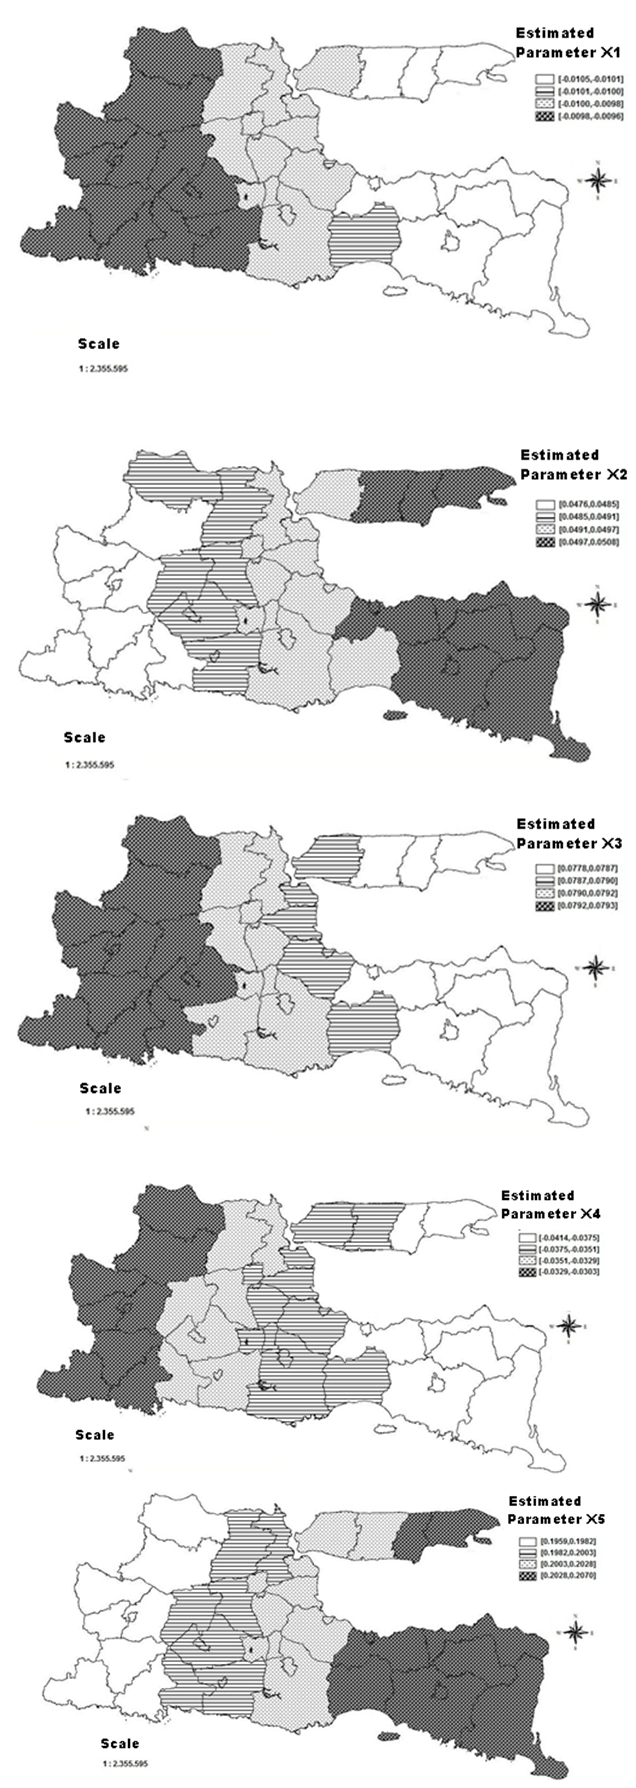 | Figure 7. Distribution of parameters value X1, X2, X3, X4 and X5 in GWR Model |
In Figure 7, it is shown the regions with low parameters of the number of health facilities (X2) occur in the western part of East Java province, namely, Pacitan, Trenggalek, Ponorogo, Tulungagung, Magetan, Ngawi, Madiun, Bojonegoro Districts and Madiun City. The regions with low percentage of the population that has sanitary (X3) occur in the eastern part of East Java province, namely, Jember, Banyuwangi, Bondowoso, Probolinggo, Sampang, Pamekasan, Sumenep Districts. The regions with low of percentage of children under five years old were immunized variables (X5) occur in the western part of East Java province, namely Pacitan, Trenggalek, Ponorogo, Magetan, Ngawi, Madiun, Bojonegoro, Tuban Districts, and Madiun City. The groups with low parameters number of health facilities (X2), percentage of the population that has a sanitary facility (X3), and children being immunized (X5) should be concerned by government, since those variables have positive relationship with LER, so improvement on three variables in this region will give effect to the Increase of LER.
4. Conclusions
● Classical regression model has four explanatory variables that significantly affect to response variable LER at 10% significance level. The four explanatory variables are the number of poor people (X1), the number of health facilities (X2), the percentage of health complaints (X4), and the percentage of children under five years old were immunized (X5). The classical regression model applies globally to all districts /cities in East Java province. ● GWR model gave resullt that eight regions with LER is influenced by three explanatory variables ie, number of poor people (X1), the number of health facilities (X2), and the percentage of children under five years old were immunized variables (X5). They are Pacitan, Ponorogo, Trenggalek, Madiun, Magetan, Ngawi, Bojonegoro districts, and Madiun City. While other thirty regions entered into the second group. They are affected by the four explanatory variables ie, number of poor people (X1), the number of health facilities (X2), the percentage of health complaints (X4), and percentage of children under five years old were immunized (X5).● LER modeling using RTG with Gaussian kernel weighting function showed no areas that LER is affected by percentage of the population that has a sanitary facility (X3). The modeling also shows that there are three explanatory variables that affect the LER in all districts/cities in East Java Province, namely, number of poor people (X1), the number of health facilities (X2), and the percentage of children under five years old were immunized (X5).
Appendix 1. Partial Test Parameters Each Region
 | Appendix 1. |
References
| [1] | Anselin L. 2009. Spatial Econometrics. Dallas: School of Social Science. |
| [2] | [BPS] Badan Pusat Statistik. 2010. Human Development Index 2009-2010 Year. Jakarta: Badan Pusat Statistik. |
| [3] | [BPS] Badan Pusat Statistik. 2010. Publication of SUSENAS East Java Province in 2010. Jakarta: Badan Pusat Statistik. |
| [4] | Draper NR, Smith H. 1992. Applied Regression Analaysis. Translated by Sumantri B,. Jakarta: Gramedia Pustaka Utama. |
| [5] | Fotheringham AS, Brunsdon C, Chartlon M. 2002. Geographical Weighted Regression, The Analysis of Spatially Varying Relationships. England: John Wiley & Sons. |
| [6] | Gujarati DN. 2004. Basic Econometrics. Fourth Edition. New York: The McGraw-Hill Companies. |
| [7] | Nakaya T, Fotheringham AS, Brunsdon C, Charlton M. 2005. Geographical Weighted Poisson Regression for Disease Association Mapping. Statistics in Medicine Vol. 24(17): 2695-2717. |
| [8] | Saefuddin A, Setiabudi NA, Achsani NA. 2011. On Comparisson between Ordinary Linear Regression and Geographical Weighted Regression: With Application to Indonesian Poverty Data. European Journal of Scientific Research Vol. 57(2): 275-285. |

 the y is the vector of response variable size (n × 1), X is the matrix of explanatory variables with size (n × p), β is the vector of regression parameters with size (p × 1), ε is the error vector with size (n × 1), and p is k + 1 where k is the number of explanatory variables.Estimation of parameters in multiple regression is obtained through ordinary least squares (OLS) as follows (Draper & Smith 1992) [4]:
 Multiple Regression Model assumptions1. Distribution normal with zero error expectation (E [εi] = 0), homogeneous variance error (E [εi2] = var [εi] = σ2), and no error autocorrelation E [εi, εj] = 0, i ≠ j).2. No multicollinearity between explanatory variables. According to Gujarati [6] (2004), detecting the presence of multicollinearity is used by VIF (Variance Inflation Factor) of each explanatory variables, the following formula:
 RK2 is the coefficient of determination when Xk regressed with other explanatory variables for k = 1,2, ... 5. If the VIF value > 10, it indicates the presence of multicollinearity between the explanatory variables.
 with,
with, Criteria:
 z is the standardized y response variable with size (n × 1). While ei2 is squared error for the ith observation and σ2 is the variance of ei. BP has chi-squared distribution with k degrees of freedom, where k is the number of explanatory variables.
 yi is the value of the i-th response variable, (ui, vi) states the coordinate location at location-i, Xik is the value of the k-th explanatory variable of the i-th location, βk (ui, vi) is the k-th parameter value of the i-th location, and εi is the error value of the regression between the explanatory variables on the response variable to the location-i, with i = 1,2, ..., 38.Estimation of parameters in GWR obtained through weighted least squares method (Weighted Least Square) (Fotheringham et al. 2002) [5], the following equation:
 W (ui, vi) is a diagonal matrix with size (n × n) is a spatial weighting matrix that contain the distance i-th location with other locations. Weighting function is used to construct a weighted matrix in this study is a kernel gaussian weighting function. In the kernel gaussian weighting function, each location will receive weighted according to the distance of the location with other locations, the following formula is:
 with dij is the Euclidean distance from location-i to location-j, and b is the optimum window width. In the kernel gaussian weighting function, (wj (i)) will be close to one as the closer the distance between the location of the i-th with the j-th location and value weighted (wj(i)) will decline as increasingly distance between the location-i to location-j. Illustration of the spatial weighting using a kernel gaussian function can be seen in Figure 1.
 with
with  is the estimated value of y where i-th location is removed from the prediction process. Search the optimum window width values obtained through the iteration process by changing the value of the width of the window (b) to obtain the minimum CV.
 Criteria:
 ,
,  is diagonal matrix of CC' where C=(X’W(ui,vi)X)-1X’W(ui,vi).
  is mean sum square of error of GWR model, and v is degrees of freedom (n-k-1), k is number of explanatory variables (Nakaya et al. 2005)[7].
 The regression equation showed that LER will decrease by 0.0104 if there is an increasing of one unit of the number of poor people (X1) with other explanatory variables are constant. In contrast, LER will increase by 0.0497 if there is increasing of one unit of health facilities (X2) with other explanatory variables are constant. Percentage of the population that has a sanitary facility (X3) does not have effect to LER. Percentage of health complaints (X4) has a negative relationship with LER. This shows an increase of one percent in this variable will cause a decreasing of 0.0375 for LER with other explanatory variables are constant. An increase of one percent in the percentage of children under five years old were immunized (X5) will lead to an increasing of 0201 of LER with other explanatory variables are constant .AIC for the classical regression model was 155.93 and the coefficient of determination of 58.5%. The coefficient of determination of 58.5% shows the diversity of LER able to be explained by the model, while the remaining 41.5% is explained by other variables outside the model. .

 which is lowest CV value. The lowest CV from Kernel Gaussion be provided in Figure 5.


 Abstract
 Reference
 Full-Text PDF
 Full-text HTML


