-
Paper Information
- Next Paper
- Previous Paper
- Paper Submission
-
Journal Information
- About This Journal
- Editorial Board
- Current Issue
- Archive
- Author Guidelines
- Contact Us
International Journal of Statistics and Applications
p-ISSN: 2168-5193 e-ISSN: 2168-5215
2014; 4(2): 117-123
doi:10.5923/j.statistics.20140402.06
Application of Two Level Factorial Experimental Design in Assessing the in vitro Effect of Nutrient Supplementation on Growth of Ceratocystis paradoxa Isolated from Coconut Palm
 Abstract
 Reference
 Full-Text PDF
 Full-text HTML
Okogbenin E. A.1, Okogbenin O. B.2, Obibuzor J. U.1, Emoghene A. O.3
1Technology and Product Development Department, Nigerian Institute for Oil palm Research (NIFOR). Edo State, Nigeria
2Plant pathology Division, Nigerian Institute for Oil palm Research (NIFOR). Edo State, Nigeria
3Department of Microbiology, Faculty of Life sciences, University of Benin, Benin City, Edo State, Nigeria
Correspondence to: Okogbenin E. A., Technology and Product Development Department, Nigerian Institute for Oil palm Research (NIFOR). Edo State, Nigeria.
| Email: |  |
Copyright © 2014 Scientific & Academic Publishing. All Rights Reserved.
Mycelia growth of C. paradoxa was evaluated using two nutrient factors; Carbon source (glucose and fructose) and Nitrogen source (peptone and asparigine). A two by two level factorial design was used to ascertain the most important nutrient factor and any possible interaction between the factors. Half normal plot revealed that Nitrogen source was the most important (P< 0.05) nutrient factor affecting the growth of C. paradoxa followed by the carbon source (P< 0.05). It also revealed significant (P< 0.05) interaction between both factors. A model was generated using Design- expert Software and statistical assumptions were validated by diagnosing residuals using normal plot for residuals and residuals versus predicted level plot. A combination of glucose and asparigine yielded the highest mycelia growth of C.paradoxa (this compared favorably with the industrially prepared PDA)while a combination of glucose and peptone yielded the least radial growth.
Keywords: Ceratocystis paradoxa, Carbon source, Nitrogen source, Factorial Design, Design-expert
Cite this paper: Okogbenin E. A., Okogbenin O. B., Obibuzor J. U., Emoghene A. O., Application of Two Level Factorial Experimental Design in Assessing the in vitro Effect of Nutrient Supplementation on Growth of Ceratocystis paradoxa Isolated from Coconut Palm, International Journal of Statistics and Applications, Vol. 4 No. 2, 2014, pp. 117-123. doi: 10.5923/j.statistics.20140402.06.
Article Outline
1. Introduction
- The fungus, Ceratosystis paradoxa belongs to the Class Ascomycota, Order Microascales and is widely distributed around the world. The fungus is highly parasitic on many economic important palms (Elliott et al., 2004) amongst which are Cocos nucifera, Elaeis guineensis, and Phoenix dactylifera. C. paradoxa is one of the major causes of black fruit rot in these palms (Wingfield et al., 1993). This pathogen has been reported by Scot Nelson, 2005 to cause stem bleeding disease of coconut and in Nigeria, the fungus has been reported by Ojomo et al., 1987 to be associated with bole rot coconut (Cocos nucifera) palms where it spreads rapidly through the soil between palms by root contact and probably by air-borne basidiospores. In vitro study of an organism is greatly influenced by the nutrient composition of the media as well as other factors. A wide range of media are used for isolation of different groups of fungi and these media are capable of influencing the vegetative growth, colony morphology and pigmentation of the organism (Kuhn and Ghannoum, 2003; Kumara and Rawal, 2008). In laboratories, most fungi including C. paradoxa are isolated on specific culture medium for cultivation; preservation and microscopical examination depending upon the nutrient composition of the culture medium (Meletiadis et al., 2001). However, the requirements for mycelia growth of these fungi are generally less controlled. Nutrient type and availability has a pronounced effect on diagnostic characters as well as rapid mycelia growth of fungi. Hence, it is often necessary to use different media containing different nutrients while attempting to carry out in vitro studies on a fungus in culture since mycelia growth rate and sporulation on artificial media are important biological characteristics for fungi identification (St-Germain and Summerbell, 1996). Using a simple design of experiment (DOE) technique, this study was therefore undertaken to assess the effect of two nutrient factors; Carbon source and Nitrogen source on mycelia growth rate of C. paradoxa isolated from coconut palm showing symptoms of bole rot to ascertain the growth effects of the nutrient sources on mycelia growth in comparison to routinely used commercial Potato dextrose agar (PDA). Two-level factorial design is an ideal statistically-based method used in identifying the vital few variables that significantly affect your process or product, leading to breakthrough improvements. It involves simultaneous adjustment of experimental factors at only two levels: high and low (Robert, 2009). The two-level design approach offers a parallel testing scheme that’s much more efficient than one-factor-at-a-time. By restricting the tests to only two levels, you minimize the number of experiments and consequently save cost. The contrast between levels gives you the necessary driving force for product and process improvement (Robert, 2009). Aside from the issue of efficiency, two-level factorial designs can uncover critical interactions that wouldn’t be revealed using one-factor-at- time experimentation or any other way (Robert, 2009).
2. Materials and Methods
2.1. Isolation and Identification of the Pathogen
- In the laboratory, under asceptic conditions, a sterile scalpel was used to scrap necrotic tissues from the point of attachment of diseased coconut fruits showing characteristic symptoms of bole rot into sterile Petri dishes. The diseased tissues were cut into bits using a sterile blade to make thin films of about of about 5×5 mm in size and placed in sterile Petri dishes. Isolation of fungi was performed by first surface sterilizing the tissues following the method of Kinkel and Andrews, 1988. The bits of samples were surface sterilized in 70% sodium hypochlorite solution for one minute after which they were rinsed carefully in three changes of sterilized water and further blotted with sterile filter paper and allowed to dry in a sterile laminar flow chamber. Commercially available Potato dextrose agar (CMA Oxoid England) was prepared according to manufacturer's instructions and allowed to cool to a temperature of 28℃ after which it was supplemented with 250mg/250ml of chloramphenicol so as to eliminate any bacterial contamination in the sample. Ten (10) mls each of the cooled PDA was dispensed into labeled petri plates and allowed to set after which the blotted tissues were transferred asceptically using a sterile wire loop into the PDA medium in plates. The plates were incubated at ambient conditions of light and temperature (30 ± 2°C) and monitored on a daily basis until growth was observed (Abou-Zeid et al., 2008). The pathogen isolated was identified by morphological and microscopical observations using Texts from Common wealth Mycological Institute (CMI) as Ceratocystis sp. The Culture was further sent to CABI laboratories, Surrey, London where it was confirmed to be Ceratocystis paradoxa (Chalara anamorph) with IMI NO. 501888. The identification was carried out using ITS DNA sequencing analysis. The sequence obtained showed 99.8-100% identity to multiple ITS sequences described from Ceratocystis paradoxa, including sequences reported in peer-reviewed literature. The isolate was stored in PDA slants and stored for further use.
2.2. Preparation of Culture Media
- The laboratory prepared potato medium was prepared as thus; One hundred (100g) grams of fresh Irish potato was weighed after peeling and placed in a 500ml Erlenmeyer flasks and boiled for one hour (). The cooked potatoes were mashed and squeezed and passed through muslin cloth to get a fine juice which was made up to 500ml using sterile distilled water and 10grams of agar powder (CMA Oxoid England) was added to the solution as a solidifying agent. The carbon and nitrogen supplemented media were prepared by weighing 0.4grams each of the following combination into four 100ml Erlenmeyer flasks labeled; Glucose + Peptone (G+P), Glucose + Asparigine (G+A), Fructose + Peptone (F+P) and Fructose + Asparigine (F+A). After weighing, 40mls each of extracted potato juice containing agar was poured into each of the flask; while a fifth 100ml Erlenmeyer flasks contained 40mls of the extracted potato juice without any nitrogen or carbon source and labeled PDA(__) and a sixth 100ml Erlenmeyer flasks contained 40mls of the commercially prepared PDA labeled (PDA). The flasks were then plugged with sterile cotton wool and covered with foil paper. All the media were sterilized using a Gallenkamp autoclave for 15 minutes at a temperature of 121℃ at a pressure of 15 Psi. After sterilization, each medium was allowed to cool after which, six (6) 10ml sterile syringe were labeled accordingly and used to dispense each medium unto the sterile, labeled Petri dishes in the laminar flow chamber and allowed to solidify.
2.3. Inoculation of Media
- Using a 5mm sterile cork borer, a mycelia disc cut was made on a three day-old culture and the organism was asceptically inoculated unto the centre of the petriplates containing the solidified medium in an inverted position in order to achieve maximum contact of the mycelium with the culture medium. The position of the disc was marked on the base of the dish with a marker pen and two perpendicular lines passing through the centre of the disc were marked to be used as references for recording growth. The cultures were incubated at room temperature (28 ± 2℃) and the experiment was carried out in triplicates. The commercial available PDA (CMA Oxoid England) and the PDA (-) were used as control for comparing the growth rate of the fungus with respect to those containing the nitrogen source. The experiment was monitored for a three day period as the organism grows rapidly. Determination of mycelia growth:Mycelial growth was determined for each medium by measuring the radial growth of the fungus from the perpendicular lines drawn on the reverse side of the plate at the end of three days using a pair of divider and a meter rule. The results were noted and recorded.
3. Results and Discussion
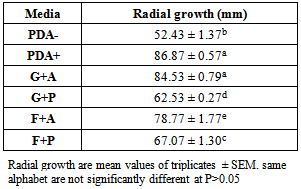
- A 2 by 2 full factorial design in triplicate, resulting in a total of 12 experimental runs, was carried out with the mycelia growth of C. paradoxa measured randomly as shown in table l. Both positive control (commercial media, PDA+) and negative control (Potato media with no supplementation) was set up alongside.
|
3.1. Half Normal Plots
- The half normal plot is a graphical tool used to identify which experiment factors have significant effect on the response (Shari Kraber, 2013). This plot shows the magnitude of the experiment’s effects as “Standardized Effects”, ordered in increasing magnitude, along the x-axis. The Standardized Effect for a factor is the difference of the average response variable over “high” factor levels minus the average response over the “low” factor levels. The values on the y-axis are given by the idealized expected values for the number of effect, ranked by increasing value, if drawn from a half-normal distribution. Figure 1 shows the half normal plot for the effect of nutrient sources on the in vitro growth of C. paradoxa. It clearly shows that Nitrogen sources used in this study as well as the interaction (only detected by factorial experiments) between the carbon and nitrogen sources used, are significant with the former being the most important factor. These single factor and interaction obviously failed the “pencil test” as they do not fall in line with the other points. For factor B (carbon source), it appears that the switch from fructose to glucose does not have any significant effect on the growth of C. parodoxa as it passes the pencil test with the other points resulting from the error from replicates.
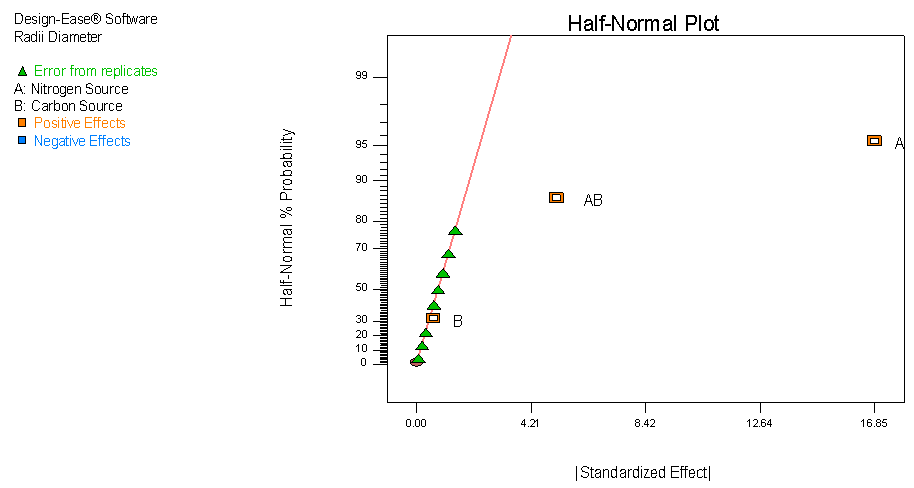 | Figure 1. Half normal plots showing effects of carbon and nitrogen sources on C. paradoxa |
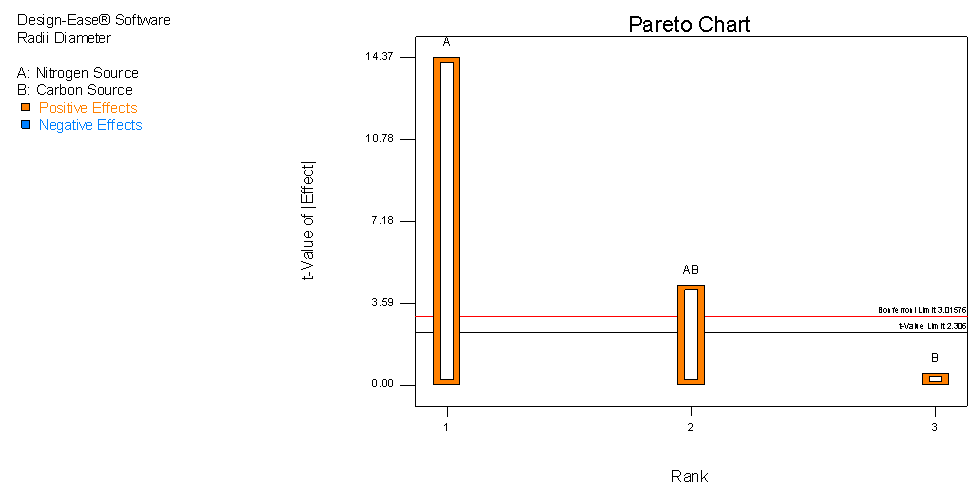 | Figure 2. Pareto chart showing the effect of carbon and nitrogen media supplementation on growth of C. paradoxa |
3.2. Interaction Plots
- An interaction occurs when one factor affects the results differently depending on the second factor. It is detected using an interaction plot. The presence of interaction in the plot is usually associated with non-parallel lines (unequal slopes) as shown in Figure 3. The interaction plot shown below reveals that when the carbon source is fructose the optimum radial growth is when the nitrogen source is peptone while when the carbon source is glucose the optimum radial growth is when the nitrogen source is asparagine.
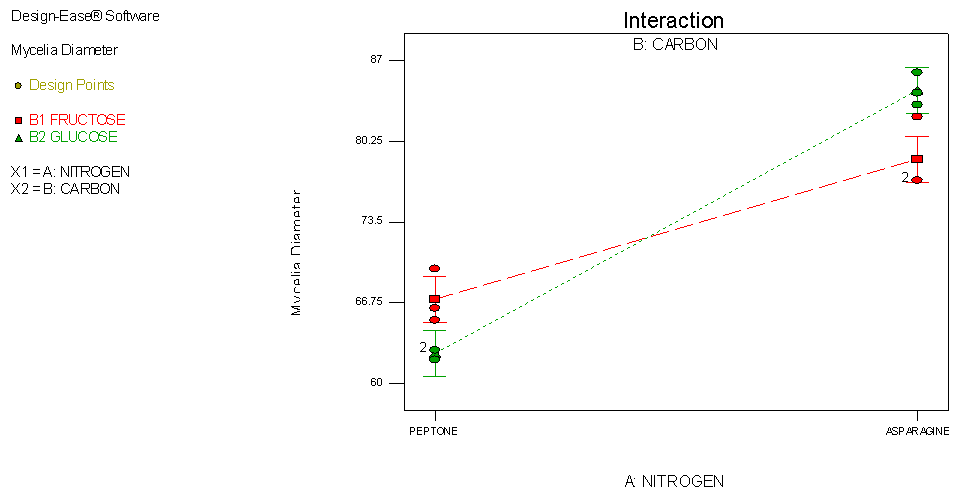 | Figure 3. Interaction plot showing the interactive effect between sources of carbon and sources nitrogen on growth of C. paradoxa |
|
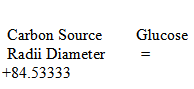
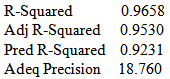 The coefficient determination, R-squared approached 1 (0.9658) and "Predicted R-Squared" of 0.9231 is in reasonable agreement with the "Adjusted R-Squared" of 0.9530 (both should not differ from each other by more than 0.2) (Shari Kraber, 2013). Adeq. Precision measures the signal to noise ratio and a ratio greater than 4 is desirable (Anderson and Patrick, 2000) The ratio achieved for this work was 18.760 which indicates an adequate signal and as such the model can be used to navigate the design space. The model generated in both coded and actual factors from the analysis is as thus:Final Equation in Terms of Coded Factors:Radii Diameter = + 73.23+8.42*A+0.31* B+2.58 * A * BFinal Equation in Terms of Actual Factors:
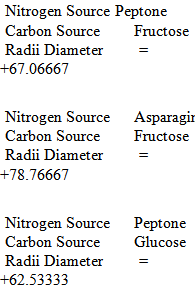
3.3. Model Validation Plots
- The main aim of a model is to develop a good predictive relationship between the dependent variable (response; mycelia growth) and the independent variable (effect; carbon and nitrogen sources). Diagnosing the residuals, which is the difference between predicted and actual values, plays a vital role in finding and validating such a relationship. Carefully looking at the residuals can tell us whether our assumptions are reasonable and our choice of model is apropraite. If assumptions are satisified, residuals should vary randomly around zero and the spread of the residuals should be about the same throughout the plot (no systematic patterns.) (Anderson and Patrick, 2007).This model generated is generally fitted under two important assumptions:● Normal distribution of residuals ● Constant variance of residuals (homoscedasticity)Departure from these assumptons usually means that the residuals contain structure that is not accounted for in the model (Anderson and Patrick, 2000). Consequently, certain inferences and predictions from the analysis may be unreliable and inaaccurate. In order to validate these statistical assumptions of normal distribution of residuals, (the difference between predicted and actual values) as well as their independence with constant variance, the two plots were generated.● Normal probability plot of the studentized residuals to check for normality of residuals.● Studentized residuals versus predicted values to check for constant error.As shown in figure 4, the deviaitons from linear are very minor, so it supports the assumption of normality. When clearly non-linear patters such as an “S” shape is observed, a response tranformation should be considered. However response tranformation is dependent on the ratio of maximum response to minimum response. Transformation becomes necessary once this ratio reaches 10 and above. For generated data, the maximun reponse is 86 while minimum is 62 a ratio of 1.3871, hence data tranformation is not necessary.
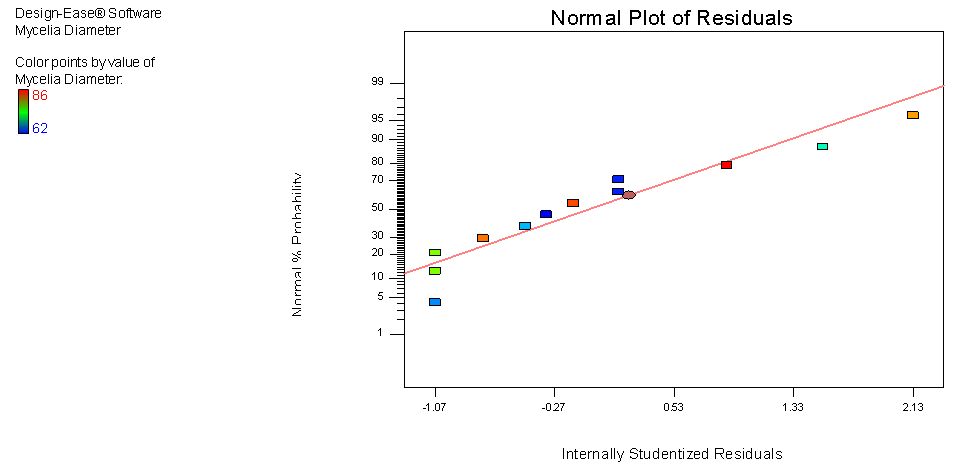 | Figure 4. Normal plot of residual for mycelia growth of C. paradoxa |
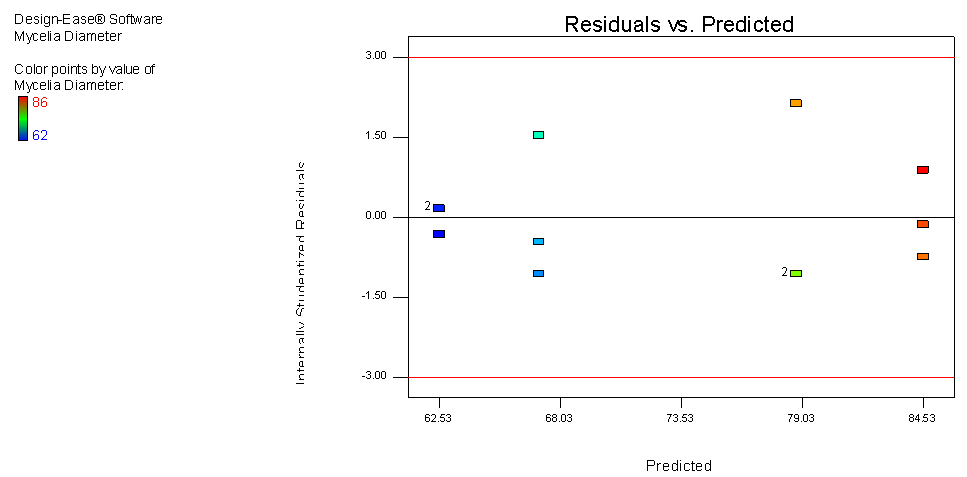 | Figure 5. Residual versus Predicted response plot for mycelia growth of C. paradoxa |
4. Conclusions
- The application of two level full factorial (2FL) design in this study was able reveal that the change from asparagine to peptone is the most important factor that affected the growth of C. paradoxa and a change from glucose to fructose had a non significant effect at P>0.05. This was achieved with both factors varied simultaneously and with minimum amount of experimental runs when compared with one factor at a time (OFAT) experiment. Also, 2FL design was able to reveal that an interaction between the carbon sources and nitrogen exist which would have not been possible to detect using OFAT. Several validation plots were generated which are simple to interpret even to non-statisticians. Consequently, the use of this statistical experimental tool should be encouraged by all those interested in improving any biological and chemical processes.
References
| [1] | Abou-Zeid A.M., Altalhi, A. D. and Abd El-Fattah, R.I. (2008). Fungal Control of Pathogenic Fungi Isolated From Some Wild Plants in Taif Governorate, Saudi Arabia. Mal .J. Microbiol. 4(1): 30-39. |
| [2] | Anderson Mark and Patrick Whitcomb (2007). Using Graphical Diagnostics to Deal with Bad Experimental Data. Quality Engineering. 19: 2. |
| [3] | Anderson Mark and Patrick Whitcomb. DOE Simplified-Practical Tools for Effective Experimentation second edition. Pp 49-56. New York: Productivity, Inc 2000. |
| [4] | Elliott, M.L., T.K. Broschat, J.Y. Uchida, and G.W. Simone (eds.). 2004. Compendium of Ornamental palm diseases and disorders. American Phytopathological Society, Minneapolis, Minn. 71 p. |
| [5] | Ojomo, E.E. and E.N. Ekpo. (1987). Identification of Major Diseases and Pests of Coconut and their Control Measures. Nigerian Institute for Oil Palm Research (NIFOR) Annual Report 24:107-108. |
| [6] | Kinkel, L.L and Andrews, J.H. (1988). Disinfestation of living leaves by hydrogen peroxide. Trans. Br. Mycol. Soc. 91: 523-528. |
| [7] | Robert, W.M (2009) Introduction to Full Factorial Designs with Two-Level Factors. A Comprehensive Guide to Factorial Two-Level Experimentation. Springer sci. Pp 3-26. |
| [8] | Shari Kraber. Introduction to Response surface methods; Part-1-Central composite design. Presentation posted at www.statease.com/webinar.html. Accessed november 2013. |
| [9] | Wingfield, M. J.,Seifert K.A.,Webber, J.F. (1993). Ceratocystis and Ophiostoma: Taxonomy, Ecology and pathogenicity. APS press, St. Pal, M.N. 293 pp. |
| [10] | Scot Nelson, (2005). Stem bleeding of Coconut Palm. Cooperate extension service, College of Tropical Agriculture and Human Resources, University of Hawai’i, Manoa. Plant Disease. PD-30. |
| [11] | Kuhn, D.M and Ghonnoumm, M.A. (2003). Indoor mold, toxigenic fungi, and Stachybotrys chartarum: Infectious disease perspective. Clin. Microbiol. Rev., 16(1): 144-172. |
| [12] | Kumara, K.L.W and Rawal, R.D. (2008). Influence of carbon, nitrogen, temperature and pH on the growth and sporulation of some Indian isolates of Colletotrichum gloeosporioides causing anthracnose disease of papaya (Carrica papaya L). Trop. Agric. Res. Ext., 11: 7- 12. |
| [13] | Meletiadis, J., Meis, JFGM., Mouton, J.W. and Verweij, P.E. (2001). Analysis of growth characteristics of filamentous fungi in different nutrient media. J. Clin. Microbiol., 39(2): 478-484. |
| [14] | G. Sharma and R. R. Pandey. (2010). Influence of culture media on growth, colony character and sporulation of fungi isolated from decaying vegetable wastes. Journal of Yeast and Fungal Research. 1(8): 157 – 164. |