-
Paper Information
- Previous Paper
- Paper Submission
-
Journal Information
- About This Journal
- Editorial Board
- Current Issue
- Archive
- Author Guidelines
- Contact Us
International Journal of Statistics and Applications
p-ISSN: 2168-5193 e-ISSN: 2168-5215
2014; 4(1): 46-57
doi:10.5923/j.statistics.20140401.05
Application of Multivariate and Bivariate Normal Distributions to Estimate Duration of Diabetes
 Abstract
 Reference
 Full-Text PDF
 Full-text HTML
Gurprit Grover1, Alka Sabharwal2, Juhi Mittal1
1Department of Statistics, University of Delhi, Delhi, 110007, India
2Department of Statistics, Kirori Mal College, University of Delhi, Delhi, 110007, India
Correspondence to: Alka Sabharwal, Department of Statistics, Kirori Mal College, University of Delhi, Delhi, 110007, India.
| Email: |  |
Copyright © 2012 Scientific & Academic Publishing. All Rights Reserved.
Diabetic nephropathy (DN) is one of the major complications of type 2 diabetes. Studies have shown that duration of diabetes and serum creatinine (SrCr) is significant predictors for determining the renal health status of a patient. In this study we have estimated the duration of diabetes of a patient on the basis of their latest renal health status. For this we have developed the joint distribution of three correlated random variables namely duration of diabetes, Serum Creatinine (SrCr) and fasting blood glucose (FBG) to estimate the duration of disease of type 2 diabetic nephropathy patients. This is done by considering two datasets; the first one gives the complete information (from the time of diagnosis till termination of study) and the other gives the latest information (latest 19 months) about the renal health status of a patient. We have used the complete information from the first data to estimate the duration of disease for the DN patients belonging to second dataset. Multivariate analysis is applied for estimating these disease durations by firstly selecting the appropriate distributions for the above three random variables. Then we have checked the normal approximation for each distribution and finally we have checked multivariate normality by applying Mardia test. The distributions of three correlated random variable were found to be approximately normal and they were also found to be jointly normal, therefore three dimensional multivariate normal (MVN) distributions is considered to be an appropriate distribution for duration of diabetes, SrCr and FBG. Conditional expectation under MVN is applied to estimate the duration of diabetes for given values of SrCr and FBG. We have also applied bivariate normal (BVN) distribution as the special case of MVN distribution and estimated the durations of diabetes on the basis of SrCr only. Further we have compared the estimated durations from both MVN and BVN distributions graphically. This estimation procedure will help medical fraternity to guide those patients who have incomplete record history, about their approximate duration of disease. Also it will help in monitoring and evaluating the severity of DN complication.
Keywords: Akaike information criterion, Bivariate normal distribution, Gamma distribution, Lognormal distribution, Mardia test, Multivariate normal distribution
Cite this paper: Gurprit Grover, Alka Sabharwal, Juhi Mittal, Application of Multivariate and Bivariate Normal Distributions to Estimate Duration of Diabetes, International Journal of Statistics and Applications, Vol. 4 No. 1, 2014, pp. 46-57. doi: 10.5923/j.statistics.20140401.05.
Article Outline
1. Introduction
- Diabetic Nephropathy (DN), or diabetic kidney disease, is a major complication of diabetes mellitus (DM) which refers to a characteristic set of structural and functional kidney abnormalities in patients with diabetes[1]. DN is considered to be an irreversible and progressive disease[2]. Approximately 40% of people with type 2 diabetes develop nephropathy and it is a leading cause of end-stage renal disease (ESRD). DN can be quantitatively defined as a Glomerular filtration rate (GFR) <60 ml/min/1.73m2. DN is more likely to develop in patients with lesser degree of glycemic control[3]. In addition, rise in serum creatinine (SrCr) has been found to be strongly correlated with the presence of renal complication and is a predictor of DN in type 2 diabetic patients[4, 5, 6]. Studies have shown that poor glycemic control (Fasting Blood Glucose (FBG)) and long duration of diabetes are the risk factors leading to progression of diabetic nephropathy with decline in GFR earlier[7, 8]. The subject that deals with data on more than one variable is called multivariate analysis. These variables may be correlated with each other, and their statistical dependence is often taken into account when analyzing such data. In fact, this consideration of statistical dependence makes multivariate analysis somewhat different in approach and considerably more complex than the corresponding univariate analysis, when there is only one response variable under consideration. Response variables under consideration are often described as random variables and since their dependence is one of the things to be accounted for in the analyses, these response variables are often described by their joint probability distribution. This consideration makes the modeling issue relatively manageable and provides a convenient framework for scientific analysis of the data[9]. Multivariate normal (MVN) distribution is one of the most frequently used distributions for the analysis of multivariate data. Unfortunately, the study of assessing multivariate normality is still at an early stage. The difficulty is mainly due to the fact that the marginal normality of each random variable does not guarantee the multivariate normality. The same problem happens in the case of bivariate normal (BVN) distribution. There are many possible ways for a bivariate distribution to deviate from bivariate normality. Different testing methods have been proposed based on the different characteristics of the lack of normality. The multivariate normality is often checked by individually examining the univariate normality through various P-P plots or some other plots, but this at times can be very subjective. One of the relatively simpler and mathematically tractable ways to find a support for the assumption of multivariate normality is by using Mardia test which is based on multivariate skewness and kurtosis measures[10]. Lipow and Eidemiller (1964) have applied BVN distribution to study the relationship between stress and strength in reliability analysis problems[11]. Yue (1999) has also applied BVN distribution to analyze the joint distributions of two correlated random variables: flood peaks and volumes as well as flood volumes and durations. They showed that BVN model can contribute meaningfully to solving several problems of hydrological engineering design and management[12]. This article provides a procedure for using multivariate and bivariate normal distributions in medical studies. We have analyzed the joint distribution of three correlated random variables: duration of disease, SrCr and FBG to estimate the duration of disease of type 2 diabetic nephropathy patients on the basis of their current renal health status. This is done by considering two data sets of type 2 DN patients namely dataset 1 and dataset 2. The first dataset gives the complete information (from the time of diagnosis of disease till the termination of study) of the renal health status of a type 2 diabetic patient and the second dataset gives the latest information about the health status of a patient collected through pathological reports of 19 months. The complete information of the three variables (duration of disease, SrCr and FBG) from dataset 1 is used to estimate the duration of disease for the patients belonging to the second dataset. Multivariate analysis is applied for estimating these disease durations by using the following procedure: firstly appropriate distributions for three random variables namely duration of diabetes, SrCr and FBG from the first dataset are obtained by fitting distributions and appropriate distributions are selected on the basis of Akaike Information Criterion (AIC) for each random variable[13]. Secondly, normal approximation is checked for each distribution. Lastly, we have checked the multivariate normality of duration of disease, SrCr and FBG by applying Mardia test. Now since the above three random variables are correlated, and are found to be marginally and jointly normally distributed, it can be concluded that three dimensional MVN distribution is an appropriate joint distribution. Then the duration of disease is obtained by applying conditional expectation under MVN distribution for given values of SrCr and FBG. The above procedure is first applied to estimate the disease durations for the first dataset for which the durations were already known. The estimated durations were found to be approximately same as the observed durations which also indicated that the applied procedure is an appropriate method of estimation. Finally MVN is applied to estimate the duration of diabetes for the DN patients belonging to dataset 2. We have also applied BVN distribution as the special case of MVN distribution. The durations of diabetes for both datasets are again estimated under BVN distribution by considering two random variables namely duration of diabetes and SrCr and by applying the same procedures as done for MVN case. We have also compared the estimated durations obtained by MVN and BVN distributions for both dataset. Not much work has been done regarding the applications of MVN & BVN distributions. Also, the conditional expectation under these distributions has never been applied on real data to estimate the mean of one random variable when the values of other variables are fixed. To the best of our knowledge this is the first investigation about the estimation of duration of diabetes for the patients who are suffering from renal complication using MVN and BVN distributions. This estimation procedure will help medical fraternity to guide those patients who have incomplete record history about their approximate duration of disease. Also it will help in monitoring and evaluating the severity of DN complication. In fact this paper will be more interesting for the statisticians to explore the applications of MVN and BVN distributions on real data. The remainder of this paper is organized as follows. In section 2 development of model is discussed. Section 3 described the data used and section 4 applies the model to the data of type 2 diabetic patients. And some concluding remarks are made under section 5. The figure 1 represents a brief algorithm of the procedure applied for estimation of durations of disease.
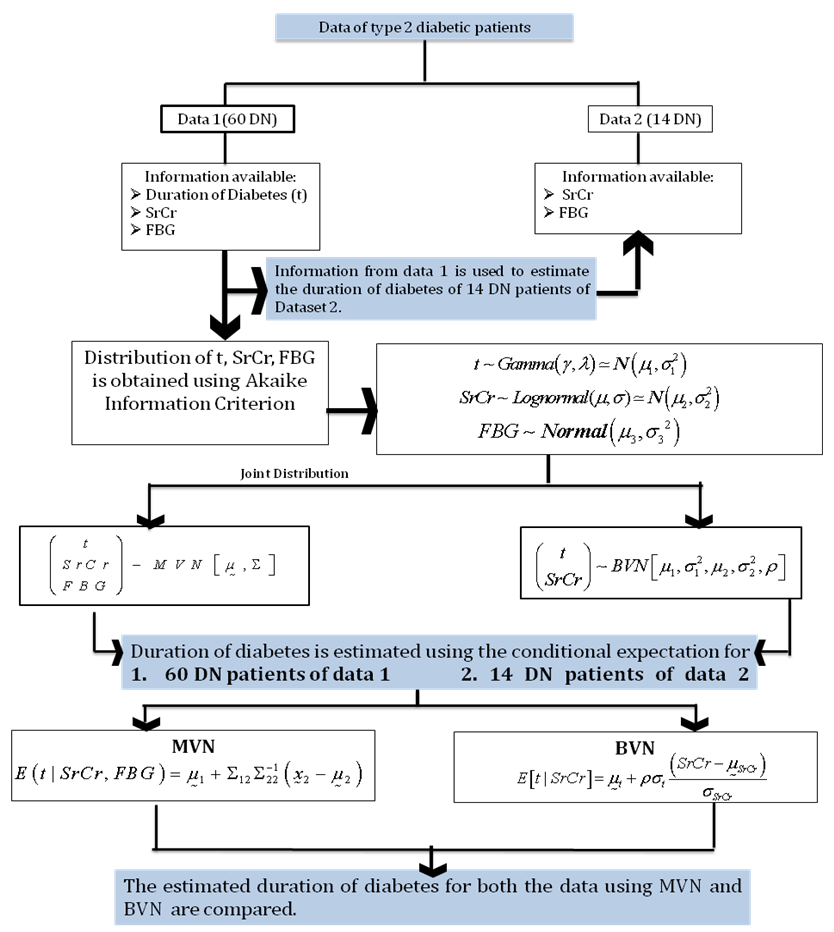 | Figure 1. Algorithm to estimate the duration of disease of type 2 diabetic nephropathy patients |
2. Methodology
2.1. Multivariate Normal (MVN) Distribution
- The random vector
 is said to have p-dimensional multivariate normal distribution with a mean vector
  and variance-covariance matrix
  if its joint probability density function is[14],
 | (1) |
2.1.1. Conditional Expectation under MVN Distribution
- Assume a p-dimensional random vector
 which can be partitioned as
  , has a multivariate normal distribution
  with mean vector
  and variance-covariance vector,
  , where
  and
and  are two sub-vectors of dimensions q and p-q of
  respectively. Define a transformation from
  to new variables
  and
and  . This is achieved by linear transformation,
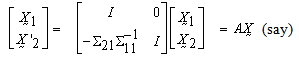 | (2) |
 is also MVN hence, the linear transformation shows that
  are jointly MVN distributed. Now, we can show
  and
and  are independent by proving that they are uncorrelated.
  Since,
  and
and  are MVN variables and uncorrelated they are independent. Thus,
 Now, as
  the conditional distribution of
  given
given  is,
is,  | (3) |
 [15].
[15].2.2. Bivariate Normal (BVN) Distribution
- The bivariate normal distribution is a special case of MVN with p=2 which can be defined for two related, normally distributed variables x and y with distributions
 and
and  respectively by the following probability density function[14]:
 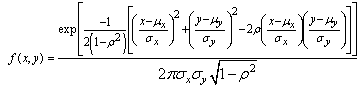 | (4) |
2.3. Normal Approximation to Gamma and Lognormal Distributions
- As the shape parameter in a Gamma distribution grows larger, the distribution becomes more like a normal distribution i.e. if X be a random variable following Gamma distribution with γ and λ as shape and scale parameters respectively and with probability density function (pdf) as
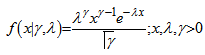 Then if the shape parameter γ is large as compared to λ then Gamma distribution tends to normal distribution i.e.,
  [16]. In case of lognormal distribution, if arithmetic mean m is much larger than its arithmetic standard deviation s, then the distribution tends to Normal (m, s2). A general rule of thumb for this approximation is m > 6s. If X is a random variable following lognormal distribution with µ and σ as location and scale parameters respectively and with pdf as,
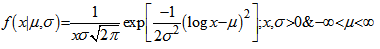 The mean and standard deviation can be defined as,
 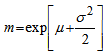 and,
and,  . Then, if
  ,
,  [17].
[17].2.4. Mardia Test for Multivariate Normality
- Often before doing any statistical modeling, it is crucial to verify if the data at hand satisfy the underlying distributional assumptions. For most multivariate analyses, it is thus very important that the data indeed follow the multivariate normal or if not exactly at least approximately. This assumption is often checked by individually examining the univariate normality through various P-P plots or some other plots and but this at times can be very subjective. One of the relatively simpler and mathematically tractable ways to find a support for the assumption of multivariate normality is by using the tests based on Mardia multivariate skewness and kurtosis measures. The sample measures of multivariate skewness and kurtosis are,

 where,
 Mardia (1970) has shown that for large samples the statistics,
  follows a
  distribution with p(p+1)(p+2)/6 degrees of freedom and
 follows a standard normal distribution. Thus, these two measures allow one to test two hypotheses that are compatible with the assumption of normality[10, 18].
3. Description of Data
3.1. Dataset 1
- For our study we have used two datasets. The first dataset is a retrospective data of 132 type 2 diabetic patients who were diagnosed of diabetes as per American Diabetes Association (ADA) standards, from the data base of Dr. Lal’s Path lab (a reputed NABL certified path lab). These patients were contacted through a house-to-house survey and up-to-date pathological reports were collected from the time of diagnosis of diabetes till the termination of study i.e November 2007. The data regarding the duration of diabetes and other factors like age at which diabetes was diagnosed; Fasting Blood Glucose (FBG), Diastolic Blood Pressure (DBP), Systolic Blood Pressure (SBP), Low Density Lipoprotein (LDL) and values of SrCr were recorded for each patient. Since, the study focus on renal complication arising out of type 2 diabetics only, it automatically excludes its effect on eyes, heart etc. We have also excluded the cases where renal complication had preceded the onset of diabetes. In our study, patients with same duration of diabetes have different renal health status. The renal health status of a patient is determined on the basis of SrCr, as the rate of rise in the value of SrCr is an important marker for prediction of DN. Thus using the values of SrCr the data has been classified into two categories namely DN (SrCr ≥ 1.4mg/dl) and non diabetic nephropathy (NDN) (SrCr < 1.4mg/dl) groups and it was found at the end of study that out of 132 patients there are only 60 (45.45%) DN cases and 72 (54.55%) NDN cases.
3.2. Dataset 2
- The second dataset consists of 200 type 2 diabetic patients who were again diagnosed as type 2 diabetic as per ADA standards. The pathological reports of these patents were collected from the database of Dr. Lal’s path lab from January 2012 to August 2013. As per the availability of information from the collected pathological report of 200 patients, the data regarding the factors FBG, Glycated hemoglobin (HbA1c), SrCr, Age, LDL were recorded for each patient. From the available reports of 200 patients minimum two reports of FBG and SrCr were available for each patient. But HbA1c and LDL were available for only 92 and 80 patients respectively. Out of 200 patients, only 14 patients were found to exceed the normal range of SrCr (i.e. greater than 1.4 mg/dl) and these were classified as DN patients according to ADA criteria. Also, complete report history of 19 months was available for these 14 patients.
4. Application
- Table 1 represents descriptive statistics of 132 type 2 diabetic patients giving minimum, maximum, range and mean ± S.D of the variables: age at diagnosis of diabetes, duration of diabetes, FBG, DBP, SBP, LDL and SrCr for two groups: DN and NDN group. Table 2 represents descriptive statistics of 200 type 2 diabetic patients giving minimum, maximum, range and mean ± S.D of the variables, FBG, HbA1c, LDL and SrCr.
4.1. Distribution Selection for Duration of Diabetes (t), SrCr and FBG
- AIC, a statistic that trades off model’s likelihood against its complexity is used to compare the viability of different parametric models. Gamma distribution has higher likelihood than the other models and minimum AIC value of 102.9820, indicating that this distribution is most accurate for the duration of diabetes of 60 DN patients. For SrCr the lognormal distribution is found to have the minimum AIC value of 26.2005. Thus, lognormal distribution with parameters µ = 0.8348 and σ= 0.1790 is found to be an appropriate distribution for SrCr. And for FBG, normal distribution has minimum AIC value of 213.9119, indicating that Normal distribution with parameters µ = 170.9643 and σ= 21.4293 is the most appropriate distribution. AIC values with the maximum likelihood estimates (MLE) are presented in table 3.
|

|

4.2. Multivariate Normal Distribution for Duration of Diabetes (t), Serum Creatinine (SrCr) and Fasting Blood Glucose (FBG)
4.2.1. Checking of Normal Approximation of Selected Distributions
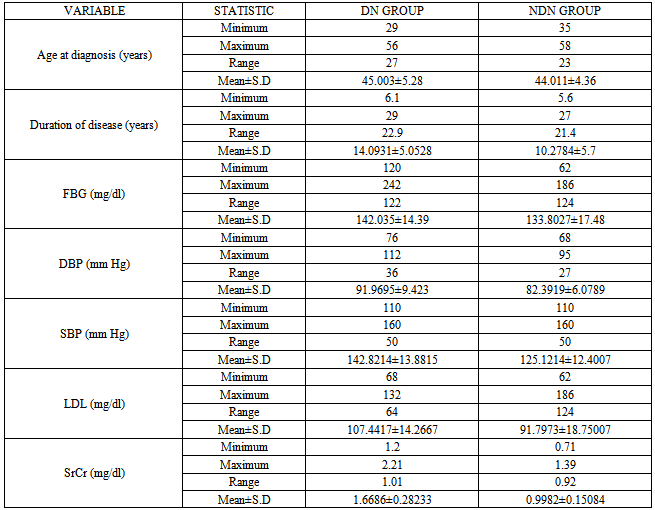
- The selected Gamma distribution of duration of diabetes (t) tends to normal distribution as its shape parameter is larger than its scale parameter. Hence applying the results from section 2.3 it can be concluded that t follows
 . The normal approximation for t is also judged by graph presented in figure 2. Figure support the claim that normal distribution is good approximation for duration of diabetes. The distribution of SrCr also tends to normal as in case of lognormal distribution the ratio of mean and standard deviation is large (> 6). Applying the results from section 2.3, we can say that
  . The same is depicted by graph presented in figure 3. Hence, all three random variables are marginally normally distributed as FBG was also found to be normally distributed with parameters µ = 170.9643 and σ= 21.4293.
 | Figure 2. Normal approximation for Gamma distribution |
 | Figure 3. Normal approximation for Lognormal distribution |
4.2.2. Checking Multivariate Normality of t, SrCr and FBG
- Next, we have checked multivariate normality of t, SrCr and FBG by applying Mardia test. The calculated chi-square (10 degrees of freedom) and standard normal test statistic came out to be
 and
and  (p-values >0.05) respectively, indicating that t, SrCr and FBG are jointly normally distributed. Now, since the variables: duration of diabetes, SrCr and FBG are marginally normally distributed with significant correlation coefficients (
 ; p-values < 0.0500) and are also jointly normally distributed. Therefore, MVN distribution is a suitable model for representing joint distribution of t, SrCr and FBG and is defined as,
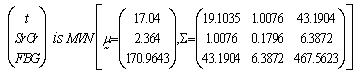 | (6) |
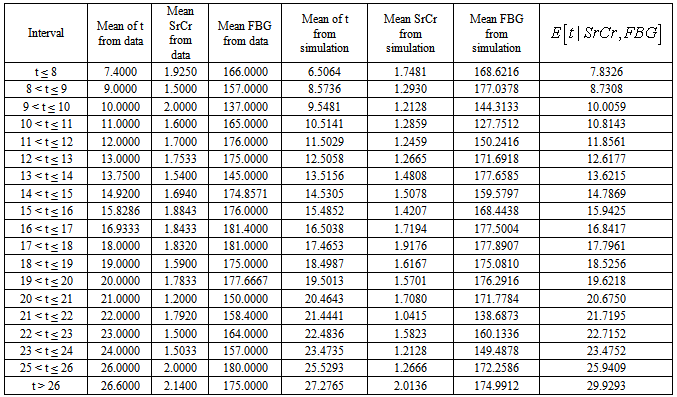
4.2.3. Estimation of Mean Duration of Diabetes for 60 DN Patients of Dataset 1 by Applying MVN Distribution
- The first dataset consists of 132 type 2 diabetic patients with 60 DN patients and the knowledge of duration of disease is known for each of these DN patients. The primary objective of our study is to estimate the duration of disease for these patients by applying MVN distribution. For this we have first generated a random sample of size 5000 from MVN distribution as defined in equation (6) and used same to estimate the duration of disease for time intervals defined as t ≤ 8, 8 < t ≤ 9,…., t > 26. The mean duration for each time intervals are estimated by applying the following equation:
 | (7) |
 represents the mean value of t calculated from the simulated data corresponding to a specific time interval,
  is observed value of SrCr and FBG from the data corresponding to a specific interval,
  is the mean value of SrCr and FBG,
  and
and  are calculated from the generated sample corresponding to a specific interval. The procedure of calculation for the first time interval t ≤ 8 is illustrated below:1. The mean duration of diabetes is calculated from the data of 60 DN patients for only those patients whose mean duration of diabetes is less than or equal to 8 years and is found to be 7.400 years. 2. The SrCr value for these patients range from 1.6500 to 2.2000 mg/dl with mean value 1.925 mg/dl (
 ) and FBG value for these patients range from 133 to 199 mg/dl with mean value 166 mg/dl (
 ).
).
|
- 3. Mean and standard deviation of t (
 ), SrCr (
 ), FBG (
 ) and covariance between t, SrCr and FBG (
 ) are calculated from the simulated sample corresponding to the ranges t ≤ 8, 1.6500 ≤ SrCr≤ 2.2000 and 133≤ FBG ≤ 199.4. Conditional expectation of
  is obtained by substituting the above values in equation (7). This gives the mean duration of diabetes for DN patients whose observed duration of disease is less than or equal to 8 years with their mean SrCr and FBG values known.Following the above procedure the mean durations for all time intervals are estimated and presented in table 4.
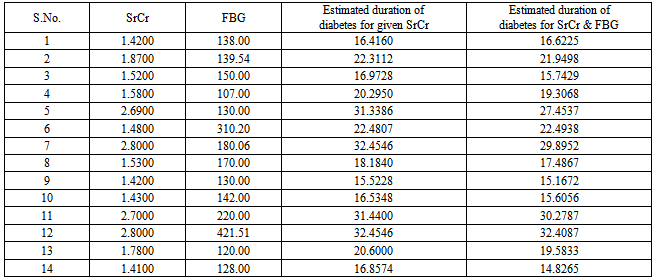
4.2.4. Estimation of Mean Duration of Diabetes for 14 DN Patients of Dataset 2 by Applying MVN Distribution
- The duration of disease for 14 DN patients of dataset 2 is estimated on the basis of known values of SrCr and FBG.The procedure of calculation for the first DN patient with given mean values of SrCr and FBG is as follows:1. The mean SrCr and FBG for the first patient is 1.42 mg/dl (
 ) and 138 mg/dl (
 ) respectively.2. Mean and standard deviation of t (
 ), SrCr (
 ) and FBG (
 ) and covariance between t, SrCr and FBG (
 ) are calculated from the simulated sample corresponding to the ranges 1.4000 ≤ SrCr≤ 1.4200 and 126≤ FBG≤ 138.3. Conditional expectation of
  is obtained by substituting the above values in equation (7). This gives the mean duration of disease for the first DN patient with known SrCr and FBG values.The mean durations of disease for 14 DN patients are calculated by applying the above procedure and are presented in table 6.
 4.3. Bivariate Normal Distribution for Duration of Diabetes (t) and Serum Creatinine (SrCr)
- In this section we have considered only two random variables viz. duration of diabetes and SrCr. As it was already known that the patients are diabetic and we are estimating the complication arising out of it (using SrCr only). As seen in section 4.2.1, the marginal distributions of these random variables are approximately normal and also they are jointly normally distributed (applied Mardia test:
 ; p-values >0.05). Thus, BVN distribution is a suitable model for representing joint distribution of t and SrCr and is defined as,
 | (8) |
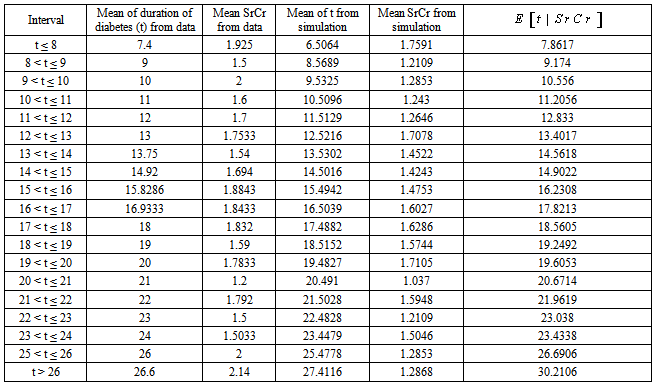
4.3.1. Estimation of Mean Duration of Diabetes for 60 DN Patients of Dataset 1 by Applying BVN Distribution
- Firstly we have estimated the duration of disease for 60 DN patients of dataset 1 by applying conditional expectation under BVN distribution. For this as done for MVN distribution, the data of duration of disease of 60 DN patients is divided into time intervals t ≤ 8, 8 < t ≤ 9,…., t > 26. And then a random sample of size 5000 is generated from BVN distribution with parameters as defined in equation (8), and mean duration of disease for each of these intervals are calculated by applying the following equation:
 | (9) |
 represents the mean and standard deviation values of t calculated from the simulated sample corresponding to a specific time interval,
  is observed value of SrCr from the data corresponding to a specific interval,
  are mean and standard deviation values of SrCr respectively, calculated from the generated sample corresponding to a specific interval. The procedure of calculation for the first time interval t ≤ 8 is illustrated below:1. The SrCr value for these patients range from 1.6500 to 2.2000 mg/dl with mean value 1.925 mg/dl (
 ).2. Mean and standard deviation of t (
 ) and SrCr (
 ) are calculated from the simulated data corresponding to the ranges t ≤ 8 and 1.6500 ≤ SrCr≤ 2.2000.3. Conditional expectation of
  is obtained by substituting the above values in equation (9). This gives the mean duration of diabetes for DN patients whose observed duration of disease is less than or equal to 8 years with their mean SrCr value known.The mean durations for all intervals are presented in table 5. The estimated durations of 60 DN patients obtained from MVN and BVN are compared graphically with the observed durations and are presented in figure 4.
4.3.2. Estimation of Mean Duration of Diabetes for 14 DN of Dataset 2 Patients by Applying BVN Distribution
- The duration of disease for 14 DN patients of dataset 2 is estimated on the basis of their known value of SrCr. Applying the similar steps as done for MVN case, the procedure of calculation for the first DN patient with given mean value of SrCr is as follows:1. The mean SrCr for the first patient is 1.42 mg/dl (
 ).2. Mean and standard deviation of t (
 ) and SrCr (
 ) are calculated from the simulated sample corresponding to the ranges 1.4000 ≤ SrCr≤ 1.4200.3. Conditional expectation of
  is obtained by substituting the above values in equation (9). This gives the mean duration of disease for the first DN patient with known SrCr value.The mean duration of disease for 14 DN patients is presented in table 6. These estimated durations of diabetes are further compared graphically with those estimated by applying MVN distribution and are presented in figure 5. The calculation and analysis are performed using SPSS for Windows, Version 15 and MATLAB, version 6.5 statistical packages.
|
|
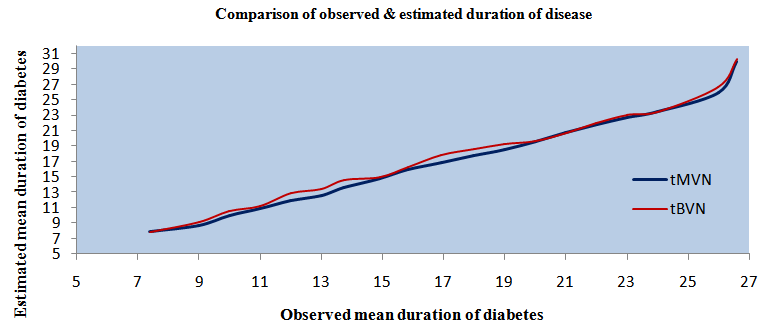 | Figure 4. Comparison of observed and estimated duration of diabetes for 60 DN patients of dataset 1 by applying BVN and MVN distributions |
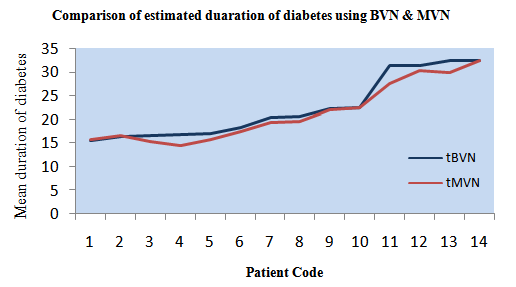 | Figure 5. Comparison of estimated duration of disease for 14 DN patients of dataset 2 by applying BVN and MVN distributions |
5. Conclusions
- This study provides a flexible and useful approach on the basis of MVN and BVN distributions for estimating the duration of disease when only some or latest information is known about the health status of a patient. The MVN distribution may be preferred over BVN distribution as more the information the better would be the estimates. The results of the study indicate that the proposed model can contribute meaningfully in dealing with other diabetic complications as well. This study also highlights the usage of simulation when datasets are small.
References
| [1] | Zhuo, L., Zou, G., Li, W., Lu, J., and Ren, W., 2013, Prevalence of diabetic nephropathy complicating non-diabetic renal disease among Chinese patients with type 2 diabetes mellitus, European Journal of Medical Research, 18(4),1-8. |
| [2] | Alwakeel, J.S., Isnani, A.C., Alsuwaida, A., AlHarbi, A., Shaikh, S.A., AlMohaya, S., and Ghonaim, M.A., 2011, Factors affecting the progression of diabetic nephropathy and its complications: A single-center experience in Saudi Arabia, Ann Saudi Med,31(3), 236-242. http://www.ncbi.nlm.nih.gov/pmc/articles/PMC3119962/ |
| [3] | Mogensen, C.E., 1999, Microalbuminuria, blood pressure, and diabetic renal disease: origin and development of ideas, Diabetologia, 42, 263-285. |
| [4] | The Diabetes Control and Complications Trial Research Group, 1993, The effect of intensive treatment of diabetes on the development and progression at long-term complications in insulin-dependent diabetes mellitus, NEJM., 29, 977-986. |
| [5] | United Kingdom Prospective Diabetes Study (UKPDS) Group, 1998, Intensive blood glucose control with sulphonylureas or insulin compared with conventional treatment and risk of complications in patients with type-2 diabetes (UKPDS 33). Lancet, 352:837-853[Erratum. Lancet. 1999;354:602]. |
| [6] | Mulec, H., Blohme, G., Grandi, B., and Bjorck, S., 1998, The effect of metabolic control on rate of decline in renal function in insulin- dependent diabetes mellitus with overt diabetic nephropathy. Nephrol Dial Tronspoant,13, 651-655. |
| [7] | Grover, G., Gadpayle, A.K., and Sabharwal, A., 2012, Identifying patients with diabetic nephropathy based on serum creatininein the presence of covariates in type-2 diabetes: A retrospective study, Biomed Res- India, 23 (4), 615-624. |
| [8] | Grover, G., Gadpayle, A.K., and Sabharwal, A., 2010, Identifying patients with diabetic nephropathy based on serum creatinine under zero truncated model, EJASA, 3(1), 28 – 43. |
| [9] | Multivariate analysis concepts, http://support.sas.com/publishing/pubcat/chaps/56903.pdf |
| [10] | Eye, A.V., and Bogat, G.A., 2004, Testing the assumption of multivariate normality. Psychology Science, 2, 243-258. http://www.pabst-publishers.de/psychology-science/2-2004/ps_2_2004_243-258.pdf. |
| [11] | Lipow, M., and Eidemiller, R.L., 1964, Application of the bivariate normal distribution to a stress vs strength problem in reliability analysis, Technometrics, 6(3), 325-328. http://www.jstor.org/stable/1266043. |
| [12] | Yue, S., 1999, Applying bivariate normal distribution to flood frequency analysis, Water International, 24(3), 248-254. http://dx.doi.org/10.1080/02508069908692168. |
| [13] | Bradburn, M.J., Clark, T.G., Love, S.B., Altman, D.G., 2003, Survival analysis part III: Multivariate data analysis-choosing a model and assessing its adequacy and fit, British Journal of Cancer, 89, 605-11, doi:10.1038/sj.bjc.6601120. |
| [14] | Johnson, N.L., and Kotz, S., Distributions in statistics: Continuous multivariate distributions, John Wiley & Sons, New York, 1972. |
| [15] | Multivariate normal distribution. http://www.maths.manchester.ac.uk/~mkt/MT3732%20(MVA)/Notes/MVA_Section3.pdf |
| [16] | http://www.johndcook.com/normal_approx_to_gamma.html. |
| [17] | http://www.vosesoftware.com/modelriskhelp/index.htm |
| [18] | Mardia KV. Measures of multivariate skewness and kurtosis with applications. Biometrika.1970;57:519-530. http://www.jstor.org/discover/10.2307/2334770?uid=3738256&uid=2&uid=4&sid=21102677097813. |