Hamed Tabesh, Zeynab Haghdust, Azadeh Saki
Department of Biostatistics and Epidemiology, School of Health, Ahvaz Jundishapur University of Medical Sciences, Ahvaz, Iran
Correspondence to: Azadeh Saki, Department of Biostatistics and Epidemiology, School of Health, Ahvaz Jundishapur University of Medical Sciences, Ahvaz, Iran.
| Email: |  |
Copyright © 2012 Scientific & Academic Publishing. All Rights Reserved.
Abstract
In many areas of medical research, a bivariate analysis is desirable because it simultaneously tests two correlated response variables. Several parametric bivariate procedures are available but each of them requires bivariate normality assumption for response variables. Although in recent years, continuous efforts have been made to test bivariate normality but it is not clear that which test is the most powerful in specified situation. The aim of this study is to compare power of eight different test of bivariate normality with at least one paper which marked them as a powerful test and dedicate the most powerful test in the specified situation. In this study, power of Mardia skewness, Mardia kurtosis, Henze-Zirkler, Mshapiro, Shapiro-wilk, Royston’s W, Doornik-Hansen and Szekely-Rizzo compared with each other using Monte Carlo simulation techniques. The power study shows that the most powerful test under bivariate distributions with different shapes is not the same. Using simulation studies, we show that “Mshapiro” test will perform much better under symmetric, skewed, medium tailed and heavy tailed distributions. Also, “Royston’s W” test will perform much better when underlying distribution is highly skewed.
Keywords:
Bivariate Analysis, Bivariate Normality Test, Power, Monte Carlo Simulation
Cite this paper: Hamed Tabesh, Zeynab Haghdust, Azadeh Saki, A Monte Carlo Simulation Study for Comparing Power of the Most Powerful and Regular Bivariate Normality Tests, International Journal of Statistics and Applications, Vol. 4 No. 1, 2014, pp. 40-45. doi: 10.5923/j.statistics.20140401.04.
1. Introduction
1.1. Preliminary
It is often the case that health science studies involve some correlated variables as response variables. For example in a clinical trial whose main purpose was to compare control and treatment group , treatment of chronic obstructive pulmonary diseases, lung function test can be used as the main response variable and peak expiratory flow rate, forced vital capacity and forced expiratory volume were considered as secondary response variables[1]. It is obvious that the correlation between these main and secondary response variables were great. Structure of most data according to different aspect such as underlying structure (intrinsic properties), environmental structure or laboratory structure is observable and usually they are corrected[2].So, for many health research studies and medical studies experiments involve two correlated response data as called bivariate response data. For such studies, a bivariate analysis that compares the treatment on two response variables simultaneously may have advantages over two separate univariate test, one for each variable[3].The great advantage of bivariate analysis is the possibility of increased power. If the response variables are not too highly correlated, the bivariate test has a chance of finding significant differences among the treatments even if none of the univariate tests is significant[4]. But many of the procedure required to analyze bivariate date, including Hotelling T2 , discriminant analysis and bivariate regression, assume bivariate normality (BVN). So its testing has great importance. Actually most of bivariate tests are based on bivariate normality assumption and perhaps this is a reason that make greater use of BVN tests in recent years[5].Despite the sensitivity of these bivariate techniques to BVN assumption, this assumption frequently does not tested. May be because of the lack of awareness of the existence of the test and the lack of information regarding size and power[6].This study focuses on the latter issue of size and power. Bivariate normality test may be restated as follows. Consider random bivariate sample  from continuous bivariate population e.g. weight and height of infants in a population.
 | (1) |
We examine via a Monte Carlo simulation the performance of some of the most common and powerful tests for hypothesis (1) in the literature.
1.2. Background
In recent years, continuous efforts have been made to test hypothesis (1) and numerous papers have been written on this topic. Some properties of these tests are "overall", "omnibus", "directed" or "graphical" but with increase in the number of BVN test conducting logical test seems to be difficult[7]. Most of the BVN tests are development of univariate normality tests. Thus, most of BVN tests are based on skewness and kurtosis or goodness of fit procedure[8]. Generally, BVN tests can be classified in to four groups but none of them are quite distinct[8]: Class 1: goodness of fit test, class 2: skewness and kurtosis approaches, class3: consistent and invariant test, class 4: graphical and correlational approach.In the first category, most of the comparative and review studies introduced Royston test which is an extension of the Shapiro-Wilk tests, as the best[6, 9]. Mardia skewness and Mardia kurtosis test as the examples of second group have been widely used, although some previous studies have reported them as low power tests. Doornik and Hansen test based on kurtosis can be another example of this category [10]. For the third category approach Epps and Pully in 1983 proposed and invariant test[11]. In the last category, Healy approach could be mentioned that draw BVN based on squared raddi[12].In many previous studies, researchers have compared power of few tests with their proposed tests and most of the available tests have not been compared with each other, so in this study we wish to calculate power of the most powerful and common recommended BVN tests in previous researches via simulation studies for different distributions (symmetric , skewed and highly skewed).
2. Methods
A total of 8 different tests of BVN, with at least one paper which marked them as powerful test, were studied in this investigation.
2.1. Tests for Bivariate Normality
In this section, for completeness a brief description of selected test statistics is presented. Suppose  represents a
  bivariate data matrix, where
  is the sample size.
2.1.1. Mardia Skewness
Mardia skewness test is given by where
where  And
And  is the inverse of the sample variance matrixes [13].
2.1.2. Mardia Kurtosis
Mardia kurtosis test is given by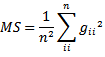 where
where 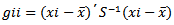 And
And  is the inverse of the sample variance matrix
  [13].
[13].
2.1.3. Henze-Zirkler
Henze-Zirkler test with test statistic: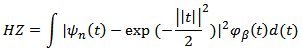 where
where  is an empirical characteristic function ,
  is a kernel function that was chosen to be
  and
and  is a smoothing parameter[14, 15].
2.1.4. Mshapiro
Mshapiro test is given by 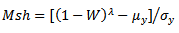 where
where and
and  with
with  being of the vector of expected value and the
  covariance matrix of standard normal order statistic, respectively[16, 17].
2.1.5. Shapiro –wilk Test
Shapiro –wilk test with test statistics: where
where  is Shapiro-Wilk´s univariate statistics for the
2.1.6. Royston’s W Test
Royston extended the Shapiro-Wilk univariate test to a bivariate (multivariate) case. The test statistic:  Where
Where  estimated by
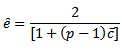 where
where  is an estimate for the average correlation among
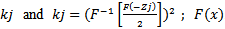 is the normal cumulative distribution function[9].
2.1.7. Doornik and Hansen Test
Doornik and Hansen’s omnibus test with test statistic: denote the transformed skewness and kurtosis, respectively [10].
2.1.8. Szekely and Rizzo Test
Szekely and Rizzo test is given by 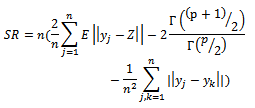 where
where
 standardized data matrix[19].
2.2. Simulation Study
All of the eight tests mentioned in the previous section compared with each other using samples from bivariate normal and non-normal distribution. Simulations were run for bivariate normal distribution with Also simulations were run for some non-normal distributions generated using the
  distribution [20], i.e. generating
  from a bivariate normal distribution and setting
 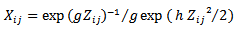 For
For  this expression is taken to be
 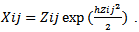 As the
  distribution provides a convenient method for considering a very wide range of situation corresponding to both symmetric and asymmetric distributions, it use is highly recommended. The case
  corresponds to a normal distribution, the case
  corresponds to a symmetric distribution, and as
  increases the skewness increases as well.For example, with
 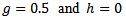 the skewness is 1.75, which is great[3]. In this study, simulations were run with
  to span the range of skewness values that seems to occur in practice. These different values of g,
  , stand for non-skewed, skewed and highly skewed distributions respectively.The parameter h determines the heaviness of the tail. As h increases, the heaviness increases as well. With
  and
and  the kurtosis equals 36. This might seem extreme [3], so our simulation were run for
 As the power of tests dependent on sample size, so our simulations were run for
 The monte carlo study was employed, where 5000 samples were generated for each combination of
3. Results and Discussion
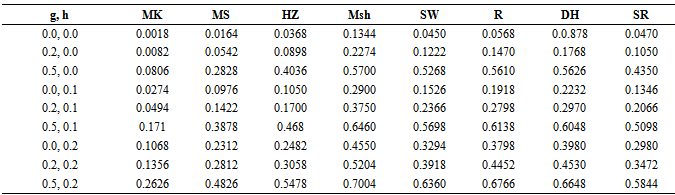
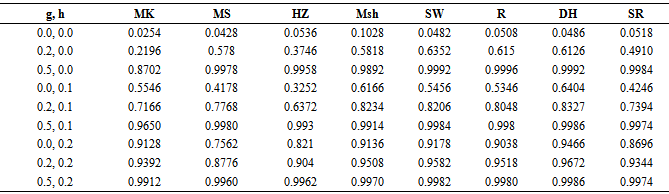
Table 1. Monte carlo rejection proportion for the bivariate population (ρ =0, n=15)
 |
| |
|
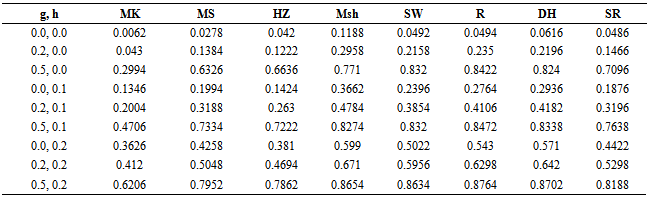
Table 2. Monte carlo rejection proportion for the bivariate population (ρ =0, n=25)
 |
| |
|
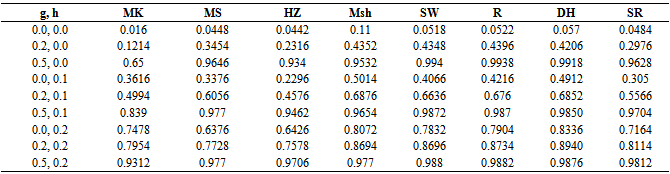
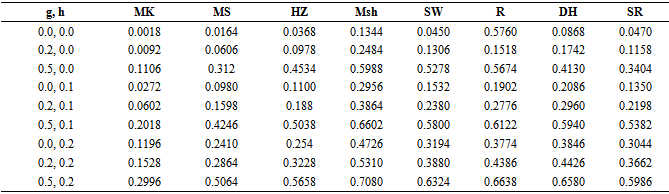
Table 3. Monte carlo rejection proportion for the bivariate population (ρ =0, n=50)
 |
| |
|
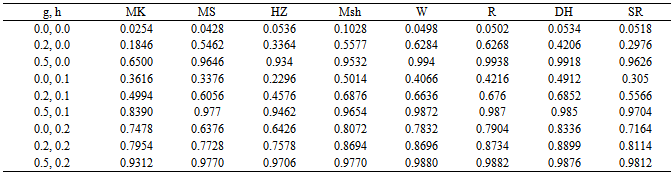
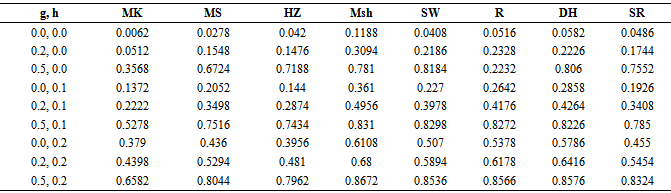
Table 4. Monte carlo rejection proportion for the bivariate population (ρ =0, n=75)
 |
| |
|
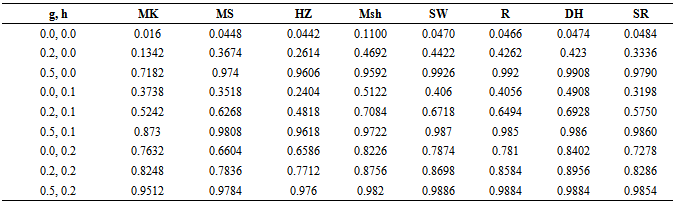
Table 5. Monte carlo rejection proportion for the bivariate population (ρ =0.5, n=15)
 |
| |
|
The results in Table 1, Table 2, Table 3 and Table 4 were based on 5000 samples of sizes 15, 25, 50, 75 respectively, from a bivariate population with uncorrelated variables.The result in Table 5, Table 6, Table 7 and Table 8 were based on similar conditions from a bivariate population with  for two considered variables also the results in Table 9, Table 10, Table 11 and Table 12 were for two considered variables with
  A nominal significance level of 0.05 wasused. ”mvnormtest”, ”mvshapiroTest”, ”MVN”, “normwhn.test” and "energy” Library in R program version 2.15.3 were used .Under the bivariate distribution with uncorrelated variables and
 the simulation results showed that "Msh" test statistic performed better than any of the test statistics compared here for almost all distributions (symmetric, skewed and heavy or light tailed). It followed by "R" and "DH”. The findings of this study show that "Msh" test had greater power than others for symmetric, skewed and heavy tailed uncorrelated, bivariate distributions but not for highly skewed when sample size is medium
 For highly skewed uncorrelated bivariate distributions when sample size is medium it seems that "R" is the best and "SW" and "DH" are the second and the third.But for large
 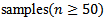 under similar condition approximately power of "Msh”,"R”, and "DH" are similar and better than others.The simulation results under bivariate distribution with
  were closely similar. In general simulation performed for bivariate distributions with different correlations showed similar power trends.
Table 6. Monte carlo rejection proportion for the bivariate population (ρ =0.5, n=25)
 |
| |
|
Table 7. Monte carlo rejection proportion for the bivariate population (ρ =0.5, n=50)
 |
| |
|
Table 8. Monte carlo rejection proportionfor the bivariate population (ρ =0.5, n=75)
 |
| |
|
4. Conclusions
In health and medical researches , were two variables such as cholesterol level and blood pressure are considered for important diagnoses, the bivariate values may be related in an unknown way[21], so bivariate analysis is considered. An important topic for applying most of the bivariate analysis, BVN assumption, is necessary. So make a decision about BVN considered an important problem. According to number of BVN available test, we have compared them under various bivariate distributions with different correlations and different sample sizes.The results of the simulation studies showed that the Mshapiro test performed better than most of its competitors whether the underlying distribution was normal, or non-normal, skewed or symmetric or heavy tailed, but not for highly skewed also it makes type I error inflated. It means that we could not conclude that Mshapiro is the best overall but we could say Mshapiro is the best under specific conditions. The simulation results also revealed that similar power could be considered for "SW”, "R", "DH" whether the underlying distribution was highly skewed and they had greater power than other competitors. Therefore, Mshapiro’s application where underlying distribution is not highly skewed recommended , since it is more powerful than any of alternatives compared here for almost all sample sizes and Royston’s application recommended where Mshapiro is not the best.
ACKNOWLEDGEMENTS
This work was financially supported by vice-chancellor for Research Affairs of Ahvaz Jundishapur University of Medical Sciences. This study is part of biostatistics MS degree thesis of Zaynab Haghdust.
References
| [1] | Pocock, S.J., Clinical trials: a practical approach. NY: Wiley, 1983. |
| [2] | Gnanadesikan, R., Methods for statistical data analysis of multivariate observations. 2011: Wiley-Interscience. |
| [3] | Tabesh, H., S. Ayatollahi, and M. Towhidi, A simple powerful bivariate test for two sample location problem. Theoretical Biology and Medical Modeling, 2010,7:13. |
| [4] | Fleiss, J.L., The design and analysis of clinical experiments, 1986, Taylor & Francis. |
| [5] | Bogdan, M., Data driven smooth tests for bivariate normality. Journal of Multivariate Analysis, 1999. 68(1): p. 26-53. |
| [6] | Farrell, P.J., M. Salibian-Barrera, and K. Naczk, On tests for multivariate normality and associated simulation studies. Journal of Statistical Computation and Simulation, 2007. 77(12): p. 1065-1080. |
| [7] | Henze, N., Invariant tests for multivariate normality: a critical review. Statistical papers, 2002. 43(4): p. 467-506. |
| [8] | Mecklin, C.J. and D.J. Mundfrom, A Monte Carlo comparison of the Type I and Type II error rates of tests of multivariate normality. Journal of Statistical Computation and Simulation, 2005. 7:(2)5 p. 93-107. |
| [9] | Royston, J., Some techniques for assessing multivarate normality based on the shapiro-wilk W. Applied Statistics, 1983: p. 121-133. |
| [10] | Doornik, J.A. and H. Hansen, An Omnibus Test for Univariate and Multivariate Normality*. Oxford Bulletin of Economics and Statistics, 2008. 70(s1): p. 927-939. |
| [11] | Epps, T.W. and L.B. Pulley, A test for normality based on the empirical characteristic function. Biometrika, 1983. 70(3): p. 723-726. |
| [12] | Healy, M., Multivariate normal plotting. Applied Statistics, 1968: p. 157-161. |
| [13] | Mardia, K.V., Measures of multivariate skewness and kurtosis with applications. Biometrika, 1970. 57(3): p. 519-530. |
| [14] | Henze, N. and B. Zirkler, A class of invariant consistent tests for multivariate normality. Communications in Statistics-Theory and Methods, 1990. 19(10): p. 3595-3617. |
| [15] | Henze, N. and T. Wagner, A new approach to the BHEP tests for multivariate normality. Journal of Multivariate Analysis, 1997. 62(1): p. 1-23. |
| [16] | Royston, J., An extension of Shapiro and Wilk's W test for normality to large samples. Applied Statistics, 1982: p. 115-124. |
| [17] | Royston, J., Algorithm AS 181: The W test for normality. Journal of the Royal Statistical Society. Series C (Applied Statistics), 1982. 31(2): p. 176-180. |
| [18] | Villasenor Alva, J.A. and E.G. Estrada, A generalization of Shapiro–Wilk's test for multivariate normality. Communications in Statistics-Theory and Methods, 2009. 38(11): p. 1870-1883. |
| [19] | Székely, G.J. and M.L. Rizzo, A new test for multivariate normality. Journal of Multivariate Analysis, 2005. 93(1): p. 58-80. |
| [20] | Hoaglin, D.C., Summarizing Shape Numerically: The g‐and‐h Distributions. Exploring data tables, trends, and shapes, 1985: p. 461-513. |
| [21] | Rawlings, J.O., S.G. Pantula, and D.A. Dickey, Applied regression analysis: a research tool. 1998: Springer. |
 Abstract
 Reference
 Full-Text PDF
 Full-text HTML