-
Paper Information
- Previous Paper
- Paper Submission
-
Journal Information
- About This Journal
- Editorial Board
- Current Issue
- Archive
- Author Guidelines
- Contact Us
International Journal of Statistics and Applications
p-ISSN: 2168-5193 e-ISSN: 2168-5215
2013; 3(4): 132-140
doi:10.5923/j.statistics.20130304.06
Spatial Modeling of Hypertension Disease in the Kumasi Metropolitan Area of Ghana
 Abstract
 Reference
 Full-Text PDF
 Full-text HTML
Ebenezer Owusu-Sekyere1, Bonyah Ebenezer2, Ossei Linda3
1Department of Development Studies, University for Development Studies WA, Ghana
2Department of Mathematics and Statistics, Kumasi Polytechnic, Ghana
3Department of Mathematics, Kwame Nkrumah University of Science and Technology, Kumasi, Ghana
Correspondence to: Bonyah Ebenezer, Department of Mathematics and Statistics, Kumasi Polytechnic, Ghana.
| Email: |  |
Copyright © 2012 Scientific & Academic Publishing. All Rights Reserved.
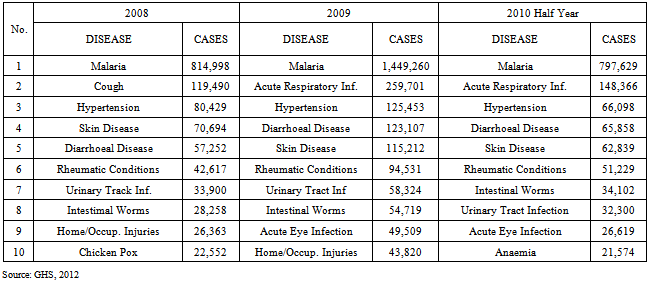
Hypertension is a major health burden worldwide. In Ghana, the Health Service reports that since 2008, hypertension continuous to be the third most common cause of morbidity and mortality in the Ashanti region with the Kumasi Metropolitan Area leading the pack of endemic areas. The aim of this paper was to examine the spatial distribution of the disease in the Kumasi Metropolitan Area using patients’ medical records. Using both quantitative and qualitative approaches, the research revealed that the disease was more profound in low-income suburbs of the metropolis than the high income communities. Again, the research further revealed that prevalence was high among females than males. Lastly, the high incidence of Hypertension was due to sedentary life style due mainly to the higher rate of urbanization. The research concludes that Hypertension is gradually emerging as a leading cause of death in the metropolis and therefore more efforts and resources should be made available to help manage the disease situation.
Keywords: Hypertension, Kriging, Incidence Rate, Metropolis, Blood Pressure
Cite this paper: Ebenezer Owusu-Sekyere, Bonyah Ebenezer, Ossei Linda, Spatial Modeling of Hypertension Disease in the Kumasi Metropolitan Area of Ghana, International Journal of Statistics and Applications, Vol. 3 No. 4, 2013, pp. 132-140. doi: 10.5923/j.statistics.20130304.06.
Article Outline
1. Introduction
- Hypertension, also referred to as high blood pressure, is a condition in which the arteries have persistent elevated blood pressure[4]. Blood pressure is the force of blood pushing up against the blood vessel walls. The higher the pressure, the harder the heart has to pump. The normal level for blood pressure is below 120/80, where 120 represent the systolic measurement (peak pressure in the arteries) and 80 represents the diastolic measurement (minimum pressure in the arteries). Blood pressure between 120/80 and 139/89 is called pre-hypertension (to denote increased risk of hypertension), and a blood pressure of 140/90 or above is considered hypertension[23]. Though the exact causes of hypertension are usually unknown, there are several factors that have been highly associated with the condition. They include: smoking, obesity, diabetes, sedentary lifestyle, lack of physical activity and high levels of salt intake. Extremely high blood pressure may lead to some symptoms such as severe headaches, fatigue or confusion, dizziness, nausea, problems with vision, chest pains, breathing problems, irregular heartbeat and blood in the urine[17]. As of the beginning the year 2000, more than a quarter of the world’s adult population (nearly one billion) had hypertension, and this is projected to increase by almost 40% in 2025[10]. The high cases and prevalence makes hypertension the single most important cause of morbidity and mortality in the world[18]. A study by Fuentes et al indicated that in the lower and middle- income countries, there seems to be a sharp increase in the prevalence rate of hypertension[8]. Again, the World Health Organization reports that in the Sub-Saharan Africa (SSA) there is a high prevalence of hypertension[21], although the awareness and treatment in African setting is still very low[2]. Hypertension is the number three killer in Ghana today. The prevalence rate of high blood pressure is estimated at 30-40% (MOH, 2010). Knowing the pattern of this detrimental disease could help public health workers and government to organize educative programs for citizens on causes of hypertension and its associated problems. Similar studies by[1] on the changing patterns of hypertension in four rural communities in Ghana observed prevalence of 25.4%. Statistics from the Korle Bu Teaching Hospital indicate that almost 70 percent of all deaths at the hospital are caused by hypertensive conditions. The report further states that the disease affects nearly one out of every five Ghanaian adults. A recent report by the Ghana Health Service says more people are becoming hypertensive due to unhealthy lifestyles.. The disease silently damages the brain, the heart, the kidneys and the eyes. Commonly referred to as high blood pressure or BP, hypertension is the major cause of strokes, heart attacks, heart failure and chronic renal failure. These and other blood pressure related diseases constitute more than half of all admission cases at Korle Bu Teaching Hospital[15].
|
|
2. Methods
2.1. Study Area
- Kumasi is located in the transitional forest zone and is about 270km north of the national capital, Accra. It is between latitude 6.35o – 6.40o and longitude 1.30o – 1.35o. The unique centrality of the city as a traversing point from all parts of the country makes it a special place for many to migrate to. Kumasi is the second populous metropolitan area in Ghana after the capital, Accra. Over 2,022,919 people are estimated to live in the metropolitan area with a growth rate of 5.4 per cent annually[13]. The high population growth has serious consequences on health care delivery because it is not accompanied by improvement and increase in health oriented infrastructure and service provision. The Metropolitan Health Service is organized around five (5) Sub Metro Health Teams; namely, Bantama, Asokwa, Manhyia North, Manhyia South and Subin. The city has a number of health facilities in both the public and private sectors. Notable among them are the KomfoAnokye Teaching Hospital (KATH), which is one of the two (2) national autonomous hospitals, four (4) quasi health institutions, five (5) health Care Centres owned by the Church of Christ and the Seventh-Day Adventist Church. In addition, there are over two hundred (200) known private health institutions and 13 Industrial Clinics in the metropolis. There are also 54 trained Traditional Birth Attendants (TBAs), nine (9) Maternal and Child Health (MCH) points and 119-outreach sites. These facilities are evenly distributed in space. The number of infants who die per 1,000 live births each year continues to grow. It increased from 21 in 2003 to 29 in 2004 and 36 in 2005 representing an increase in percentage of 27.6 and 19.4 respectively. The implication for development is that the population will not be replacing itself and the result will be an ageing population with a low human resource base. It will also impinge on productivity and the overall development of the metropolis. The common diseases in the Metropolis include; malaria, diarrhea, hypertension, diabetes mellitus, Septic abortion and road traffic accident. The population hospital ratio is 1:48,276[9].
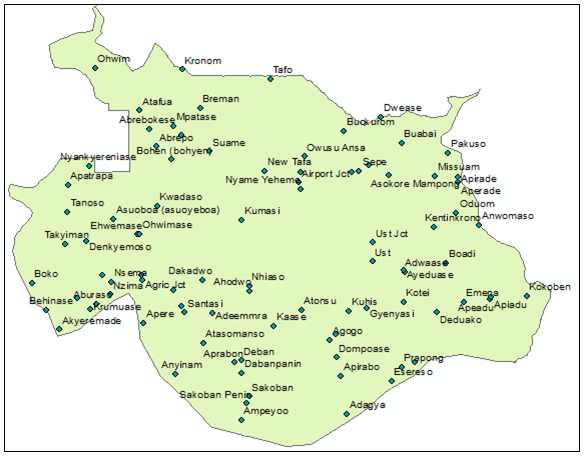 | Figure 1. Map of the Study Area |
2.2. Data Sources
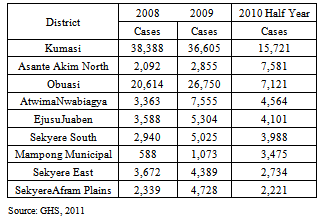
- Data for the study was obtained from the Disease Control Units (DCU) of the Ghana Health Service in the Ashanti Region. The confirmed cases of hypertension disease as of the time of the study were 15,721made up of 6856 for males and 8865 for females. The data classification on the basis of sex was to find out the incidence rates between the two sex groups at the varioussuburbs in the metropolis.Population data obtained from Ghana Statistical Service was used in computing the raw rates of hypertension disease. Raw rates were calculated as the number of hypertension cases in each suburb divided by the estimated Population in 2010. In order to make better appreciation of the risk of the disease; the raw rates were rescaled by multiplying it by a factor of 1000. This expresses the raw rates as per 1000 people.
2.3. Spatial and Non-Spatial Data Input
- The basic data inputs were geographic location of the study area where hypertension cases of patients have been reported and topographic map of the metropolis which was drawn at a scale of 1:25000. This map which was obtained from the planning department of Kumasi metropolitan assembly was geo-referenced and digitized in ArcGIS 10.0 version where coordinates per settlement were extracted. Reported cases of hypertension obtained from the regional disease control unit were entered as attributes of the point features (i.e. the settlement) in the software. The application softwares used for this research were ArcGIS 10.0 version and SpaceStat 3.6.1 developed by BioMedware USA.
2.4. Geostatistical Analysis of High Blood Pressure Rates
- For a given number N=84of settlements, let the number of recorded hypertension cases be
 and the size of the population at risk also be
  , where
  is the size of the risk entities at
  .Following Oliver et al., (1998), towns are referenced geographically by their centroids with the vector of spatial coordinates
  , which leads to the actual spatial support (i.e. size and shape of the towns) is not taken into account in the analysis. The empirical incidence rates of Hypertension disease written as :
 | (1) |
 and can be expressed as the realization of a random variables
  that follows a Poisson distribution with one parameter (expected of number of count of hypertension disease). This implies the product of the population size
  multiplied by the local risk
  :
: | (2) |
 is modelled as a stationary random field with mean m, variance
  and covariance function
  .The conditional mean and variance of the rate variable
  are expressed as:
 | (3) |
 | (4) |
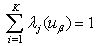
 is estimated as the following linear combination of K neighbouring observed rates:
 | (5) |
 are determined in order to minimize the mean square error of prediction under the constraint that the estimator is unbiased. These weights are the solution of the following system of linear equations, Poisson Kriging system:
 | (6) |

 if
if and 0 otherwise
  is the population-weighted mean of the rates. The term
  is a Lagrange parameter that is achieved from the minimization of the estimation variance subject to the unbiased constraint on the estimator. The addition of the term,
  , for a zero distance deal with variability obtain from population size, leading to smaller weights for less reliable data. This term exactly stand for the difference between the variance of the risk and rate variables. We applied kriging to filter the noise from the observed rates aggregated to the settlement level, but not to estimate the risk within the settlement itself. The prediction variance based on Poisson kriging is computed using the traditional formula for the ordinary kriging variance:
 | (7) |
 or equivalently its semivariogram
 . The semivariogram of the risk is estimated as[14]:
 | (8) |
 is the number of pairs of communities separated by vector
  . The different spatial increments
  are weighted by a function of their respective population sizes,
  , a term which is inversely proportional to their standard deviation. We gave preference to pair data with small standard deviations. A permissible model
  is then fitted to the experimental variogram so that we obtain the variogram, covariance value. In this work, we modeled using the weighted least-square regression procedure implemented in the SpaceStat 3.5.6 version software developed by BioMedware USA. Weighting scheme is employed to the least-square in fitting of a variogram model to experimental values. This is to ensure that the selected model is the one that minimizes the weighted sum of squares of differences between the experimental and model curves. The L which is the number of classes of distance is expressed as.
 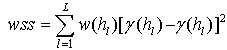 | (9) |
3. Results and Discussions
- Figure 2 shows the omni-directional variogram of Hypertension disease for females and males. The figure also shows the risk computed from district-level rates using estimator (7). The experimental variogram was fitted using a spherical model with a range of 1.6 km for females. This means that given a radius of 1.6km, one could find all the attributable factors leading to the high rate of the disease which may include a higher concentration of fast foods joint among others. For that of males the Cubic model had a range of 1.1 km and a similar spatial distribution in the metropolis. The solid curve denotes the anisotropic (i.e.direction-dependent) model fitted using weighted least-square regression.
|
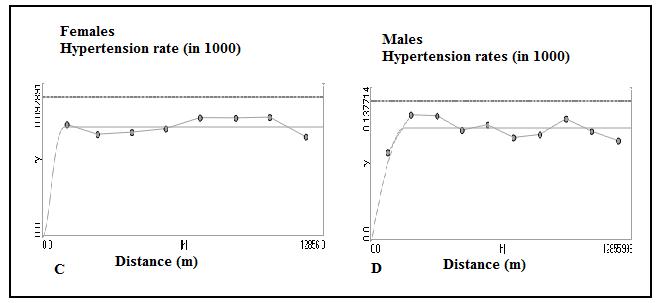 | Figure 2. Directional variograms for Females and Males hypertension mortality rates and risks with the model fitted |
 | Figure 3. Omni-directional variograms for Females and Males hypertension mortality rates and risks with the model fitted |
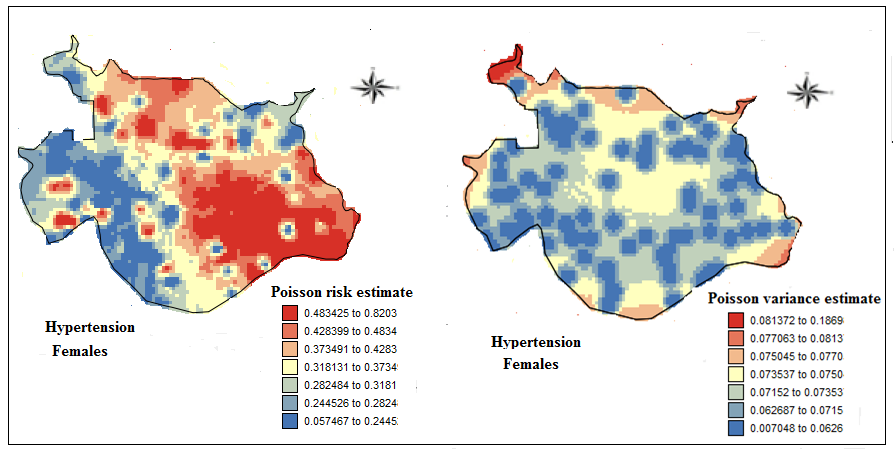 | Figure 4. Maps of Females hypertension mortality risks estimated by Poisson kriging and the corresponding kriging variance |
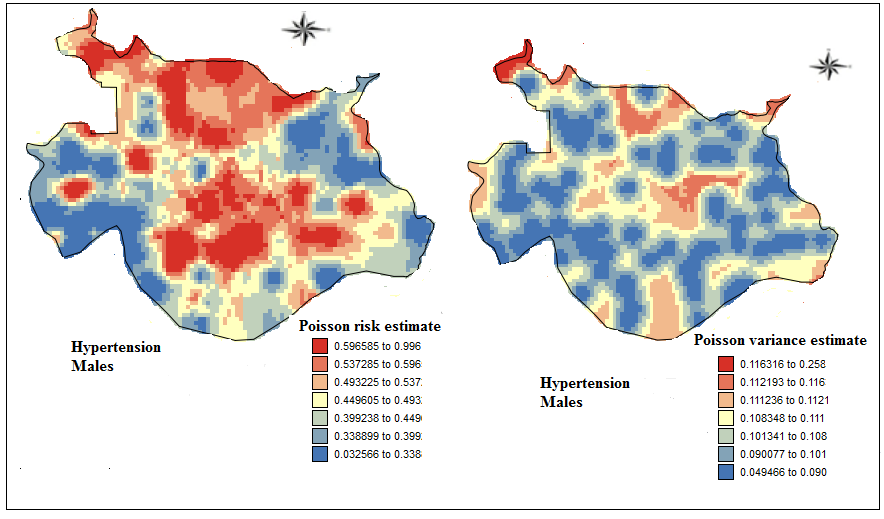 | Figure 5. Maps of Males hypertension mortality risks estimated by Poisson kriging and the corresponding kriging variance |
4. Conclusions
- This study has shown that hypertension exists in substantial rates in low-income communities of the KMA. The research further revealed that the incidence of HP was higher for females than for males. This female domination inhypertension is seen more often in densely populated low-income communities in the metropolis. There was however, a marked difference in the geographical distribution of the disease between both sexes. The research shows that there was higher incidence of Hypertension risk among females in the southeast portion of the Kumasi metropolis than the other areas. Conversely, the geographical spread of Hypertension for males was concentrated in both central and northern part of the metropolis. Despite the sexual dichotomy in the spatial spread of the disease, what has been established for a fact is that HP is on the increase and therefore urgent steps need to be taken to reduce the current incidence rate. The research has again shown that changing life style due to rapid urbanization and the struggle for livelihood activities is a strong determinant responsible for the high incidence of the disease in the metropolis. This research recommends that since many more people have the disease without knowing their status public education should be intensified so that residents freely and voluntarily avail themselves for regular check up. Again people should be encouraged to exercise regularly. Finally, alcoholism, smoking and sedentary life style should be reduced to lowest level.
References
| [1] | Addo, J., Smeeth, L., Leon, D.A., (2007). Hypertension in Sub-saharan Africa: A Systematic Review. Hypertension. Dec, 50(6), pp.1012-8. |
| [2] | Agyemang, C., Bruijnzeels, M.A., Owusu-Dabo, E., (2006). Factors Associated withHypertension Awareness, Treatment, and Control in Ghana, West Africa. Journalof Human Hypertension. Jan, 20(1), pp. 67-71. |
| [3] | Amoah A. G. B. (2003). Hypertension in Ghana: A cross-sectional community prevalence studyin Greater Accra. Journal of Ethnicity and Diseases. 13: 310-315 |
| [4] | Black (2003). Seventh Report of the Joint National Committee on Prevention, Detection, Evaluation and Treatment of High Blood Pressure. Hypertension 42 (6): 1206-52 |
| [5] | Brent A. Burket (2006). Blood pressure survey in two communities in the Volta Region, Ghana, West Africa. Journal of Ethnicity and Diseases. 16: 292-294 |
| [6] | Bovet, P. (2002). Distribution of blood pressure, body mass index and smoking habits inthe urban population of Dar es Salaam, Tanzania, and associations with Socioeconomic Status. International Journal of Epidemiology,Feb, 31(1), pp.240-7 |
| [7] | Cappuccio F. P., Micah F. B., Emmett L., et al. (2004). Prevalence, detection, management and Control of Hypertension in Ashanti, West Africa. Journal of Hypertension. 43: 1017-1021 Juliet Addo, Albert G. B. Amoah, Kwadwo |
| [8] | Fuentes, R., Ilmaniemi, N., Laurikainen, E., Tuomilehto, J., Nissinen, A., (2000). Hypertensionin Developing Economies: A Review of Population-based Studies Carried out from 1980 to 1998. Journal of Hypertension. May, 18(5), pp. 521-9. |
| [9] | Ghana Health Service (GHS) (2012). Strategic Objectives and New Paradigm of the Ministry of Health. Ashanti Regional Health Directorate in 2012 |
| [10] | Kearney P. M., Whelton M., Raynolds K., et al. (2005). Global burden of hypertension analysisof world data. Lancet. 365: 217-223 |
| [11] | KomfoAnokye Teaching Hospital (KATH) (2012). Healthy Lifestyle and Healthy Environment.Annual report. |
| [12] | Koram. A (2006). The Changing Patterns of Hypertension in Ghana: A Study of Four Rural Communities in the GA District. Journal of Ethnicity and Diseases. 16: 894-898. |
| [13] | Kumasi Metropolitan Assembly (KMA) (2006). Metropolitan Medium Term Development Plan, Kumasi Metropolitan Authority. Kumasi |
| [14] | Monestiez P., Dubroca L., Bonnin E., Durbec J.P., and Guinet C. (2006). GeostatisticalModelling of Spatial Distribution of Balenopteraphysalus in the Northwestern Mediterranean Sea fromSparse Count Data and Heterogeneous Observation Efforts, Ecological Modelling, vol. 193,no. 3-4, p. 615-628. |
| [15] | MOH (Ministry of Health), (2011) “ Public Health Division” Annual Report. |
| [16] | Oliver, M.A., Webster, R., Lajaunie, C., Muir, K.R.,(1998). Binomial cokriging for estimatingand mapping the risk of childhood cancer, IMA J Math App in Med and Bio, 15: 279 -297. |
| [17] | Pereira, M., Lunet, N., Azevedo, A., Barros, H., (2009). Differences in Prevalence, Awareness,Treatment and Control of Hypertension between Developing and Developed Countries. Journalof Hypertension.May, 27(5), pp. 963-75. |
| [18] | Rodgers, A., Ezzati, M., Vander Hoorn, S., Lopez, A.D., Lin, R.B., Murray, C.J.,Comparative Risk Assessment Collaborating Group, 2004. Distribution of MajorHealth Risks: Findings from the Global Burden of Disease study. PLoS Medicine. Oct, 1(1), pp. 27 |
| [19] | Walker, R.W., McLarty , D.G., Kitange, H.M. (2000). Stroke mortality in urban and ruralTanzania.Adult Morbidity and Mortality Project. Lancet. May 13, 355(9216), pp.1684-7. |
| [20] | WHO/ISH Writing Group, (2003). World Health Organization/International Society of Hypertension (ISH) statement on management ofhypertension.http://www.who.int/cardiovascular_diseases/guidelines/hypertension_guidelines.pdf[Accessed on 10 October 2009] |
| [21] | World Health Organization, (2005). Cardiovascular Diseases in the African Region: CurrentSituation and Perspectives. |
| [22] | World Health Organization (2003). Global Strategy on Diet, Physical Activity and Health: African Regional Consultation Meeting Report. Harare, Zimbabwe 2003. pp12. |
| [23] | World Health Organization, 2002. The World Health Report 2002. |
| [24] | Zuleat M. O. (2007). The incidence of hypertension among adults in the Niger Delta Region of Nigeria. South East Asian Journal of Tropical Medicine and Public Health. 38(5):947-948. |