-
Paper Information
- Next Paper
- Previous Paper
- Paper Submission
-
Journal Information
- About This Journal
- Editorial Board
- Current Issue
- Archive
- Author Guidelines
- Contact Us
International Journal of Statistics and Applications
p-ISSN: 2168-5193 e-ISSN: 2168-5215
2013; 3(4): 113-122
doi:10.5923/j.statistics.20130304.04
Estimation of Survival of Liver Cirrhosis Patients, in the Presence of Prognostic Factors Using Accelerated Failure Time Model as an Alternative to Proportional Hazard Model
 Abstract
 Reference
 Full-Text PDF
 Full-text HTML
Gurprit Grover1, V Sreenivas2, Sudeep Khanna3, Divya Seth1
1Department of Statistics, University of Delhi, Delhi, 110007, India
2Department of Biostatistics, All India Institute of Medical Sciences, Delhi, 110029, India
3Department of Gastroentrology, Pushpawati Singhania Research Institute, Delhi, 110017, India
Correspondence to: Divya Seth, Department of Statistics, University of Delhi, Delhi, 110007, India.
| Email: |  |
Copyright © 2012 Scientific & Academic Publishing. All Rights Reserved.
Accelerated Failure Time Model (AFTM) encompasses a wider range of survival time distributions as compared to Cox proportional hazard (PH) model. This article illustrates the use of accelerated failure time model as an alternative to the proportional hazard model in the analysis of time to event data. This kind of study is being done for the first time on Indian population wherein a retrospective data of 666 admitted patients suffering from liver cirrhosis has been obtained and analyzed by both Cox PH and AFT models to evaluate the effect of covariates on the survival of these patients. Model selection criteria include minimization of AIC and graphs showing approximation of cumulative Cox-Snell residuals to (-log) Kaplan-Meier estimates to select the best model. It was conclusively established through the selected model that patients with higher level of serum creatinine and presence of altered sensorium are the significant factors affecting the survival of these patients. In multivariate analysis, all AFT models were judged to be better than Cox regression; Log logistic AFT model was found to be the best fit among candidate models.
Keywords: AFT, Cox PH Model, AIC, Cox-Snell Residual
Cite this paper: Gurprit Grover, V Sreenivas, Sudeep Khanna, Divya Seth, Estimation of Survival of Liver Cirrhosis Patients, in the Presence of Prognostic Factors Using Accelerated Failure Time Model as an Alternative to Proportional Hazard Model, International Journal of Statistics and Applications, Vol. 3 No. 4, 2013, pp. 113-122. doi: 10.5923/j.statistics.20130304.04.
Article Outline
1. Introduction
- Cox proportional hazard model is the most widely employed regression tool for modelling the relationship of covariates on survival time or other censored outcome. Even though Cox proportional hazard model has become the model of choice for analysis of time to event data in clinical studies, Accelerated Failure Time Model (AFTM) provides a more appropriate modelling framework in many such applications. A model that encompasses a wider range of survival time distribution is the AFTM[1]. The purpose of this model is to simultaneously explore the impact of several prognostic factors on survival time. This paper illustrates AFTM which is based on a modelling approach to the analysis of survival data as a much better alternative to the proportional hazard model. Under his model, we measure the direct effect of covariates on the survival time instead of hazard as we do in PH model. Various studies have been conducted to study the effects of prognostic factors on liver cirrhosis in Europe and Africa. Attia et al. (Attia KA, 2008) reported CTP score, MELD score and creatinine as independent predictors of mortality in 172 African patients suffering from cirrhosis[2]. London et al.(London MC, 2007), in a study of 308 cirrhotic patients on the waiting list for liver transplantation, described serum sodium and MELD score as independent predictors of survival[3]. Samada et al. (Samada M, 2008) conducted a study on 144 patients with liver cirrhosis and transplant candidates. The variables associated with survival were prothrombin time, serum bilirubin, albumin, sodium, gender, history of ascites, encephalopathy. Out of which, CTP score and bacterial peritonitis were independent predictors of poor survival[4]. All the above mentioned studies employed Cox PH model as a tool to predict the effect of prognostic factors on the survival of liver cirrhosis patients.Kay et al. (Richard K, 2002, USA) applied AFTM to evaluate the effects of oseltamivir in the time to resolution of symptoms in influenza and found the treatment effect to be highly significant[5]. Pourhoseingholi et al. (2007, Iran) in a retrospective study compared Cox regression withparametric models and found age at diagnosis, size of tumour and presence of pathologic distant metastasis as the significant factors effecting patients of gastric cancer[6]. In our retrospective study, we are proving that the parametric approach using AFTM is better than the Cox PH model.Although several researchers have applied AFTM on diseases like influenza, kidney transplant etc. it’s application on cirrhosis is still an unexplored avenue. Researchers till this point of time, have been using Cox PH model to evaluate the survivability of patients suffering from cirrhosis conditional on various predictors. To the best of our knowledge, this is the first such study for estimation of survival time of cirrhotic patients in the presence of predictors using AFTM. Also, the distribution of best fit amongst the several competing ones viz., Weibull, Exponential and Log logistic for an AFT model is adjudged using model selection criteria that include approximation of cumulative Cox-Snell residuals to (-log) Kaplan-Meier estimates and Akaike Information Criterion (AIC).A retrospective data from January 2007 to December 2010 of cirrhotic patients has been obtained from the Pushpawati Singhania Research Institute, New Delhi, India. Various prognostic factors like Age, Gender, HB, TLC, Platelet, Serum Creatinine, Serum Bilirubin, PT, Sodium, Potassium, SGOT, SGPT, Total Protein and Albumin, Ascites, Encephalopathy, Fever, Weakness, Edema, Anorexia, Black Stool, Altered Sensorium and Abdominal Distention have been evaluated for their significant effect on the survival time of cirrhotic patients.
2. Material and Methods
2.1. Kaplan Meier Estimate of Survival Time
- The Kaplan Meier (1958) is a non parametric method to estimate the survivor function
 which is the probability of survival past time t. For a dataset with observed failure times, t1, t2, …..tk, where k is the number of distinct failure times observed in the data, the Kaplan-Meier estimate (also known as the product limit estimate of S(t)) at any time t is given by
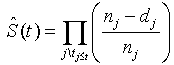 where nj is the number of individuals at risk at time tj and dj is the number of failures at time tj, the product is over all observed failure times less than or equal to t.It is the most widely used method in survival data analysis. Breslow and Crowley et al.[7] and Meier (1975b) have shown that under certain conditions, the estimate is consistent and asymptomatically normal.
 2.2. Cox’s Proportional Hazard Model
- Cox (1972) proposed a semi parametric model for the hazard function of a patient with covariate vector x
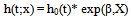 where h(t,x) denotes the resultant hazard(hazard rate), given the respective survival time in months, h0(t) is the baseline hazard function obtained for an individual with x = 0. The explanatory variables are linked to survival through exp(β,X), where β is the vector of unknown regression parameters. The explanatory variables act multiplicatively on the baseline hazard that is completely unspecified. A key reason to use this model is that even though the baseline hazard is not specified, reasonably good estimates of regression coefficients, hazard ratios of interest and adjusted survival curves can be obtained for a wide variety of data or we can say that Cox PH model is robust and will closely approximate the results of the correct parametric model.
 2.3. Accelarated Failure Time Model
- Accelerated failure time model is another alternative to Cox PH model when PH assumption is violated. Cox model is semi parametric, in that the baseline hazard takes no particular form. A link to parametric survival models comes through alternative functions for the baseline hazard. In accelerated failure time model, the time to event variable T is modeled on the log scale, directly in terms of x:
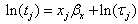 where x is a covariate vector and β is the corresponding coefficient and the random quantity
  has a specified distribution (Exponential, Weibull, Lognormal, Gamma and Loglogistic)[8,9]. The most intuitive manner to express AFT model coefficients is in the exponentiated form, as time ratios (TR = tj*/tj) for a unit increment change in the covariate
 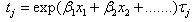 and
and 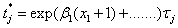 [10]. Thus, TR < 1 is associated with decrease in survival time and TR > 1 is associated with prolonged survival time, or, a contraction or expansion of time to failure. Adequacy of the AFT models for the data was initially gauged by plotting log survival (time) against a cumulative hazard function. Although, the parametric models are more efficient but they have more assumptions and if these assumptions are met, the analysis is more powerful. We have considered Weibull, Loglogistic and Exponential models with respect to the assumptions of monotone, unimodal and constant hazard function respectively. In order to compare AFTM and Cox regression model, the concept of Akaike Information Criterion (AIC) and Cox-Snell residual were used. P<0.05 was considered as statistically significant. The AIC proposed by Akaike(1947), is a measure of goodness of fit of an estimated statistical model. The AIC is an operational way of trading off the complexity of an estimated model against how well the model fits the data.For the models discussed above, the AIC is given by
 Where p is the number of parameters/covariates, k = 1 for exponential model and k = 2 for Weibull and Loglogistic model (Klein et al.,1997). Lower AIC indicates better likelihood.Competing models (with respect to distribution) were adjudged by approximation of cumulative Cox-Snell residuals to (-log) Kaplan-Meier estimates and minimization of AIC.
 3. Application and Results
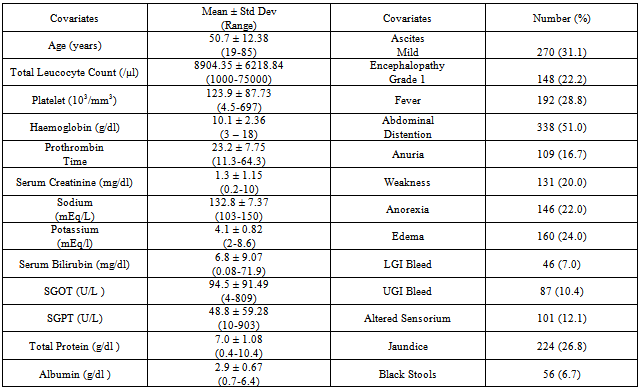
- A total number of 824 admitted patients suffering from Cirrhosis and HCC were studied retrospectively. Out of which, 666 (81%) were cirrhotic patients and their survival was observed for 60 months in the presence of prognostic factors as reported below. The average age of the patients is 51 years i.e. majority of the patients seems to be older. In order to see the effect of age on cirrhosis, we categorized age into 3 groups: less than 40 yrs, 40 to 60 yrs and greater than 60 yrs[11]. Platelet shows the signs of derangement, it is very less from the normal range. Serum Creatinine plays a significant role in determining the severity of the disease and it seems to be on the higher side in our data. Sodium and potassium lies within the normal range. Again, Serum Bilirubin is much higher from its normal range of (0.3-1.9mg/dl). Though, all other factors seems to lie within normal range but albumin is on the lower side. The statistical analysis was performed using STATA 11.0.The presenting symptoms/clinical parameters also play a major role in determining the severity of the disease. Although, all symptoms are equally important but ascites, encephalopathy, bleeding and altererd sensorium plays a significant role.Kaplan-Meier survival estimates and the patients number at risk over 60 months has been shown in the graph Figure 1. It can be observed that the patients suffering from liver cirrhosis has survival rate of 76% when they are observed for 5 years.
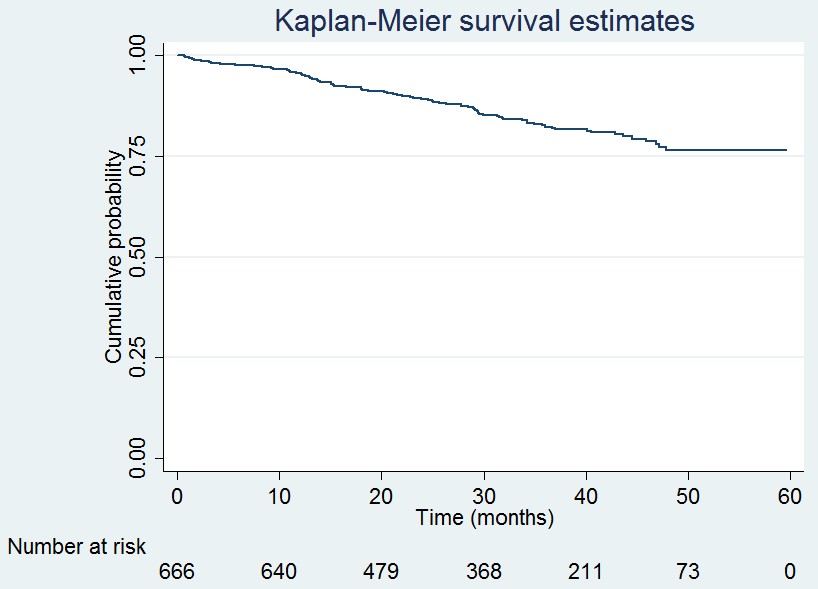 | Figure 1. stimation of survival of cirrhotic patients using Kaplan Meier Method |
|
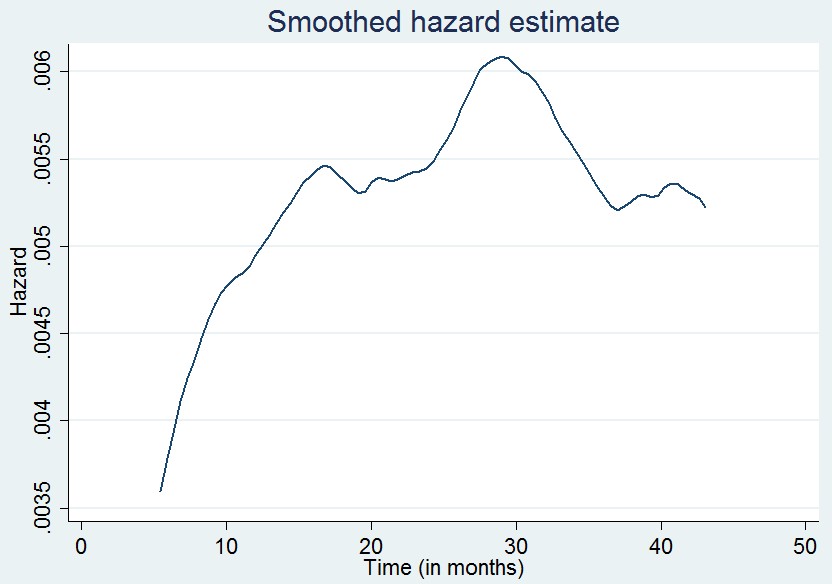 | Figure 2. nadjusted smoothed hazard |
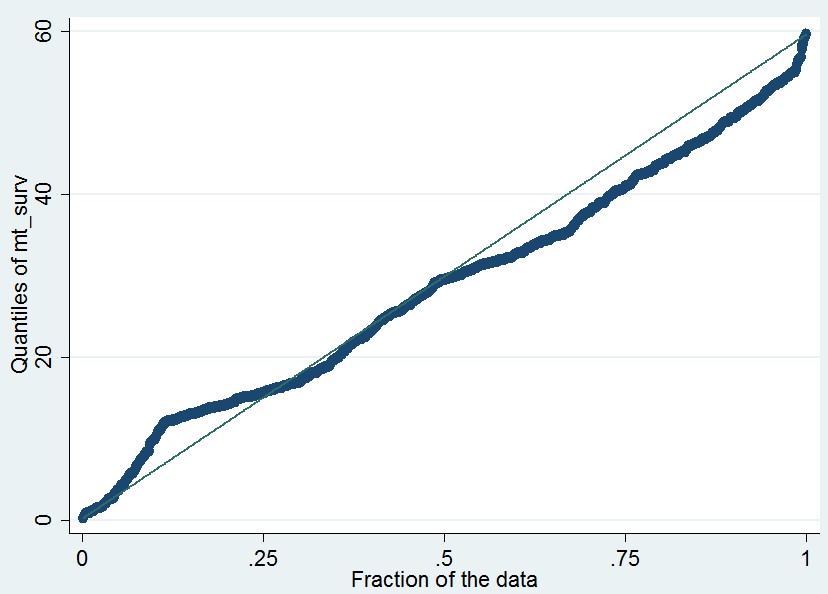 | Figure 3. -Q plot to check the AFT assumption |
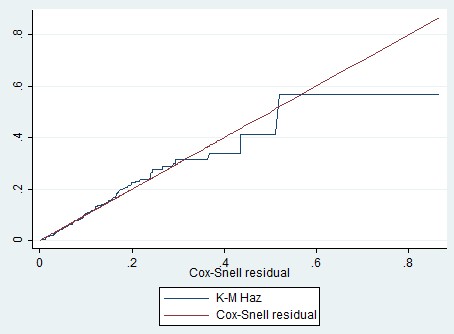 | Figure 4. Cox Snell Residuals for testing goodness of fit |
|

4. Discussion
- Cox model[12] is found to be the most frequently employed regression tool over parametric models for survival data[13,14] by researchers in medical sciences. A key quantity of interest in clinical studies with survival as the end point is the rate ratio, i.e, the relative increase in the failure rate with one unit increase in covariate. To estimate the rate ratio, some investigators use Cox proportional hazard regression model. In parametric AFT model, we need to determine the most appropriate distribution for the survival time[6,15,16] but in semi-parametric models the underlying hazard function is observed to be common across all the patients.Cox model expresses the multiplicative effect of covariates on hazard via conditioning on failure times whereas AFT model expresses the multiplicative effect of covariates on time to failure, by expanding or contracting it[17]. They provide estimates of the median survival time ratios. Hence, the AFT model may have explanatory advantage since covariates have direct effect on survival time. Based on asymptotic results, the AFT models leads to more efficient parameter estimates than Cox model under certain circumstances[18,19]. We explored the impact of older age, serum creatinine, altered sensorium and ascites on survival time. Cox PH model and AFT model in both univariate and multivariate analysis showed an increase in the risk of death for patients who are above 60 years of age, presence of altered sensorium and increased level of serum creatinine.Serum creatinine is a strong and independent prognostic factor for liver cirrhosis and our findings in univariate and multivariate analysis is in conformity with previous reports (Attia KA, 2008) indicated poor survival of patients with high level of creatinine. Botta (Botta F, 2003) compared the survival of cirrhotic patients at 6 months and 12 months and found creatinine as one of the factor for lower survival[20]. Altered Sensorium is another significant factor contributing to poor survival. Said (Said A, 2004) followed cirrhotic patients for one year and concluded that altered sensorium is an independent significant factor for lower survival of cirrhotic patients[21].The above mentioned references have applied only Cox PH model to identify prognostic factors of liver cirrhosis. But, in our dataset we have applied accelerated failure time (AFT) model and also found these factors to be significant. This is the first time that AFT model has been applied to a retrospective liver cirrhosis data and found this model to be more realistic and appropriate than proportional hazard model in the analysis of time to event data.To study the effect of prognostic factors on liver cirrhosis, the accelerated failure time model provides an adequate fit of the data and from clinical perspective it is based on more realistic assumptions than Cox PH model.Therefore, from authors’ view point it would be better for researchers of health care field to consider accelerated failure time model instead of Cox PH model in further research related to the analysis of time to event data. In spite of various illustrated advantages, further research to apply AFT model can be carried out to evaluate the effect if small sample size is obtained or baseline hazard function is known or the proportional hazard assumption is not satisfied.
ACKNOWLEDGEMENTS
- Authors wishes to acknowledge Mr. V. Ravi for his tremendous support to make this article more informative with his knowledge and experience.