-
Paper Information
- Previous Paper
- Paper Submission
-
Journal Information
- About This Journal
- Editorial Board
- Current Issue
- Archive
- Author Guidelines
- Contact Us
International Journal of Statistics and Applications
p-ISSN: 2168-5193 e-ISSN: 2168-5215
2013; 3(3): 81-85
doi:10.5923/j.statistics.20130303.08
Application of Mantel’s Permutation Technique on Asphalt Production in Nigeria
 Abstract
 Reference
 Full-Text PDF
 Full-text HTML
Aronu C. O., Ebuh G. U.
Department of statistics Nnamdi Azikiwe University, Awka, Nigeria
Correspondence to: Aronu C. O., Department of statistics Nnamdi Azikiwe University, Awka, Nigeria.
| Email: |  |
Copyright © 2012 Scientific & Academic Publishing. All Rights Reserved.
The Mantel test is widely used to test the linear or monotonic independence between two or more distance matrices. This test is appropriate when the hypothesis under study can be designed in terms of distances; this is often the case with genetic data which include any conceivable proximity matrices. This study focused on the application of Mantel statistic on an engineering concept. The method measured the linear resemblance on production of asphalt in two construction firms operating in Anambra State. Secondary data from the two construction companies on production of asphalt in Anambra state were used to evaluate the technique. Using R 2.13.0 programming package, the Mantel function for 10,000 permutations was called to evaluate the method. It was observed that there exists a strong positive resemblance between the object of Asphalt production between the Consolidated Construction Company and Inter – Bau Construction limited with a P-value of 0.33 which fall’s on the acceptance region assuming 95% confidence interval.
Keywords: Distance Matrices, Hypothesis, Linear Independent, Proximity Matrices, p-value and Resemblance
Cite this paper: Aronu C. O., Ebuh G. U., Application of Mantel’s Permutation Technique on Asphalt Production in Nigeria, International Journal of Statistics and Applications, Vol. 3 No. 3, 2013, pp. 81-85. doi: 10.5923/j.statistics.20130303.08.
Article Outline
1. Introduction
- The mantel test is a permutation technique that estimates the resemblance between two proximity matrices computed about the same object. The matrices must be of the same rank, but not necessarily symmetric, though from practice this is often the case. The Mantel technique was first introduced as a solution to the epidemiological question where interest is on whether case of diseases that occurred close in space also tend to be close on time. Hence, the technique was used to compare matrix of spatial distances in a generalized regression approach by[1]. Since[2], the Mantel test has always included any conceivable proximity matrices; [3];[4];[5];[6]. However, the application of mantel test in an engineering concept has little or no literature against it common use in biology, psychology, geography and anthropology;[7]. Thus, the application of mantel test by research engineers in Nigeria on asphalt production has no literature. The result from this work will convince research engineers in Nigeria on the application of mantel test in measuring resemblance of same objects of interest in so many fields. The main objective of this study is to measure the linear resemblance of various objects on asphalt production in two different construction companies.
2. Notations and Methods
2.1. Simple Mantel Test
- The simple Mantel test has the ability of testing the hypothesis that the distances among objects in a matrix A are linearly independent of the distances among the same objects in another matrix B. The result of this test can be applied in supporting for or against the hypothesis that the process that generated the first set of proximities is independent of the process that generated the second set. One important advantage of the Mantel test is the use of a linear statistic to assess the relationship between two proximity matrices. It should be noted that under a stated null hypothesis, the objects are the permutable units, not the distances which are not independent of one another; so, for the test of significance, randomization is obtained by permuting the n objects of one of the distance matrices. Suppose
 and
and  represent the distance observational units
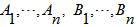
  and
and  as derived from the observations for variables
  and
and  , where,
  =
=  and
and  denote the corresponding distance matrices. The normalized Mantel statistic, defined as the product – moment coefficient between distance matrices
  and
and  , is
, is 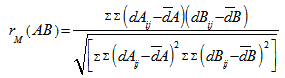 | (1) |
 denotes the double summation over
  and
and  which ranges from one to n and
  by symmetry of
 and
and  , and
, and  and
and  are means of distances derived from the
  and
and  raw data respectively.It should be noted that Equation (1) is measured on distance matrices, hence when the objects in the two matrices of interest are unfolded into a column vector one can either use the Pearson correlation or the spearman correlation statistic as stated in the testing procedure by[8].The Pearson correlation statistic measures the extent of linear resemblance between two variables; it tests the hypothesis whether the linear correlation between two or more variables is zero against a given alternative hypothesis. The product – moment statics as defined by Karl Pearson is given as
 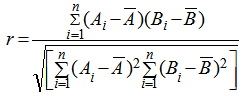 | (2) |
 and
and  and
and  denote random samples of size n for variables A and B with their corresponding sample means. Alternatively, the Spearman’s rank correlation can be used and this test statistic measures the extent of monotonic relationship between two or more variables, without making assumption about the frequency distribution of the variables. The Spearman’s test statistic is written as
 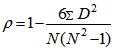 | (3) |
2.2. Testing Procedures
- The testing procedure is given as stated by[8]:1. Considering two symmetric resemblance matrices (similarities)
 and
and  , of size (
 ), whose rows and columns correspond to the same set of objects. Compute the Pearson correlation Equation (2) (alternatively, the spearman correlation, Equation (3)) between the corresponding objects of the upper-triangular (or lower-triangular) portions of these matrices, obtaining the mantel correlation (often called the standardized Mantel statistic)
  which will be used as the reference value in test.2. Permute at random the rows and corresponding columns of one of the matrices, say
  , obtaining a permuted matrix
  . This procedure is called ‘matrix permutation’.3. Compute the standardized Mantel statistic
  between matrices
  and
and  , obtaining a value
  of the test statistic under permutation.4. Repeat steps 2 and 3 a large number of times to obtain the distribution of
  under permutation; then, add the reference value
  to the distribution.5. For a one – tailed test involving the upper tail (i.e., H 1+: distances in matrices
  and B are positively correlated), calculate the probability (p – value) as the proportion of values
  greater than or equal to
  . For a test in the lower tail, the probability is the proportion of values
  smaller than or equal to
  .Note that for symmetric distance matrices, only the upper (or lower) triangular portions are used in the calculations while for non symmetric matrices, the upper and lower triangular portions are included. The main diagonal elements need not be included in the calculation, but their inclusion does not change the p- value of the test statistic.
2.3. Source of Data
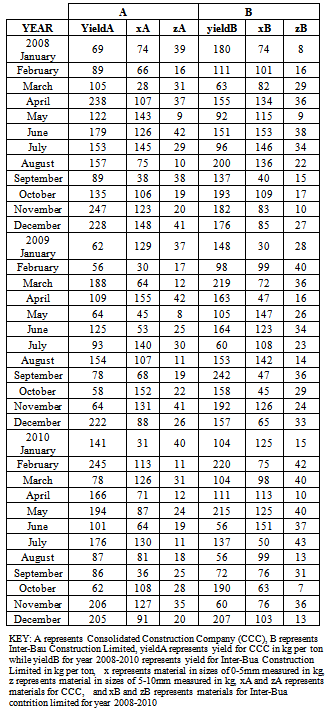
- The source of data used for this study is secondary data; obtained from the records department, laboratory department, and data from the plant engineers of three different construction companies operating at Anambra State (Consolidated Construction Company (CCC) and Inter–Bau Construction Limited Data on the monthly production yield of asphalt and two key materials used for asphalt production was obtained for a period of three years (2008 – 2010).
2.4. Data Presentation
3. Analysis and Results
- Inputting the data in Table 1 on R 2.13.0 command window;[10], where yieldA, xA and zA are objects of matrix A while yieldB, xB and zB are objects of matrix B. It should be of interest to note that the class distance of matrices A and B based on canonical measure is labeled DA and DB respectively. The Mantel statistic function for 10, 000 permutations were called as will be observed on the command window shown below:> yieldA<-c(69, 89, 105, 238, 122, 179, 153, 157, 89, 135, 247, 228, 62, 56, 188, 109, 64, 125, 93, 154, 78, 58, 64, 222, 141, 245, 78, 166, 194, 101, 176, 87, 86, 62, 206, 205)> xA<-c(74, 66, 28, 107, 143, 126, 145, 75, 38, 106, 123, 148, 129, 30, 64, 155, 45, 53, 140, 107, 68, 152, 131, 88, 31, 113, 126, 71, 87, 64, 130, 81, 36, 108, 127, 91)> zA<-c(39, 16, 31, 37, 9, 42, 29, 10, 38, 19, 20, 41, 37,17, 12, 42, 8, 25, 30, 11, 19, 22, 41, 26, 40, 11, 31, 12, 24, 19, 11, 18, 25, 28, 35, 20)> yieldB<-c(180, 111, 63, 155, 92, 151, 96, 200, 137, 193, 182, 176, 148, 98, 219, 163, 105, 164, 60, 153, 242, 158, 192, 157, 104, 220, 140, 111, 215, 56, 137, 56, 72, 190, 60, 207)> xB<-c(74, 101, 82, 134, 115, 153, 146, 136, 40, 109, 83, 85, 30, 99, 72, 47, 147, 123, 108, 142, 47, 45, 126, 65, 125, 75, 98, 113, 125, 151, 50, 99, 76, 63, 76, 103)> zB<-c(8, 16, 29, 36, 9, 38, 34, 22, 15, 17, 10, 27, 28, 40, 36, 16, 26, 34, 23, 14, 36, 29, 24, 33, 15, 42, 40, 10, 40, 37, 43, 13, 31, 7, 36, 13)> A <-matrix(c(yieldA, xA, zA), nrow = 3, byrow = TRUE)> B <-matrix(c(yieldB, xB, zB), nrow = 3, byrow = TRUE)> DA<-dist.quant(A, method = 1)> DB <-dist.quant(B, method = 1)Displaying the elements of distance matrices DA and DB which are object of class distances based on the canonical measure (method =1).
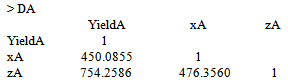 Where it was observed from the result displayed in DA that the distance between yieldA and yieldA; xA and xA; zA and zA , is 1, distance between yieldA and xA; yieldA and zA; xA and zA were 450.0855, 754.2586 and 476.3560 respectively.
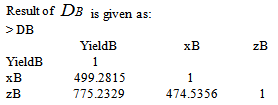 While the result displayed in DB showed that the distance between yieldB and yield B; xB and xB; zB and zB , is 1, distance between yieldB and xB; yieldB and zB; xB and zB were 499.2815, 775.2329 and 474.5356 respectively.The mantel.rtest function was used to perform the mantel test for 10000 permutations, where “nrept” represents the number of permutations of interest and is called as stated below on R command window;> mantel.rtest(DA, DB, nrepet = 10000)Result of mantel.rtest function Monte-Carlo test Observation: 0.9884392 Call: mantel.rtest(m1 = DA, m2 = DB, nrepet = 10000) Based on 10000 replicates Simulated p-value: 0.3316668
4. Discussion
- From the result shown above, the class distance for matrix A; DA, showed that the distances between yieldA and yieldA; xA and xA; zA and zA , is 1, where distance between yieldA and xA; yieldA and zA; xA and zA were 450.0855, 754.2586 and 476.3560 respectively. Similarly, the class distance of matrix B; DB, showed that the distance between yieldB and yield B; xB and xB; zB and zB , is 1, where distance between yieldB and xB; yieldB and zB; xB and zB were 499.2815, 775.2329 and 474.5356 respectively. From the result of the mantel.rtest function observation = 0.9884392 can be referred to as the reference value
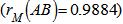 as stated by[8] in the testing procedure. Also, the P-value of 0.3316668 which fall’s on the acceptance region with a significance level of 5% (α = 0.05), implies that there exist no significance difference on the object of class distance DA and class distance DB.
5. Conclusions
- From the discussion above, it was observed that there exists a strong linear positive resemblance between the objects of the class distance, DA (Consolidated Construction Company) and class distance, DB (Inter – Bau Construction limited) with 99.84% degree of resemblance. Equally, it was obtained that there exist no significance difference on the objects of class distance, DA and class distance, DB, since the p-value obtained is 0.33 which falls on the acceptance region of the test hypothesis assuming a 95% confidence Interval. However, from the result of the present study, one can conclude that the Mantel test is an appropriate and adequate statistical tool to be considered in most multivariate studies in engineering field especially when interest is on determining the extent of association between two class of distance matrices; therefore we wish to suggest that research engineers should apply the mantel statistic in most of their research work especially when the data of interest is multivariate in design and very large in volume because the use of distance/proximity matrices makes the data easier to manage as well as exhausting the advantage of the exactness of the p-value for permutation methods.
Appendix
- Illustrative Manual Solution of the MethodologyFrom the result displayed by class distances DA and DB, we shall unfold the lower objects of matrices DA and DB into column A and B in Table 2 below:
|
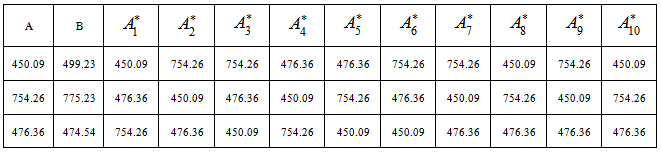
 are the various permutations of the vector A.Using the formula labeled Equation 1, we shall obtain the following measure to form the distribution under 10 permutations as given;
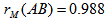 and the measures below forms
  (the distribution under permutation) for 10 permutations;
 For a one – tailed test involving the upper tail, we calculate the probability as the proportion of values
  greater than or equal to
  . Since the number of
  (the reference value) is given as p-value= 3/10= 0.30. We should understand that as the number of permutation increases to 10,000 to 50,000 permutations the distribution under permutation stabilizes.