Olatunde A. Adeoti
Department of Mathematics and Statistics, Bowen University, Iwo, 23001, Nigeria
Correspondence to: Olatunde A. Adeoti, Department of Mathematics and Statistics, Bowen University, Iwo, 23001, Nigeria.
| Email: |  |
Copyright © 2012 Scientific & Academic Publishing. All Rights Reserved.
Abstract
In this paper cumulative Sum (CUSUM) chart is applied to monitor increase (changes) in the number of HIV/AIDS incidences in Nigeria using the screening result of HIV/AIDS data in Oyo state. The designed scheme is apply to demonstrate the application of the chart and evaluate the performance of the chart in the non manufacturing area. From the evaluation, the chart has a good potential as a SPC tool for monitoring changes in the number of infectious diseases in Nigeria
Keywords:
Cumulative Sum (CUSUM), Average Run Length (ARL), HIV/AIDS
Cite this paper: Olatunde A. Adeoti, Application of Cusum Control Chart for Monitoring HIV/AIDS Patients in Nigeria, International Journal of Statistics and Applications, Vol. 3 No. 3, 2013, pp. 77-80. doi: 10.5923/j.statistics.20130303.07.
1. Introduction
Cumulative Sum (CUSUM) control chart conceived by[13] and which have been developed by many authors [5],[3],[8],[10],[9] have been proposed as an alternative to Shewhart charts because it gives a tighter process control than classical quality control schemes such as Shewhart scheme. This is because they detect small shifts in the process level more quickly as they give an early indication of process change and they are more meaningful graphically as they point out areas needing attention.Cumulative Sum quality control scheme is widely used in manufacturing industry to detect a change in the quality of a manufactured product but their application in non-manufacturing concerns have not been very wide.[1] provides overview of SPC and its primary tool- the control charts highlighting the challenges and benefits of the control chart as a tool for health care improvement.CUSUM control schemes are currently used for the control of variables than for the control of attributes, except until recently when the procedure for the design and implementation of the counted CUSUM was developed by[9] who demonstrated that they are similar to that of the variable data[8]. Counted data CUSUM otherwise known as Poisson CUSUM is used when it is administratively convenient to record the number of counts in a given sampling interval, that is, when it follows a Poisson distribution.It is recognized that CUSUM scheme is a sequence of Wald sequential probability ratio tests (SPRT’s) which allows for the optimality properties of CUSUM procedures to be developed. Therefore, designing a CUSUM as sequence of SPRT’s suggest a different tabulation of CUSUM average run length(ARL) than has been previously published by[5] and[2].[7] showed the superiority of a CUSUM scheme for detecting a rare event over a non- CUSUM scheme.[10] also went further to include the Fast Iinitial Response (FIR) feature. The FIR feature gives a simple procedure for detecting an out-of-control situation at start-up more quickly. However, if the process is initially in control state, the FIR feature has little effect whereas if it is in an out-of-control state, a signal is given much more quickly.The principal feature of the CUSUM control scheme is that it cumulates the difference between an observed value and a predetermined target value, µa The cumulative sum of the deviations from the target value, µa given by 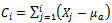 | (1) |
is then plotted on a chart or tabulated. To detect an upward or downward shift (change) from target, the tabularCUSUM statistic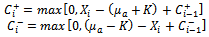 | (2) |
is used to detect an increase and a decrease in the process mean level, where max (a ,b) is the maximum of a and b and  is the acceptable process mean. The process is taken to be out-of-control if
  where H is the decision interval. This paper describes the application of a CUSUM chart to monitor increase (shift) in the incidences of HIV/AIDS using data from Oyo state. HIV/AIDS is one of the deadly diseases in Nigeria and the world at large and many research have been carried out by different authors on the causative factors, however the need to monitor changes in the rate of infection is desirable so that factors responsible for the high number of patients testing positive to the disease can be quickly identified and urgent and necessary action taken to curb its spread
2. Materials and Methods
2.1. Determining the Value of K
The parameter K is the reference value for the CUSUM scheme and will be chosen to be between the acceptable process mean  and the mean level of the process µd that the CUSUM scheme is to detect quickly, where
  and µd are the mean numbers of counts per sampling interval.[10] recommended that for a control scheme designed to detect a specific mean shift of
  , a value of
  be used.[11] gave the expression for determining K as
 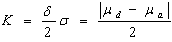 | (3) |
where  is the deviation from the acceptable process mean. This reference value is the same as the reference value for testing the hypothesis
 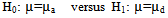 | (4) |
2.2. Determining the Value of H
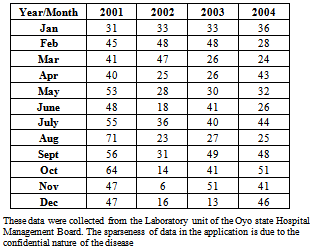
After K is selected, the decision interval H is determined from table extracted from Poisson CUSUM Average Run Length (ARL) with or without FIR. The value of H should give an appropriately large ARL when the process is at its desired Acceptable Quality Level (AQL) and an appropriately small ARL value when the process has shifted to an undesired Rejectable Quality Level (RQL). Usually the FIR feature is used to give quicker detection in case of start-up problems after a (possibly ineffective) control action. An alarm is signaled whenever the CUSUM statistic is greater than H. Table 1. Data of Patients Testing Positive to HIV/AIDS disease
 |
| |
|
However,[11] recommended that a reasonable value for H is five times the process standard deviation, σ which is used in this study. Also the ARL approximation given by[14] is used to calculate the chart Average Run Length (ARL) value.
3. Application
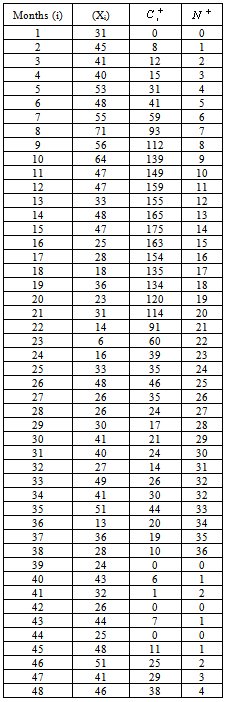
Table 2. Tabular CUSUM for the HIV/AIDS data
 |
| |
|
A tabular CUSUM data scheme was designed for the detection of an increase in the number of HIV/AIDS using the AIDS screening data collected from the Laboratory unit of the Oyo state Hospital Management Board from January 2001 to December 2004 (48 months) in Table 1. Data were limited to this period because of difficulty in obtaining data associated with this disease due to the confidentiality of the case.[12] stated that the ARL value of at AQL denoted La and ARL value ofµd at RQL denoted Ld are determined in accordance with the authority desire which can be revised from time to time. They also recommended that the mean level of occurrence of the disease be usually taken as the acceptable process mean level of the disease.[9] recommended that acceptable mean level
 is often chosen near to the current mean level, as this represent current system performance. However, using the HIV/AIDS screening data in Table 1 and the fact it is a life threatening disease and a silent killer, the mean level of occurrence of the disease is 30 i.e
  = 30 and with a standard deviation,
  Now, suppose the authority (government) chose a shift of 1.0σ from
  to be RQL, then a shift of 1.0σ in the positive direction gives
  =44 and the K value from equation 3 is given as 7. This is shown to be same as reference value for testing the hypothesis
  [11] recommended that a reasonable value for H is five times the process standard deviation σ, which gives a good in-control ARL value for the data, and so H = 5σ i.e. H=70. The computation of the CUSUM for the changes in the HIV/AIDS incidence using equation (2) shown in Table 2 is given so that it is easy to compute for non-statisticians.
  indicates the number of consecutive periods that CUSUM statistic have been nonzero.The CUSUM scheme for detecting an upward shift will signal an out-of-control whenever
 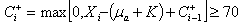 H =hσ= 70 and K =kσ=7 where h=5, k=0.5 and σ=14.
4. Performance of Control Chart
The most applicable and universal way to evaluate the performance of control charts is how quick it can detect shifts in process quality and this can be obtained by calculating the Average Run Length (ARL). The ARL is the expected number of points plotted within control limits before it indicates an out-of-control condition. In this study, the evaluation criteria is the ARL approximation of[14] given as 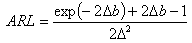 | (5) |
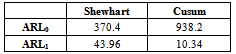
for ∆ ≠ 0 where  for the upper CUSUM,b= h +1.166 and δ* = (μd - μa) /σ. The in-control ARL (ARL0) is calculated from (5) when δ* = 0 and the out-of-control ARL (ARL1) is calculated if δ*≠0, corresponding to a shift of size δ*.A control chart with largest in-control ARL (ARL0) and smallest out-of-control ARL (ARL1) will be adjudged superior out of all the control charts considered. Since the performance of the EWMA chart is approximately equivalent to CUSUM chart because both are used to monitor a small sudden shift in process variable, in-control and out-of-control ARLs for CUSUM chart and Shewhart chart are compared for evaluating the performance of control chart. Table 3 summarizes the in-control and out-of-control ARLs for CUSUM chart using equation (5) and Shewhart chart with the usual 3σ units .
Table 3. In-control Average Run Length and Out-of-control Average Run Length for Cusum and Shewhart charts
 |
| |
|
5. Results and Discussion
Figure 1 is a graphical display of CUSUM chart for an out of control signal whenever .It indicates that there will be a change (shift) which is mostly an increase in the number of patients who tested positive to HIV/AIDS as recorded in Oyo state hospitals whenever the decision interval, H is exceeded.From the HIV/AIDS incidences data in Table 2, CUSUM statistic signal out-of-control at period 8 i.e August 2001 since
  > H=70. Thus at this period an assignable cause of variation is at work but which gradually fizzle out from period 23 because less patients tested positive to this disease from November 2002 probably as a result of awareness and government intervention which reduces the rate of infection . Also, the superiority of the CUSUM chart over the Shewhart chart for monitoring a small sudden shift in process variable is shown in Table 3. The Cusum chart is able to quickly detect an out-of-control (abnormal) condition for the number of HIV/AIDS patient than the Shewhart chart.
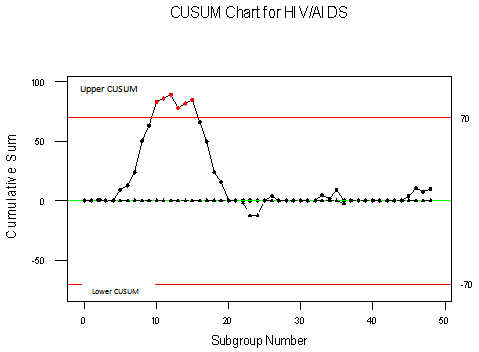 | Figure 1. Cusum chart of Patients Testing Positive to HIV/AIDS disease |
6. Conclusions
CUSUM control scheme are simple to use, versatile in that they can be tailored to detect important change (shift) in process level and powerful because they make use of all information in the data to detect shifts quickly. Thus, the ability of CUSUM to detect change in the HIV/AIDS incidences demonstrates its importance and usefulness as a means of monitoring and controlling process change in the non- industrial setting.
ACKNOWLEDGEMENTS
The author would like to express his sincere appreciation to the referees for their useful comments and suggestions to improve the quality of this article
References
| [1] | Adeoti, O.A., 2009, On the Application of Statistical Process Control in Health Care. Nigerian Journal of Medicine, 18, 25-28 |
| [2] | British Standards Institution,1982, British standards guide to Data Analysis and Quality Control Using CUSUM Techniques (BS 5703, Part 4), London |
| [3] | Brook, D and Evans, D.A., 1972, An Approach to the probability distribution of CUSUM Run lengths. Biometrika, 59, 539-549 |
| [4] | Ewan, W.D.,1963, When and how to use CUSUM charts. Technometrics, 11, 307-315 |
| [5] | Ewan, W.D. and Kemp, K.W., 1960, Sampling Inspection of Continuous Process with No autocorrelation between successive results. Biometrics, 47, 363 – 380 |
| [6] | Kempt, K.W. 1962, The use of cumulative sums for sampling inspection schemes. Applied Statistics, 11, 16- 31 |
| [7] | Kenett, R and Pollak, M. 1983, On sequential Detection of a shift in the probability of a rare event. Journal of the American Statistical Association, 78, 389- 395 |
| [8] | Lucas, J.M., 1976, The design and use of the cumulative sum control schemes, Technometrics, 14, 51 – 59 |
| [9] | Lucas, J.M., 1985, Counted data CUSUM. Technometrics, 27, 129-144 |
| [10] | Lucas, J.M and Crosier, R.B., 1982, Fast initial response for CUSUM quality control scheme. Technometrics, 24, 199- 205 |
| [11] | Montgomery, D.C., 2005, Introduction to Statistical Quality Control, 5th Edition, Wiley New York |
| [12] | Osanaiye, P.A and Talabi, C.O., 1989, On some Non-Manufacturing Applications of Counted Data Cumulative Sum (CUSUM) Control Chart Schemes. The Statistician, 38, 251 -257. |
| [13] | Page, E.S., 1954, Continuous inspection schemes. Biometrika 41,100-115 |
| [14] | Siegmund, D.,1985, Sequential Analysis: Test and Confidence Intervals, Springer-Verlag, New York |
 Abstract
 Reference
 Full-Text PDF
 Full-text HTML