-
Paper Information
- Previous Paper
- Paper Submission
-
Journal Information
- About This Journal
- Editorial Board
- Current Issue
- Archive
- Author Guidelines
- Contact Us
International Journal of Statistics and Applications
p-ISSN: 2168-5193 e-ISSN: 2168-5215
2013; 3(2): 33-38
doi:10.5923/j.statistics.20130302.03
Variation in Fecundability among Indian Females
 Abstract
 Reference
 Full-Text PDF
 Full-text HTML
1Department of Statistics, Faculty of Science, Banaras Hindu University, Varanasi-221005, India
2DST-CIMS, Department of Statistics, Faculty of Science, Banaras Hindu University, Varanasi-221005, India
Correspondence to: Shilpi Tanti, DST-CIMS, Department of Statistics, Faculty of Science, Banaras Hindu University, Varanasi-221005, India.
| Email: |  |
Copyright © 2012 Scientific & Academic Publishing. All Rights Reserved.
Several studies have assumed that fecundability of female is constant over time except the early reproductive ages i.e., <=15 years. In this paper, an attempt has been made to test this hypothesis since in spite of being a biological factor, fecundability is also governed by a large number of socio-demographic and cultural factors associated with it. In the present study, fecundability is estimated for India as well as different major states of the country in different age-groups of the females using the data of their last closed birth interval. The relevant data are compiled from the National Family Health Survey III. Life table technique is used to estimate age specific fecundability to statistically grip the problem of censoring and selectivity. The results show that fecundability decreases with increasing age of the females. But, from this it cannot be inferred that age is the only factor responsible for variation in fecundability. This may be due to some socio-cultural factors which influence the behavioural factor, coital frequency. This study suggests that the variation in fecundability among the Indian females is due to the confounded effect of age and some socio-cultural factors associated with coital frequency and the effect of these two cannot be separated.
Keywords: Censoring, Selectivity, Fecundability, Life Expectancy, Parity, Closed Birth Interval, Coital Frequency
Cite this paper: K. K. Singh, Shilpi Tanti, Variation in Fecundability among Indian Females, International Journal of Statistics and Applications, Vol. 3 No. 2, 2013, pp. 33-38. doi: 10.5923/j.statistics.20130302.03.
1. Introduction
- Fecundability is defined as the probability of conception in one menstrual cycle of a fecund female. Usually, the measure, fecundability is obtained indirectly from the data of waiting time to conception between two consecutive births. This duration variable is not only governed by biological factors but also various socio-cultural and behavioural factors associated with it. Many studies have assumed that fecundability of female is constant over time except the early reproductive ages i.e., ≤15 years. Is this hypothesis true? If this is not true then how fecundability varies over time in a female's reproductive span and what will be the plausible reason for its variation? These questions are of great interest to demographers as well as to couples concerned about their infertility and about how long they can wait in postponing childbearing[4]. Keeping in view the above questions, an attempt has been made here to study how fecundability varies w.r.t age of the females using their age at last birth and their corresponding last closed birth interval (LCBI). LCBI is defined as the interval between last and last but one birth prior to the survey date. The structure of LCBI is examined by [5] irrespective of parity, after subtracting the actual length of post-partum amenorrhea (PPA) in the traditional Indian society. Fecundability is frequently estimated from the probability distribution of waiting times to conception. It has been observed that for a homogeneous group of females, the reciprocal of mean waiting time to conception gives the arithmetic mean of fecundability, whereas for a heterogeneous group of females, it gives the harmonic mean of fecundability[3]. The data on waiting time to conception is generally not available in any survey data; it can be obtained from the data on birth intervals.It is well known that the collection of birth interval data in developing countries suffers from non-sampling errors arising out of recall lapse on the part of respondents. These errors, which are sometimes serious, often vitiate the data if the duration of time elapsed since the occurrence of the event is large[1,2]. Due to these errors, more caution has to be exercised to arrive at any valid conclusions about fertility levels[6, 8, 9, 11, 12]. In this context, the data of LCBI will be more reliable for the analysis of fertility changes among married females compared to other CBI[7,10] as it seems to be less affected by memory biases. A CBI is generally composed of three mutually exclusive random components in the absence of defective terminations of pregnancy (foetal losses), viz.;i) a period of temporary sterility caused by PPA following the previous birth during which no conception is possible;ii) the menstruating period, i.e., the waiting time to conception (X); andiii) the period of gestation leading to the next birth. Except for the last component, which is generally taken to be constant equal to nine months, the other two components vary considerably with the age of the married female and with their parity. Hence to study the distribution of CBI, one has to study the distributions of PPA and the waiting time to conception. Naturally, this distribution will involve the parameter fecundability which can be estimated using appropriate methods. Here to estimate fecundability, life table technique is being used under some steady state conditions. Life table is constructed for the females of different age-groups for estimating the age specific fecundability. The relevant technique is described in Section 2. The data used for the study have been taken from National Family Health Survey III (NFHS III).
2. Data and Methodology
- As mentioned earlier, the analysis of data on birth interval generally suffers from selectivity and censoring. The problem of selectivity arises due to the fact that highly fecund females may reach the ith parity first and hence low fertility females get excluded from the analysis. The censoring refers to the period of exposure, i.e.; for some females, the period of exposure is only partially known. Hence, problem of censoring arises because some of the females who have reached parity i do not reach parity (i+1) as they will not get adequate time due to the short exposure period by the reference date of the survey. The problem of censoring as well as selectivity can be statistically handled through the application of life table technique.The life table is largely a product of actuarial science; its application is not limited to the computation of insurance premiums. Advances in theoretical statistics and stochastic processes have made it possible to study length of life from a purely statistical point of view, making the life table a valuable analytical tool for demographers, epidemiologists, physicians, zoologists, manufacturers and investigators in other fields.Here, the distribution of LCBI is analysed to arrive at any valid conclusion about fecundability by life table technique. In the present paper, the life tables are constructed for the cohort of different age groups of the females based on the following assumptions:i) The duration of PPA is same for each and every female during the study period.ii) Each conception results in a live birth.In the present analysis, the females who have at least one child are considered. The females having at least two children are considered as event of the study and the rest are considered as censored cases. It is mentioned earlier that the study variable is composed of three components viz., the non susceptible PPA period associated with the previous birth, the waiting time for conception and the gestation period. The duration of PPA is here taken as 6 months (median duration of PPA) for each female and the period of gestation is taken as 9 months. Here, the duration of PPA is computed from the data of last birth occurred five years prior to the survey date using life table technique. The present analysis is restricted for the females whose last closed birth intervals are less than 135 months. The females are being followed for 135 months in the sense that they will get 135-15=120 months full exposure period to conceive, where 15 months is the rest period, i.e., the sum of non susceptible PPA and gestation period. In the analysis, the censored females who are widowed/divorced/not living together with husband are excluded as they are not exposed to the risk of conception. The sterile censored females are also excluded from the study since they are also not exposed to the risk of conception in the near future. The censored females who have reported that they don't have desire for more children are also excluded from the study. The censored females whose age at last birth are greater than or equal to 40 years and open birth intervals are greater than or equal to 120 months are not included in the study. The desired life tables are then constructed for different age groups of the females by treating the total females of that age group as a cohort which is exposed to the risk of conception in the successive 10 months interval. Analogous to the usual abridged life table where x column depicts the person's age in interval i.e.; x to x+n, here x column has also been introduced which represents the duration of waiting time to last conception of concerned females in units of 10 months i.e.; x to x+10. Since, waiting time to conceptions up to 129 (in the sense that the censored females will not have the gestation period, they will have only the PPA period and the menstruating period during the study period, i.e.; 135-6=129 months) have only been considered hence x takes thirteen values ranging from 0 to 129. For example, the interval 0-9 months is denoted as x=0, the interval 10-19 months is denoted as x=1 and so on.The
 column in the present case denotes the number of females conceive between (x, x+10), in contrast to the abridged life table where it stands for number of persons dying between ages (x, x+n).The two columns
  and
and  are the columns of main interest in any life table analysis. In the usual life table,
  gives the conditional probability of death during (x, x+n) for the persons who have not died up to x and
  gives an estimate of the average future life time after attainment of age x and consequently
  gives an estimate of average life in the population. In the present study,
  represents the conditional probability of conception during (x, x+n) for the females who have not conceived up to x, whereas,
  represents the average waiting time to conception for the specific cohort. Since, in the present case, one unit of time is taken as 10 months, the product of
  and unit of time i.e.; 10 will give the average waiting time to conception. The mean fecundability can be obtained from the average waiting time to conception through the inverse relationship between them. Thus, from the value of
  , the mean fecundability can be estimated for specific age groups.The technique is then applied to the data of India as well as its twelve major states viz., Assam, Bihar, Madhya Pradesh, Rajasthan, Uttar Pradesh, Orissa, Maharashtra, Andhra Pradesh, Karnataka, Kerala, Tamil Nadu and West Bengal situated in different regions of the country obtained from National Family Health Survey III (NFHS III) to find the mean fecundability for specific age groups.
3. Results and Discussion
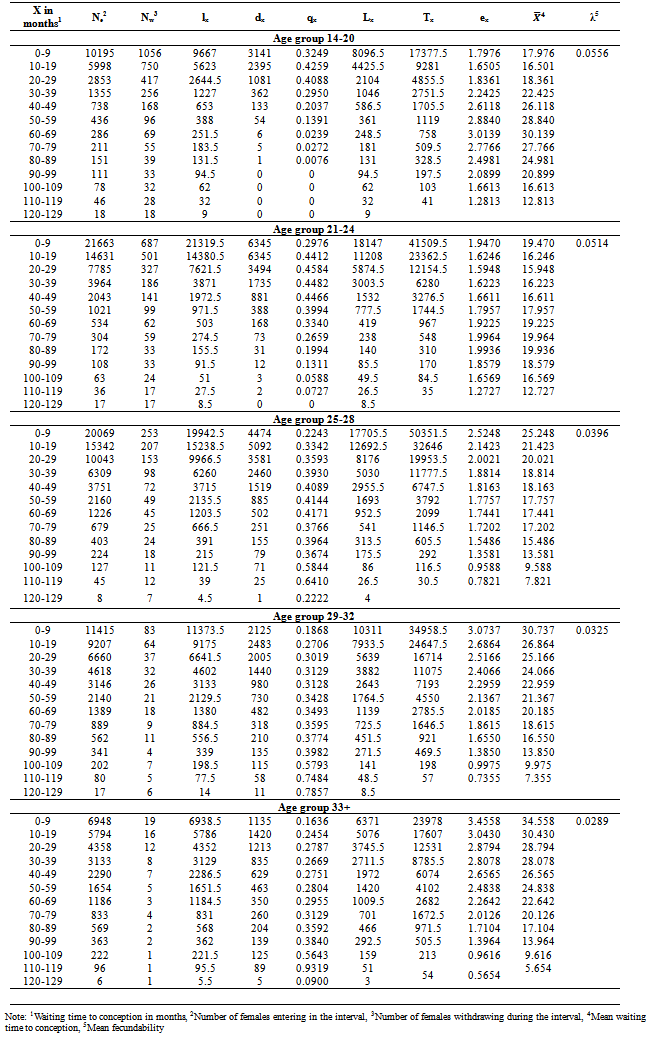
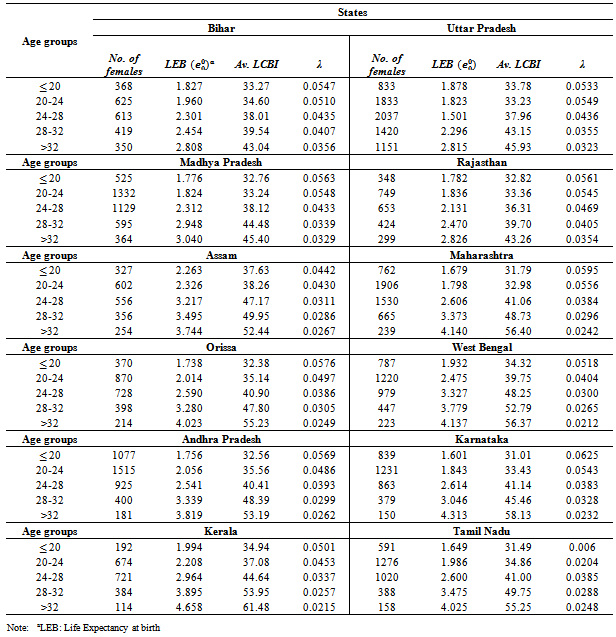
- An inverse relationship is observed between the age of the females and the mean waiting time to conception. Table 1 presents the life table estimates of mean waiting time to conception and mean fecundability of females for the specific age groups in India. In this study, the main emphasis is given on the two columns of life table viz., qx (probability of conception) and ex (expected waiting time to conception). It is observed from the table that the value of qx, probability of conception is low in the first cell i.e., when X (waiting time to conception) is 0-9 months and then its value has risen in the next cell i.e., when X is 10-19 months in all the age-groups viz., 14-20, 21-24, 25-28, 29-32, 33+. The possible reasons for observing low probability of conception when the exposure period is 0-9 months may be (i) a proportion of females is not exposed to the risk of conception due to short exposure period, they may have longer PPA duration but here duration of PPA is considered as 6 months for each female, and (ii) after having a birth, couples don’t want the next child for some time, and (iii) again, just after a birth, the socio-cultural factors also play a dominant role on the behavioural factor viz., coital frequency and without intercourse, conception is not possible. The reason of rise in the value of qx in the second cell may be that the socio-cultural norms and taboos associated with coital frequency start to decrease with the passage of time. Another reason may be that having an appropriate interval after a birth, the possibility of avoiding conception becomes less. Table 1 also shows that the probability of conception is decreasing with time in the younger age groups 14-20 and 21-24 and in the age group 14-20, it is declining more rapidly. The reason of declining probability of conception with time may be due to heterogeneity in the population. Heterogeneity has physiological sources; particularly important sources are the differences in level of intra-uterine mortality, differences in the incidence of anovulatory cycles and total cycle lengths[14]. Prolonged breastfeeding may be one plausible reason of it. Another possible reason for it may be that the females of younger age groups may be more concerned about their ideal family size although they have high fecundability. They may be practicing various contraceptive methods to prevent the next birth. In age group 25-28, the probability of conception fluctuates with time. It may be due to the heterogeneity in the population regarding the desire of next child as well as due to some unwanted pregnancies. Again in the age group 29-32 and 33+, the probability of conception increases with time. Normally, the probability of conception increases with time due to the mentioned fact that socio-cultural norms and taboos decrease with the passage of time. Table 2 presents mean last closed birth intervals and mean fecundability of the females corresponding to their age at last birth for the considered states of the country in the study. From the results, it is quite clear that the females in the age groups
 20 have the maximum fecundability. However, after this age group, there is a steady decline in the estimates of fecundability. In the age-group
  20 females are taking on an average 32 months to have a birth. The highest fecundability is observed in Karnataka whereas the lowest is observed in Assam. The variation is observed in the level of fecundability in the different states of the country whereas the trend of fecundability is observed to be similar in the different states. The level of fecundability gradually decreases with increasing age of the females. After attaining the age-group 25-28, fecundability starts to decline more rapidly specifically in the states viz., Assam (
 0.0311), Maharashtra (
 ), Orissa (
 ), West Bengal (
 ), Andhra Pradesh (
 0.0393), Karnataka (
 0.0383), Kerala (
 0.0337), Tamil Nadu (
 0.0385), as compared to the Northern states Bihar (
 0.0435), Uttar Pradesh (
 0.0436), Madhya Pradesh (
 0.0433) and Rajasthan (
 0.0436). This may be due to the variation in different socio-economic, cultural and socio-demographic characteristics among the states. The possible reason for declining fecundability with increasing age may be ascribed largely to biological factors such as foetal losses and other health related or sub fertility problems[13]. It may also be due to socio-cultural, behavioural and personal factors associated with the desire of children and the extent of these factors varies from individual to individual. Overall, it is observed that the mean fecundability is decreasing with increasing age of the females. But, from this it cannot be inferred that age is the only factor responsible for variation in fecundability. The variation in fecundability may be due to the parity of the females and it is a known fact that age and parity are highly correlated. Females of older age will have higher parity and as soon as females reach to their desired parity, they don’t want children any more. This may also be one of the reasons for observed declining fecundability with increasing age of the females. Demographers have frequently suggested that a woman’s fecundability reaches a maximum some time in her 20’s and thereafter remains at a plateau for some years. This theory is incorrect as the major cause of the decline in fecundability across ages 20-40 is a decline in coital rates and a smaller part of the decline in fecundability is caused by a rise in the risk of unrecognized spontaneous abortion. The biological capacity to conceive does not vary significantly between ages 20-40[15]. This study suggests that the variation in fecundability among the Indian females is due to the confounded effect of age and some socio-cultural factors associated with the behavioural factor. Because in the traditional society like India, as the age increases, the frequency of intercourse decreases due to various norms and taboos and the effect of these two cannot be separated.
|
|
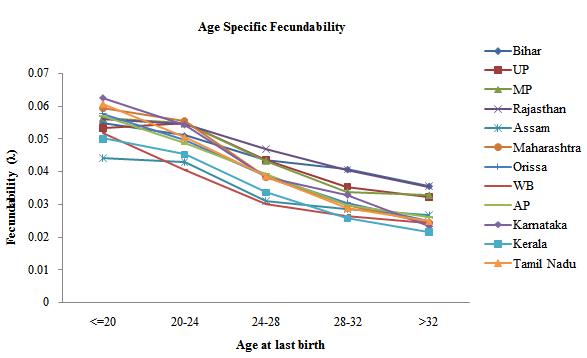 | Figure 1. shows the trend of fecundability of females in the the different considered states of the country |
ACKNOWLEDGEMENTS
- Authors are grateful to Prof. R. C. Yadava, Department of Statistics, Banaras Hindu University, Varanasi-221005 for his guidance while working on this paper. Author (S.T.) is also thankful to DST-Centre for Interdisciplinary Mathematical Sciences for providing financial assistance to carry out the research work.