-
Paper Information
- Next Paper
- Previous Paper
- Paper Submission
-
Journal Information
- About This Journal
- Editorial Board
- Current Issue
- Archive
- Author Guidelines
- Contact Us
International Journal of Statistics and Applications
p-ISSN: 2168-5193 e-ISSN: 2168-5215
2013; 3(2): 22-32
doi:10.5923/j.statistics.20130302.02
Mathematical Modelling of Colour Yield for Single Step Fixation of MCT Reactive Dye Printing and Crease Resistance Finishing of Cotton Fabric
 Abstract
 Reference
 Full-Text PDF
 Full-text HTML
Fareha Asim1, Muzzaffar Mahmood2
1Department of Textile Engineering, NED University of Engineering & Technology Karachi, Pakistan
2Department of Mechanical Engineering, NED University of Engineering & Technology Karachi, Pakistan
Correspondence to: Fareha Asim, Department of Textile Engineering, NED University of Engineering & Technology Karachi, Pakistan.
| Email: |  |
Copyright © 2012 Scientific & Academic Publishing. All Rights Reserved.
Statistical analysis and mathematical modelling can play a vital rolein understanding the factors affecting the single step fixation process of reactive printing and crease resistance finishing. The aim of this study was to model colour yield in single step fixation process of cotton fabric, as a function of hue, chroma, concentration of crease resistant and fixation temperature. The statistical analysis of the influential factors revealed the quadratic effect of each factor on the colour yield of in single step fixation process. The fitted regression equation of colour yield modelled the relationship of each factor on the in single step fixation process. The high values of coefficient of determination implied that the model effectively explained the process.
Keywords: Crease Resistance Finishing, Colour Yield, Mathematical Modelling, Regression Equation, Reactive Printing
Cite this paper: Fareha Asim, Muzzaffar Mahmood, Mathematical Modelling of Colour Yield for Single Step Fixation of MCT Reactive Dye Printing and Crease Resistance Finishing of Cotton Fabric, International Journal of Statistics and Applications, Vol. 3 No. 2, 2013, pp. 22-32. doi: 10.5923/j.statistics.20130302.02.
Article Outline
1. Introduction
- Statistical methods[1-6] are widely used in textiles to analyse and optimize the data so that results and conclusions are objective rather than judgmental in nature. Simple graphical methods play an important role in data analysis and interpretation. It is also usually very helpful to present the results of many experiments in terms of an empirical model, that is, an equation derived from the data that expresses the relationship between the response and the important design factors. Different statistical techniques[7-12] have been reviewed including ANOVA, response surface methodology and desirability function. The factors affecting the single step fixation of reactive printing and crease resistance finishing has been reviewed previously[13-16]. The four different factors namely A: hue, B & C: concentration of dye & crease resistant and D: fixation temperature are statistically analysed in this work. The proposed research work intended to develop the mathematical model of colour yield for single step fixation process of reactive printing and crease resistance finishing process. The experiments have been conducted in random order. The results were analysed using software Design Expert 8.0.
2. Experimental
2.1. Process Route
- The one step fixation of MCT reactive dye and crease resistance finishing is carried outas follows: In the first step ready to print fabric was padded with thecrease resistant finish liquor, and then squeezed to obtain a 70% wet pickup. The fabric was then dried at 100°C for 1 min. The dried fabric was printed by the lab scale Rotary Printing machine (Zimmer). The finish-print fabric was simultaneously fixed using Econtrol method at 135°C for 5 minutes. The fixed samples were finally washed with non-ionic detergent until all unreacted dyes and chemicals were removed from the fabric surface.
2.2. Evaluation of Colour Yield (K/S)
- Shade depth values were assessed and expressed in terms of the Kubelka-Munk (K/S) relationshipThe samples processed with simultaneous fixation were compared with those produced from a conventional process of reactive printing and Crease resistance finishing.
2.3. Statistical Analysis of the Data
- After processing the experimental trials, K/S values were measured using spectrophotometer.The results obtained from the different experimental sets are presented in Table 1.TheK/S values were statistically analysed. Residual analysis and model adequacy checking were performed.
2.4. Model Adequacy Checking
2.4.1. The Normality Assumption
- The normal probability plot of the residual for colour yield has been shown in from Figure 1. There is no severe indication of non-normality, nor is there any evidence pointing to possible outliers and the equality of variance assumption does not seem to be violated.
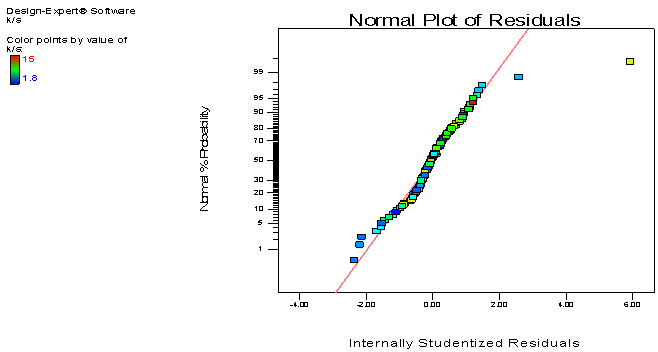 | Figure 1. Normal plot of residuals for K/S |
2.4.2. Residual Analysis
- Residual plots of colour yield have been shown from Figure 2and 3. The residuals are normally distributed and the equality of variance does not seem to be violated.
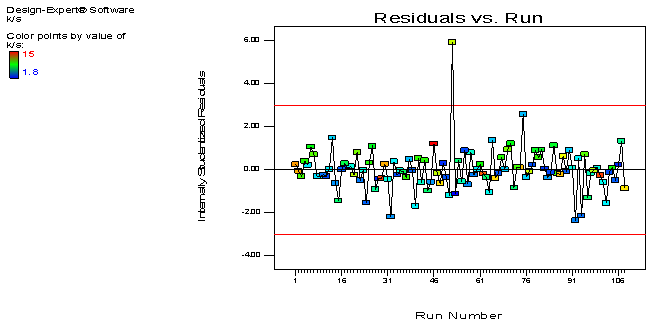 | Figure 2. Residual vs. run number for K/S |
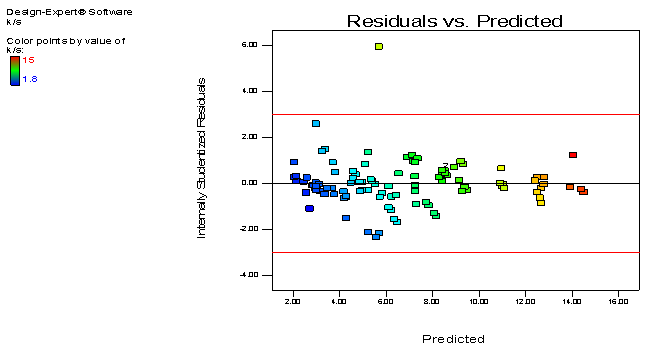 | Figure 3. Residual vs. predicted plot for K/S |
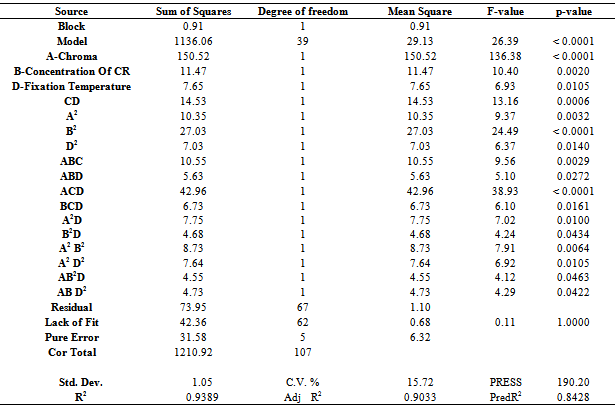
2.5. Analysis of Variances (ANOVA)
- Table 1 shows the ANOVA results of thecolour yield for single step fixation process of reactive printing and crease resistance finishing. The model p-value implied that the respective model is significant for colour yield.As can be seen in Table 1, the “lack of fit p-value” of colour yield implies that the lack of fit is not significant relative to the pure error, indicating that the suggested models are well-fitted to the observed response. The "Pred R-Squared" values of colour yieldis in reasonable agreement with the "Adj R-Squared", indicating the model is adequate.
|
|
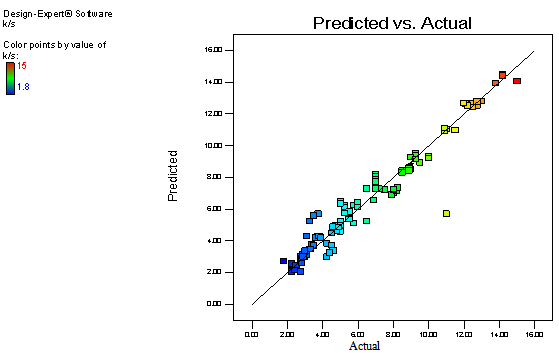 | Figure 4. The predicted vs. actual plot for K/S |
3. Results and Discussion
3.1. Analysis of Colour Yield (K/S)
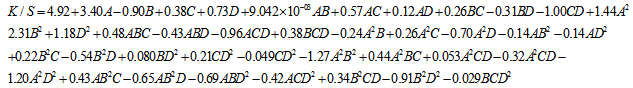
- The quartic model has been selected for the response variable K/S. The detail of ANOVA of K/S is shown in Table 1. The Model p-value less than 0.05 implies the model is significant. In this case A, B, D, CD, A2, B2, D2, ABC, ABD, ACD, BCD, A2D,B2D, A2B2, A2D2, AB2D, ABD2 are significant model terms. The "Lack of Fit p-value" of 1.000 implies the Lack of Fit is not significant relative to the pure error. The "Pred R-Squared" of 0.8428 is in reasonable agreement with the "Adj R-Squared" of 0.9033. Adequate Precision of 19.263 indicates an adequate signal. The graphs of significant model terms for K/S have been shown from Figure 5 to 16. The graphs of significant model terms clearly lillustrate that the colour yieldof the CPF process is dependent on the interaction and curvature effect of chroma, concentration of CR and fixation temperature. The interaction of fixation temperature and fixation mode (Figure 8) noticeably show that the Econtrol process of fixation at 130-135°C will be efficient for the combined fixation of reactive printing and crease resistance finishing in terms of K/S. The methamatical model of colour yield has been shown in Equation (1). However, the fitted regression equation has been presented , Equation (2).
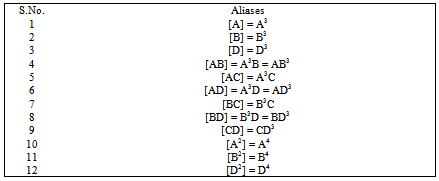
3.2. Model with Significant Variables at α = 0.05
 | (1) |
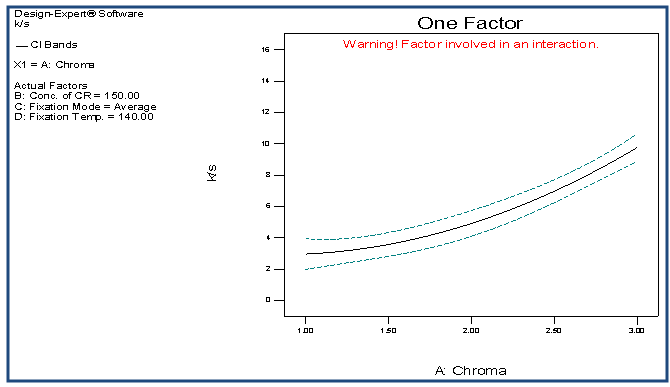 | Figure 5. Effect of A on K/S |
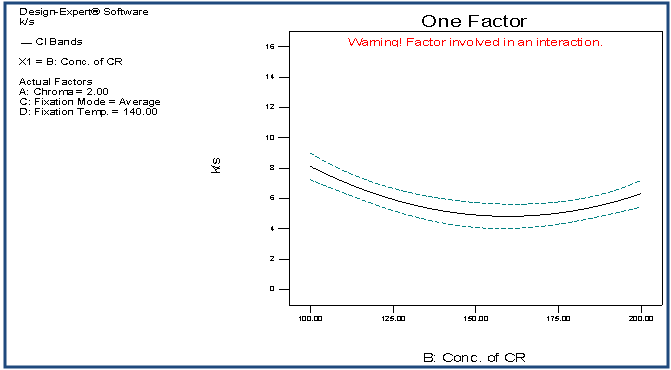 | Figure 6. Effect of B on K/S |
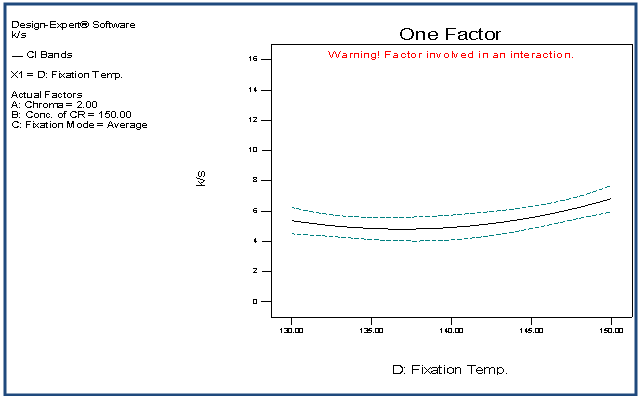 | Figure 7. Effect of D on K/S |
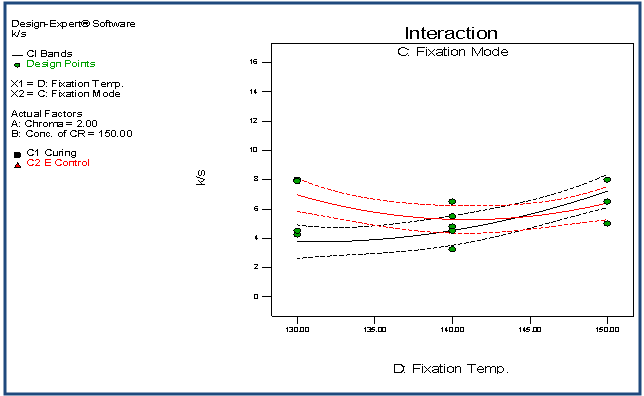 | Figure 8. Interaction plot of CD with respect to K/S |
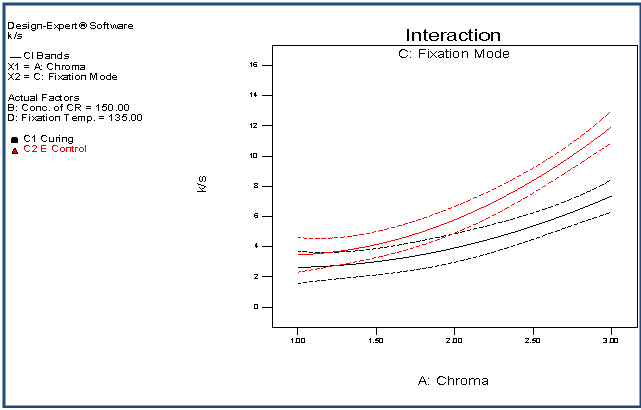 | Figure 9. Interaction plot of AC with respect to K/S |
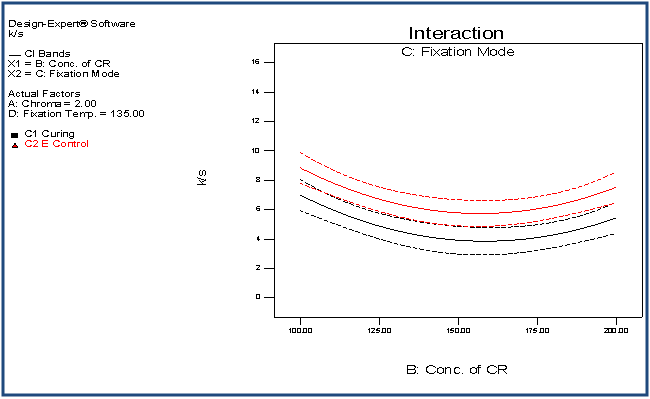 | Figure 10. Interaction plot of BC with respect to K/S |
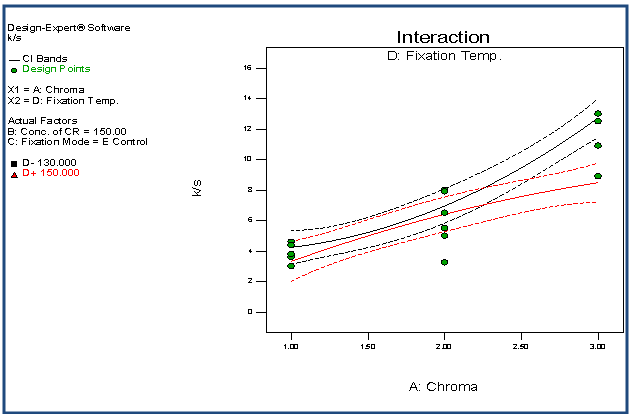 | Figure 11. Interaction plot of AD with respect to K/S |
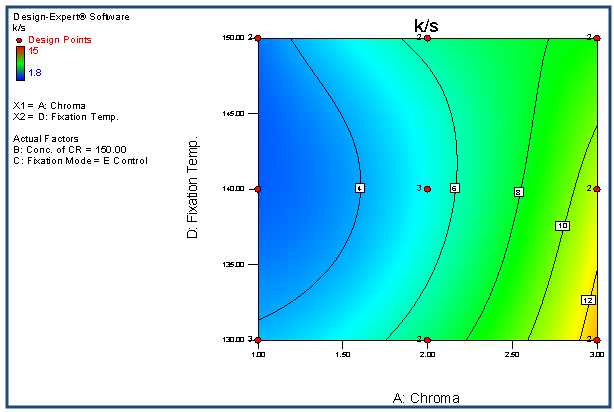 | Figure 12. Contour plot representing K/S versus chroma and fixation temperature |
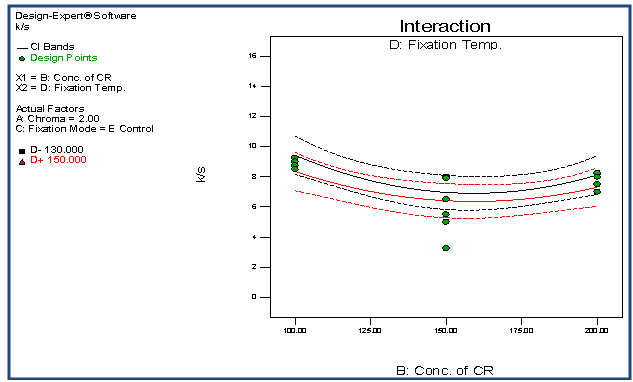 | Figure 13. Interaction plot of BD with respect to K/S |
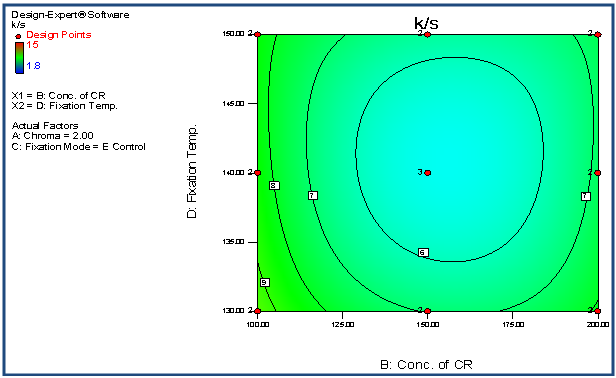 | Figure 14. Contour plot representing K/S versus concentration of CR and fixation temperature |
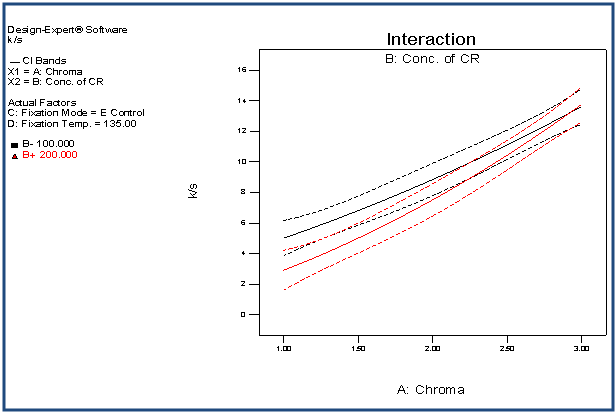 | Figure 15. Interaction plot of AB with respect to K/S |
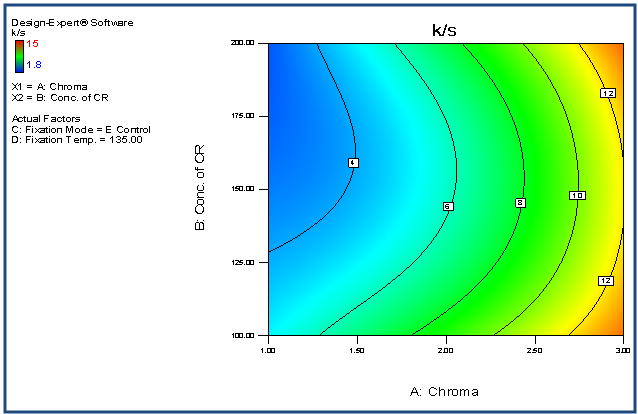 | Figure 16. Contour plot representing K/S versus chroma and concentration of CR |
3.3. Fitted Regression Equation of K/S
 | (2) |
4. Conclusions
- The statistical analysis of significant factors namely chroma, concentration of crease resistant and fixation temperature including ANOVA, residual analysis, model adequacy checking and regression analysis has been performed. Mathematical model has been developed based on the fitted values obtained. The range of optimum values of chroma, concentrations of crease resistant and fixation temperature that lead to maximum colour yield can be found from the developed mathematical model. The uncertainty analyses for measurements shows that the predicted values are in good agreement with experimental data and are sufficiently accurate.
ACKNOWLEDGEMENTS
- The authors wish to express their gratitude to Clariant Pakistan Ltd, for carrying out the necessary experimental work.