G. Y. Sagar
Associate Professor, Department of Applied Statistics, Hawassa University, Ethiopia
Correspondence to: G. Y. Sagar, Associate Professor, Department of Applied Statistics, Hawassa University, Ethiopia.
| Email: |  |
Copyright © 2012 Scientific & Academic Publishing. All Rights Reserved.
Abstract
This paper discusses the estimation of reliability measures of two unit system with identical components in the presence of chance Common Cause Shock (CCS) failures as well as human errors. The Maximum likelihood (M L) approach has been followed for the present model. The M L estimates of system reliability measures like reliability function[R(t)], mean time between failures (MTBF) were developed. The estimates were derived for both series and parallel systems. We also developed the confidence interval for the present study. The empirical evidence was developed by using Monte-Carlo simulation for selected values of the failure and repair rates to establish the validity and precision of the M L estimates of the above said reliability measures.
Keywords:
Reliability Function, MTBF, CCS Failures, Human Errors, M L Estimation, Monte-Carlo Simulation
Cite this paper:
G. Y. Sagar, "Reliability Estimation and Confidence-interval for Two-unit System in the Presence of Common Cause Failures and Human Errors", International Journal of Statistics and Applications, Vol. 2 No. 6, 2012, pp. 114-119. doi: 10.5923/j.statistics.20120206.04.
1. Introduction
Today Engineering systems are more complicated. For example, a space shuttle consists of hundreds & thousands of components. The functioning of the system is very much linked to all the components. Then performance of system depends on performance of its constituent components. Hence, in the recent years mathematical and statistical models were developed for evaluating system reliability based on constituent individual components, which constitute the system. Thus system reliability analysis & modeling was one of the interesting areas of the reliability analysis. Apart from the mathematical modeling, life testing and estimation is paramount interest in order to assess and answer some information about the average life of the product etc.From 1980 Reliability theory has identified that the events which are external causing multiple failures in the system by common causes. These were identified and defined during 1980’s and researchers used to account for them in order to consider statistical & probability modeling in reliability theory specifically in the presence of common cause shock failures (CCS) and human errors in addition to intrinsic failures. Atwood[1] used the BFR model for Common cause failures in the area of nuclear power plants. Billinton and Allan[2] stressed the role of CCS failures and discussed the need for considering them in the reliability analysis. Chari et al[3] derived the reliability measures of a two component identical system under the influence of CCS failures. Dhillon and Liu[4] defined human error as “the failure to perform a specified task (or the performance of a forbidden action), that could lead to disruption of scheduled operations or result in damage of property and equipment”. Dhillon and Rayapati[5] proposed a stochastic model for standby redundant system under the influence of human error. Ritika wason[6] studied the traditional software reliability estimation. Reddy[7] derived reliability measures in the presence of lethal and non-lethal CCS failures of a two component non-identical system. In this direction the present research investigation is undertaken to explore and find an estimation method /approach which is appropriate to evolve the estimates of reliability function, mean time between failures for given sample of data. Not much of literature on estimation of reliability indices of system is available especially when the system is under the influence of individual, common cause shock failures (CCS) and human errors.
2. Notations
λi, λc & λh: the failure rates of individual, CCS failures and human errors respectively. c1, c2 & c3: the chance of individual, CCS failures and human errors respectively.µ: service rate.  : reliability function for series system with CCS failures as well as human errors
  : M L estimate of reliability function for series system with CCS failures as well as human errors
 : reliability function for parallel system with CCS failures as well as human errors
 : M L estimate of reliability function for parallel system with CCS failures as well as human errors
 : MTBF of series system with CCS failures as well as human errors
 : M L estimate of MTBF for series system with CCS failures as well as human errors
 : MTBF of parallel system with CCS failures as well as human errors
 : M L estimate of MTBF for parallel system with CCS failures as well as human errors
 : sample means of the occurrence of individual, CCS failures and human errors respectively
 : sample mean of service time of the components
 : sample estimates of individual failure rate, CCS failure rate and human errors respectively
 : sample estimate of service time of the componentsn : sample sizeN : number of simulated samplesM S E : mean square error
3. Assumptions
(i) The system consists of two s-independent and identical components(ii) The components in the system may fail individually or Common cause shocks or human errors or occurrence of all these failures simultaneously. The chances of individual, CCS failures and human errors are c1, c2 & c3 respectively s.t. c1 + c2 + c3 = 1.(iii) The times between failures in the case of individual, CCS failures and human errors follow exponential distribution. (iv) The components are serviced singly and service times follow exponential distribution.
4. The Model
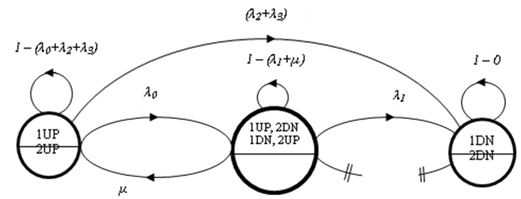 | Figure 1. Markov graph for two-component system with CCS failures as well as human errors |
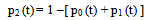
Under the above assumptions, we formulate a Markov model to obtain the reliability function (R(t)) and MTBF of the system under the influence of CCS failures as well as human errors in addition to individual failures. Under the assumptions stated, the Markov graph for reliability analysis is seen in Fig. 1. The quantities appeared in Fig.1 are defined as The differential equations associated with the system states are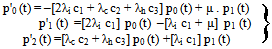 | (1) |
Using the Laplace transformation technique, the set of equations (1) can be solved with the help of the initial conditions, given at t = 0, p0 (t) = 1, p1 (t) = p2 (t) = 0 and the solution is  | (2) |
 | (3) |
 | (4) |
Where | (5) |
5. M L Estimation of the System Reliability and MTBF
This section discusses the Maximum likelihood estimation approach for estimating the reliability measures of two component identical series and parallel systems in the presence of individual, CCS failures as well as human errors.Let  be a sample of ‘n’ number of times between individual failures which will obey exponential law.Let
  be a sample of ‘n’ number of times between CCS failures which follow exponential as well.Let
  be a sample of ‘n’ number of times between human errors which follow exponential as well.Let
  be a sample of ‘n’ number of times repair of the components with exponential population law.
 are the maximum likelihood estimates of individual failure rate (λi), CCS failure rate (λc), human errors rate (λh) and repair rate ‘µ’ of the system respectively.Where,
 are the sample estimates of the rate of individual failure times, rate of CCS failure times, rate of human error times and rate of repair times of the components respectively.
5.1. Estimation of Reliability Function
The Maximum likelihood estimates of reliability function for series and parallel systems are obtained in this section.
5.1.1. Series System
If the two component identical system under consideration is a series one, then the states ‘1’ and ‘2’ are considered to be dead states and hence transition from state ‘1’ and state ‘2’ to state ‘0’ do not exist (i.e. μ=0). Therefore, the reliability of the series system for CCS failures as well as human errors would be  | (6) |
By substituting γ1 and γ2 as seen in (5) and putting μ = 0 in the model and transitions from state ‘1’ to state ‘2’ and from state ‘1’ to state ‘0’ are zero, the reliability expression becomes  | (7) |
Thus, the reliability function of the two component identical series system operated under individual, CCS failures as well as human errors is seen as a function of λi, λc, λh with c1, c2, c3. The Rchs (t) obtained in (7) for this model agrees with the expression already arrived[8] under the influence of individual failures case, common cause shock failures as well as human errors.Therefore, the maximum likelihood estimation of the reliability function for series system is given by 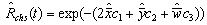 | (8) |
Where  are the samples estimates given in “section 5”.
5.1.2. Parallel System
In the case of parallel configuration, the reliability function is obtained by considering the probability of successful states, i.e either ‘0’ (or) ‘1’ ( seen in Fig. 1) because in either of these states the system is said to be in trouble free operation in the interval (0, t). Thus, the reliability of the redundant system is given by Rchp (t) = p0 (t) + p1 (t)The reliability expression for two-component identical system in the presence of CCS failures as well as human errors in the case of parallel configuration is derived by summing p0 (t) and p1 (t) which are given in (2) and (3) respectively. | (9) |
The reliability expression given in (9) agrees with the result already developed by Sagar[8]. Therefore, the maximum likelihood estimate of the reliability function for parallel system is given by 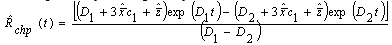 | (10) |
Where, Where
Where  are the samples estimates given in “section 5”.
5.2. Estimation of MTBF function
The Maximum likelihood estimates of mean time between failure function for series and parallel systems are obtained in this section.
5.2.1. Series System
The mean time between failure function for series system is obtain asThe above expression given in (11) agrees with the result already developed by Sagar[8]. Therefore, the maximum likelihood estimate of mean time between failures function for series system is given by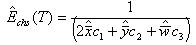 | (12) |
Where  are samples estimates given in “section 5”.
5.2.2. Parallel System
The mean time between failure function for parallel system is obtained as  | (13) |
The above expression given in (13) agrees with the result already developed by Sagar[8]. Therefore, the maximum likelihood estimate of mean time between failure function for parallel system is given by 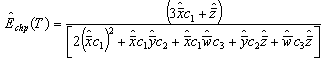 | (14) |
Where  are the samples estimates given in “section 5”.
5.3. Confidence Interval
Obviously, the above estimates are functions of  which are differentiable. Now from multivariate central limit theorem Where = (ij)33 co-variance matrix = dig ( i2 , c2 , h2 2 ) Also we haven[ R(t) –
 (t) ] N(0,2) as n and is the vector
 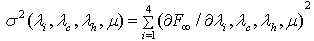 By the properties of M L method of estimation
  (t) is CAN estimate of R ( t ) respectively. Also 2 (
 ) be the estimator of 2() Where (
 ) =
) =  Let us consider
  from Slutsky theorem, we haveP[-Z/2 Z/2] =1- Where Z/2 are the /2 percentiles points of normal distribution and are available from normal tables. Hence (1- )% confidence interval for Rs(t), Rp(t) are given byRchs (t) Z/2 2(Rchs(t) ) / nRchp(t) Z/2 2(Rchp(t)) / n
6. Monte-Carlo Simulation
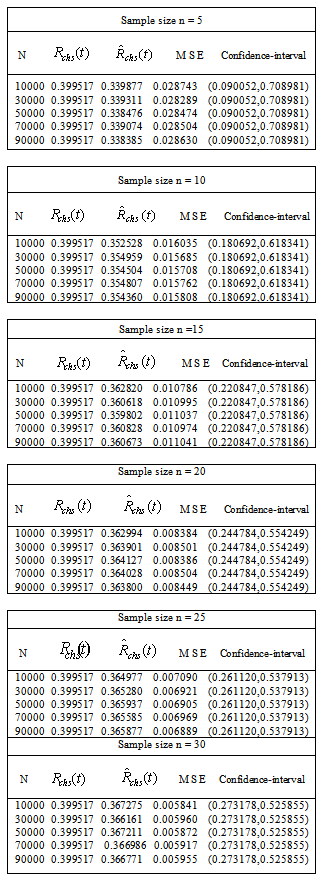
Having proposed maximum likelihood estimates of Reliability function[R(t)], Mean time between failure (MTBF) measures of two component identical systems, in the sections 5.1 & 5.2 the exact probability density function of these estimates are not known and not much literature is seen in this direction. Hence in the present work an attempt is made to develop empirical evidence of M L Estimation approach by Monte Carlo simulation procedure for validity of results. For a range of specified values of the rates of individual (i), common cause failures(c), human error (λh) and service rates () and for the samples of sizes n = 5 ( 5 ) 30 are using computer package developed in this paper. M L Estimates are computed for N = 10,000 (20,000) 90,000 and mean square error (MSE) and confidence interval of the estimates were obtained and given in numerical illustration. For large samples Maximum Likelihood estimators are undisputedly better since they are CAN estimators. However it is interesting to note that for a sample size as low as five i.e (n=5) M L estimate is still seem to be reasonably good giving near accurate estimate in this case.
6.1. Numerical Illustration
Table 1. Reliability function for two component identical Series System with i = 0.9; c = 0.05; h = 0.02; p1 = 0.5; p2 = 0.25; p3 = 0.25; t = 1
 |
| |
|
Table 2. Reliability function for two component identical Parallel System with i = 0.002; c = 0.02; h = 0.01; µ= 0.02; c1 = 0.5; c2 = 0.25; c3 = 0.25; t = 1
 |
| |
|
7. Conclusions
The M L estimates of reliability measures like reliability function[R(t)] and MTBF[E(T)] for both series and parallel systems of the present model were obtained. The empirical evidence was developed by using Monte-Carlo Simulation for selected values of the failure and repair rates to establish the validity and precision of the M L estimates of the above said reliability measures. From the simulation results we observed that the point estimates become more accurate when the sample size is large and each of MSE decreases with increasing the sample size. Therefore, the present research work suggests that the use of Maximum likelihood estimation approach is found satisfactory for estimation process of some important reliability measures of the system performance, since estimation gives a very close estimate of the above measures even in the case of very small samples of size n=5.
References
| [1] | Atwood, C.L. (1986), The binomial failure rate common cause model in Technometrics, vol: 28, pp. 139-147. |
| [2] | Billinton, R & Allan, R. N (1983) “Reliability Evaluation of Engineering Systems; Concepts and Techniques”, Plenum Press, New York. |
| [3] | Chari, A. A., Sastry, M. P and Madhusudhana Verma, S. (1991), “Reliability analysis in the presence of common cause shock failures”, Micro-Electronics and reliability, 31, pp. 15-19. |
| [4] | Dhillon, B. S. And Liu, Y. (2006), “Human error in maintenance: a review”, Journal of Quality in Maintenance Engineering, Vol. 12, No. 1, pp. 21-36. |
| [5] | Dhillon, B. S. and Rayapati, S. N. (1988a), “Human error and common cause failure modeling of standby systems”, Maintenance Management International, Vol. 7, No. 2, pp. 93-110. |
| [6] | Ritika Wason, Ahmed. P and Qasim Rafiq, M. (2012), “New paradigm for software reliability estimation”, International journal of computer application, vol. 44, No. 14, pp. 39-44. |
| [7] | Reddy, Y. R. (2003), “Reliability analysis for two unit non-identical system with CCS failures”, Ph.D thesis, S.K.University, Anantapur. |
| [8] | Sagar, G. Y. (2007) “Markovian approach to system reliability measures with common cause shock failures and human errors”, Ph. D theis, S. K. University, Anantapur. |
 Abstract
 Reference
 Full-Text PDF
 Full-Text HTML