-
Paper Information
- Next Paper
- Previous Paper
- Paper Submission
-
Journal Information
- About This Journal
- Editorial Board
- Current Issue
- Archive
- Author Guidelines
- Contact Us
International Journal of Statistics and Applications
p-ISSN: 2168-5193 e-ISSN: 2168-5215
2012; 2(6): 108-113
doi: 10.5923/j.statistics.20120206.03
Bayesian Sequential Estimation of Proportion of Orthopaedic Surgery Among Different Age Groups: A Case Study of National Orthopaedic Hospital, Igbobi-Nigeria
 Abstract
 Reference
 Full-Text PDF
 Full-Text HTML
Rotimi K. Ogundeji1, Ademola J. Adewara2, Tajudeen S. Nurudeen3
1Department of Mathematics, Faculty of Science, University of Lagos, Lagos, Nigeria
2Distance Learning Institute, University of Lagos, Lagos, Nigeria
3Department of Mathematics, Lagos State Polytechnic, Ikorodu, Lagos, Nigeria
Correspondence to: Ademola J. Adewara, Distance Learning Institute, University of Lagos, Lagos, Nigeria.
| Email: |  |
Copyright © 2012 Scientific & Academic Publishing. All Rights Reserved.
Bayesian methods provide more intuitive and meaningful inferences than likelihood-only based inferences. This is simply because Bayesian approach includes prior information as well as likelihood. In empirical Bayes (EB) methodology, we use data to help determine the prior through estimation of the so-called hyperparameters. In this paper, a Bayesian model called Beta-binomial conjugate model is employed using Bayesian sequential estimation method to estimate the proportion of different age groups attended to at the National Orthopaedic hospital, Igbobi, Nigeria. Over the years results show that the highest number of patients at the hospital is within the age group 15 to 44 years but with the smallest proportion of orthopaedic surgeries. Similarly, smallest the numbers of patients are among the age group less than one year and greater than 64 years but with highest proportion of orthopaedic surgeries. Also, overall EB proportion of patients admitted for orthopaedic surgeries in the hospital across the age groups increased steadily. Finally, the results of the comparative analysis of the sample and EB proportions show that the EB estimators are better estimators on the basis of efficiency and consistency.
Keywords: Empirical Bayes, Beta-binomial model, Hyperparameters, Population Proportion, National Orthopaedic Hospital, Igbobi-Nigeria
Cite this paper: Rotimi K. Ogundeji, Ademola J. Adewara, Tajudeen S. Nurudeen, "Bayesian Sequential Estimation of Proportion of Orthopaedic Surgery Among Different Age Groups: A Case Study of National Orthopaedic Hospital, Igbobi-Nigeria", International Journal of Statistics and Applications, Vol. 2 No. 6, 2012, pp. 108-113. doi: 10.5923/j.statistics.20120206.03.
Article Outline
1. Introduction
- The considerable impact of Empirical Bayes (EB) on statistical applications continues to receive increasing popularity since its introduction about four decades ago. The EB structure combines information from several but similar sources. The primary interest in EB analysis is in the hyperparameters (
 ) rather than the parameters from individual studies (
 ). More generally, the hierarchical structure allows for assessment of heterogeneity both within and between groups [1]. Thus Bayesian approach to parameter estimation, when conditions of data allow, is to estimate the posterior distribution of the parameter(s) in question (
 ) so that inference on
  is then based on the posterior distribution. A prior distribution for
  is needed to derive the posterior and, in some cases, the prior may have its own parameters, called hyperparameter(s) (
 ). Quite often,
  is unknown to the analyst, in which case the prior is not completely specified. One way of resolving this problem is through empirical Bayes (EB) analysis. More importantly, EB can lead to more precise estimates than sampling theory approaches [2]. EB analysis also provides a more dependable ranking of parameters and aids in the identification of extreme values in the group[3]. These properties of EB derive from the fact that it uses related supplementary data which frequentist inference ignores; (for more on this see[4]. The EB concept was first proposed by[5] in a non-parametric setting. Some notable works in this regard include[6],[7],[8],[9],[10],[11],[12],[13],[14] and[4]. More recent works and applications include [15],[16],[17],[18],[19], and[20], and[21]. The national orthopedic hospital, Igbobi, Nigeria; was specifically commissioned to provide professional orthopaedic surgeries among health institutions in Nigeria. By orthopaedic surgeries or services, the study refers to the branch of surgery concerned with conditions involving the musculoskeletal system (i.e. the body's bones (the skeleton, muscles, cartilage, tendons, ligaments, joints, and other connective tissue that supports and binds tissues and organs together). This study identifies other category of treatments or services rendered by the orthopaedic hospital as non-orthopaedic (e.g. minor injuries resulting from motor vehicle and motorcycle accidents, domestic and industrial accidents, gunshots, sport injury e.t.c.) because such cases can be easily handled by the general hospitals. In an attempt to determine the proportion of orthopaedic cases handled by the hospital especially among different age group, we employed a Bayesian model called Beta-binomial conjugate model using Bayesian sequential estimation method. From the hospital record, data were collected and collated over a period of three years (2009, 2010 and 2011). The study also compares the computed sample and EB estimates over the three year period and also the variances of the computed estimates.The remainder of the paper is organized as follows: Bayesian Sequential methodology is described in section 2. Beta- Binomial model is presented in section 3. Section 4 presents the results of the application of Beta- Binomial model and Bayesian Sequential method along with comparative analyses of results. Section 5 concludes the paper.
2. The Bayesian Sequential Methodology
- If a set of observations x1 , x2 , x3 , . . . , xn generates a posterior distribution and, in a similar situation, additional data are collected beyond these observations, then the posterior distribution found with earlier observations becomes the new prior distribution and the additional observations give a new posterior distribution and inference can be made from the second posterior distribution. This procedure can continue with even more observations. In other words, the second posterior becomes the new prior, and the next set of observations give the next posterior from which the inference can be made [22]. This is the principle of Bayesian sequential methodology that we applied to estimate the proportion of counted data obtained from the hospital.Based on the Bayesian approach described above, data were collected monthly and collated yearly for three years (2009, 2010 & 2012) from the hospital records. The population proportion of patients admitted for orthopaedic surgery is denoted by Po while the proportion of patients admitted for orthopaedic surgery in age group j is Pj (j = 1, 2, . . ., 5). Xij represents a random outcome of patient i examined in age group j.

 = the total number of patients admitted for orthopaedic surgery in age group j in year k. njk = the total number of patients admitted for treatments (both orthopaedic and non-orthopaedic surgeries) in the hospital in age group j in year k.
 = the proportion of patients admitted for orthopaedic surgery in age group j and year k.For each year in each age group, we computed sample proportions Pjk as follows:In 2009 and age group j:
  In 2010 and age group j:
  In 2011 and age group j:
  Estimators of sample proportions:
  and
and  .
. 3. The Beta-Binomial Model
- The EB model to be applied is a conjugate beta-binomial model where the binomial distribution represents the likelihood of the observed data likelihood and the beta distribution serves as the prior distribution of the binomial parameter. The posterior mean is
 | (1) |
 The posterior distribution of which is
  . Under the general Bayesian framework and using the beta conjugate prior plus the binomial likelihood, the posterior distribution of
  is:
is: | (2) |
 and using moment estimation[16]. Letting
  ;
;  and using the prior distribution of
 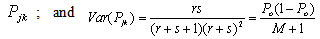 . These are known as prior mean and variance respectively. Consequently,
 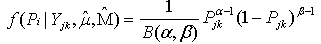 | (3) |
 ;
; ,
, and
and where
where  .With
.With  and
and  estimated, then;
 | (4) |
 | (5) |
 and it can be readily seen that where
  (the scale factor) is large relative to
  ,
,  is large and
  receives a larger weight than
  . But large
  implies small prior variance. Thus, the estimate which is associated with smaller variance receives larger weight in determining the posterior mean
  . On the other hand, if
  is small relative to
  , the sample mean receives more weight. Note that the posterior density for the overall age group proportion
  is obtained by replacing
  and
and  in equation (3) with Y and N, respectively.Under conjugacy, the EB estimator of a proportion
  is a weighted mean of two estimators, the mean of the prior density
  and the sample proportion estimator
  . Thus,
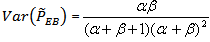
 | (6) |
 is the empirical Bayes Estimators with
  as the shrinkage factor.
  is a function of the prior and sample estimator variances such that, if variance of sample estimator is large, the weight of
  (i.e.
(i.e.  ) will be large and
  will shrink towards
 . Two components of the above model
  and
and  are derived from the EB process,[14].
4. Results
- The results of the application of Beta-Binomial model and Bayesian sequential methods to the data of different age group patients for the three years (2009, 2010 and 2011) observations are presented in Table 1 & 2 below. The hyperparameters
 and
and  are estimated using sample information. These were subsequently used to determine the parameters of the posterior distributions
  and
and thereby completely specifying them. In our analyses, we compare on yearly basis estimated sample proportions and EB proportions as well as variances of estimated sample proportions and EB proportions.
| |||||||||||||||||||||||||||||||||||||||||||||||||||||||||||
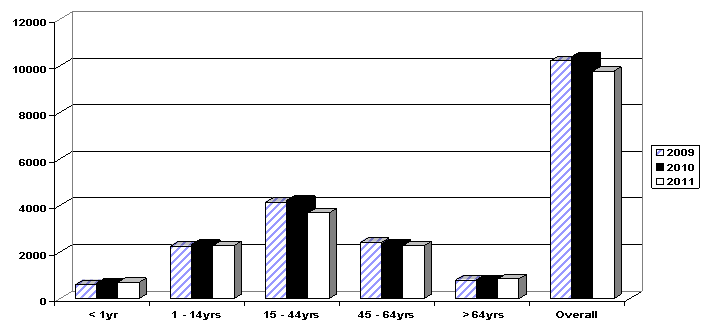 | Figure 1. Comparative number of Patiens at the Hospital across the different age groups |
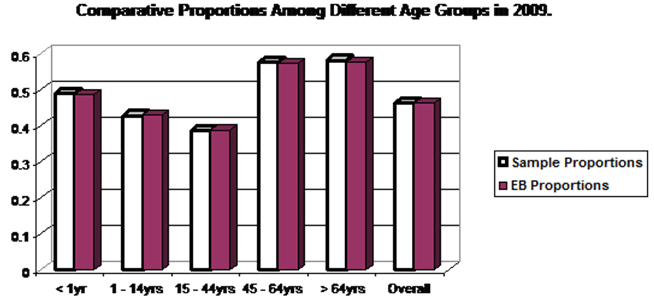 | Figure 2. Comparative Proportions Amomg different age groups in 2009 |
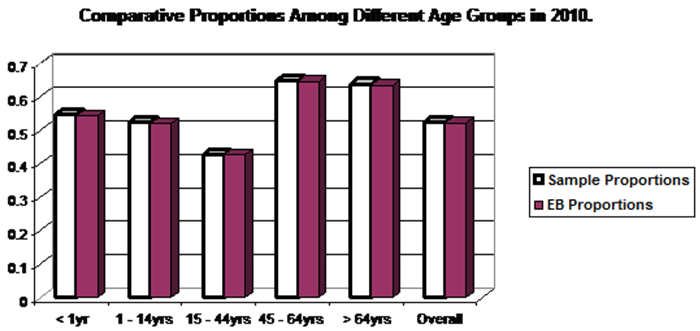 | Figure 3. Comparative Proportions Amomg different age groups in 2010 |
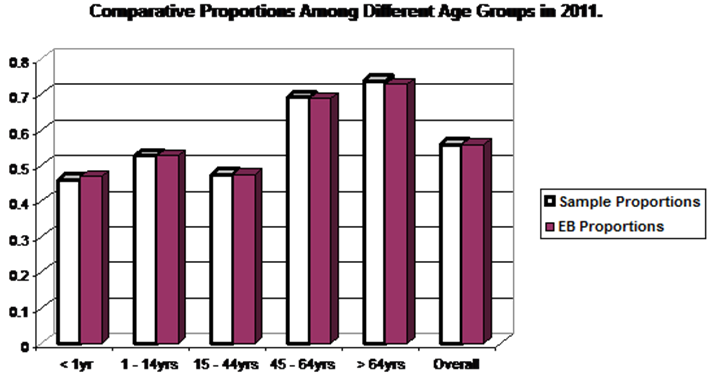 | Figure 4. Comparative Proportions Amomg different age groups in 2011 |
5. Conclusions
- This paper has been able to show how Bayesian sequential estimation of proportion can be applied to statistical process control for different ages of the patients and years. The result of the analysis was compared both of yearly estimated sample proportions and EB proportions plus the variances. It was found that overall EB proportion of patients admitted for orthopaedic surgeries in the hospital across the age groups increased steadily. Similarly, the overall variances of the proportions tend more to zero over the three years under review. Thus, the results show that the EB estimators are better estimators on the basis of efficiency and consistency properties of good estimators.
References
| [1] | Carlin, B. P. and Louis, T. A. (2000a), “Empirical Bayes: Past, Present and Future”, Journal of the American Statistical Association, Vol. 95, No. 452, pp. 1286-1289. |
| [2] | Rubin, D. (1980), “Using empirical Bayes techniques in the law school validity studies”, Journal of the American Statistical Association, 75, pp. 801-816. |
| [3] | Link, W. A. and Hahn, D. C. (1996), “Empirical Bayes Estimation of Proportions with Application to Cowbird Parasitism Rates”, Journal of Ecological Society of America, 77(8), pp. 2528-2537. |
| [4] | Okafor, R. (1999), “Using an Empirical Bayes Model to estimate currency exchange rate”, Journal of Applied Statistics, Vol. 26, No. 8, 973-983. |
| [5] | Robbins, H. (1955), “An empirical Bayes approach to Statistics”, Proceedings of the Third Berkeley Symposium on Mathematical Statistics and Probability, Vol. 1. |
| [6] | Deely, J. and Lindley, V. (1981), “Bayes empirical Bayes”, Journal of the American Statistical Association, 76, pp. 833-841. |
| [7] | Hui, S. and Berger, J. (1983), “Empirical Bayes estimation of rates in longitudinal studies”, Journal of the American Statistical Association, 78, pp. 753-760. |
| [8] | Morris, C. (1983), “Parametric empirical Bayes inference: Theory and applications”, Journal of the American Statistical Association, Vol. 78, pp. 47-65. |
| [9] | Wong, G. (1987), “Bayesian models for directed graphs”, Journal of the American Statistical Association, 82, pp. 140-148. |
| [10] | Smith, P. J. (1991), “Bayesian analyses for a multiple capture-recapture model”, Biometrika 78, pp. 399-407. |
| [11] | Raghunathan, T. E. (1993), “A Quasi-Empirical Bayes methods for Small Area Estimation”, Journal of the American Statistical Association, 88, pp. 1444-1448. |
| [12] | Altman, N. S. and Casella, G. (1995), “Nonparametric Empirical Bayes Growth Curve Analysis”, Journal of the American Statistical Association, Vol. 90, pp. 508-515. |
| [13] | Efron, B. (1996), “Empirical Bayes Methods for Combining Likelihoods (with discussion)”, Journal of the American Statistical Association, Vol. 91, pp. 538-565. |
| [14] | Carlin, B. P. and Louis, T. A. (2000b), Bayes and Empirical Bayes Methods for Data Analysis, Boca Raton, Florida: Chapman and Hall/CRC Press. |
| [15] | Natarajan, R. and Kass, R. E. (2000), “Reference Bayesian methods for Generalized Linear mixed models”, Journal of the American Statistical Association, 95, pp. 227-237. |
| [16] | Brandel, J. (2004), Empirical Bayes Methods for missing data analysis, Department of Mathematics Uppsala University, Project Report. |
| [17] | Theobald and Wuttke (2006), “Empirical Bayes hierarchical models for regularizing maximum likelihood estimation in the matrix Gaussian Procrustes problem”, The National Academy of Sciences of the USA, vol. 103 no. 49, pp. 18521-18527. |
| [18] | Ogundeji, R. K. and Okafor, R. O. (2010), “Empirical Bayes Approach to Estimate Mean CGPA of University Graduates”, International Journal of Applied Mathematics & Statistics Vol. 17; No. J10; pp. 77-89. |
| [19] | Okafor R.O., Opara A.I., Ogundeji R.K., Mbata U.A., and Olalude G. A. (2010), “Empirical Bayes Model for Inference on Vehicular Traffic Density at the Main Campus of University of Lagos, Lagos, Nigeria”, International Journal of Statistics and Systems, Vol. 5 No. 1, pp. 53–62. |
| [20] | Okafor R.O and Mbata U.A. (2011), “ A Bayesian Model for Estimation of Population Proportions”, Section on Bayesian Statistical Science – Joint Statistical Meeting 2011, USA. |
| [21] | Hogg R.V., Mckean J.W. and Craig A.T. (2001), Introduction to Mathematical Statistics, Pearson Prentice Hal, New Jersey 07458. |
| [22] | Lee, P. (2004), Bayesian Statistics An Introduction, Hodder Arnold, New York. |