Md Diah J., Ahmad J., Mukri M.
Faculty of Civil Engineering, Universiti Teknologi MARA (UiTM), Shah Alam, 40450, Malaysia
Correspondence to: Md Diah J., Faculty of Civil Engineering, Universiti Teknologi MARA (UiTM), Shah Alam, 40450, Malaysia.
| Email: |  |
Copyright © 2012 Scientific & Academic Publishing. All Rights Reserved.
Abstract
Generally, the main idea of this paper is attempt to give some idea for the researchers with different fields who want to make their own model based on the multiple regression of data transformation model. There is always being problems for researchers who want to perform their significant statistic analysis with different type of model equation (e.g. by using exponential, square root and etc.). Consequently, by following the steps of statistical methodology that given in this paper, the researcher should be able to create the calibration and validation model for their research purposed. Hence, the model developed can be use with sensitivity analysis with the appropriate variables that had been selected. Finally the chart, concept or theory can be further developed based on final multiple regression of data transformation model.
Keywords:
Multiple regression; Data transformation; Calibration; Validation and Sensitivity analysis
Cite this paper:
Md Diah J., Ahmad J., Mukri M., "The Methodology on Statistical Analysis of Data Transformation for Model Development", International Journal of Statistics and Applications, Vol. 2 No. 6, 2012, pp. 94-100. doi: 10.5923/j.statistics.20120206.01.
1. Introduction
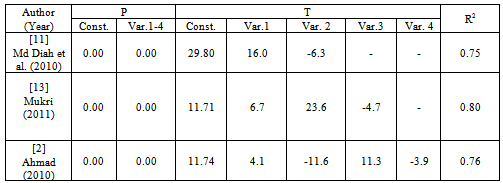
Data transformation has been used in a variety of fields (e.g. in traffic, pavement and geological engineering). Basically, the analysis of linear regression is always used in develop the model such as[1],[3] and[5]. However, researchers such as[11],[13],[2],[4],[7] and[14] had used the method of multiple regression of data transformation in their application for mathematical modification to the values of a variable. The specific scientific questions of why that the data transformation is used had been raised regarding with the difficulties of develop model using others method (e.g. linear regression) where the calibration and validation of the model is not successful. As such, this research adopted the method used by[14] in data transformation to the values of a variable but with slight modification in its application to estimate the result from the researcher’s studies with different fields (i.e. develop weaving section flow model of conventional roundabout). From[14] studies, the basic theory and issues surrounding the use of data transformation is explained thoroughly including the application such as square root, log and inverse transformation. Hence, the analytical results, multiple regression of data transformation analysis were used to initiate the new model development from various types of data. The basic research method on how the process of data transformation step by step is presented in following section.
2. Process of Data Transformation
The statistical analysis process using MiniTab, is explained in Figure 1 as follows;Generally, this study had found and elaborated that there are eight steps in order to develop new model which based on multiple regression of data transformation. Step 1: Retrieve the data from fieldwork (either from primary or secondary data source). For this study, the fieldwork data obtained (i.e. from many sources which are retrieved by laboratory data from video capture technique, geographical information systems (GIS) and questionnaire). Step 2: At this stage, after the data reduction was made, the outliers of data reduction need to be checked thoroughly in MiniTab. Basically there are many ways to check the outlier whether by graph of Histogram, Boxplot or Stem and Leaf (see Figure 2). Normally the outliers occur when there exist device or human errors during process of step 1.Step 3: The outliers only can be omit, when there have strong reason to do such as not following the standards guideline or etc. After there are no outliers, the data need to be defined through descriptive statistic (see Figure 3) in order to define its mean, median, maximum and etc. It is important to know the limitation of the minimum and maximum for each data variables. Basically, the range of data variables can be determined from traffic theory, studies from previous researchers or in technical guideline. Otherwise, the data reduction from fieldwork data collection needs to be screened thoroughly in order to know exact range of each data variables.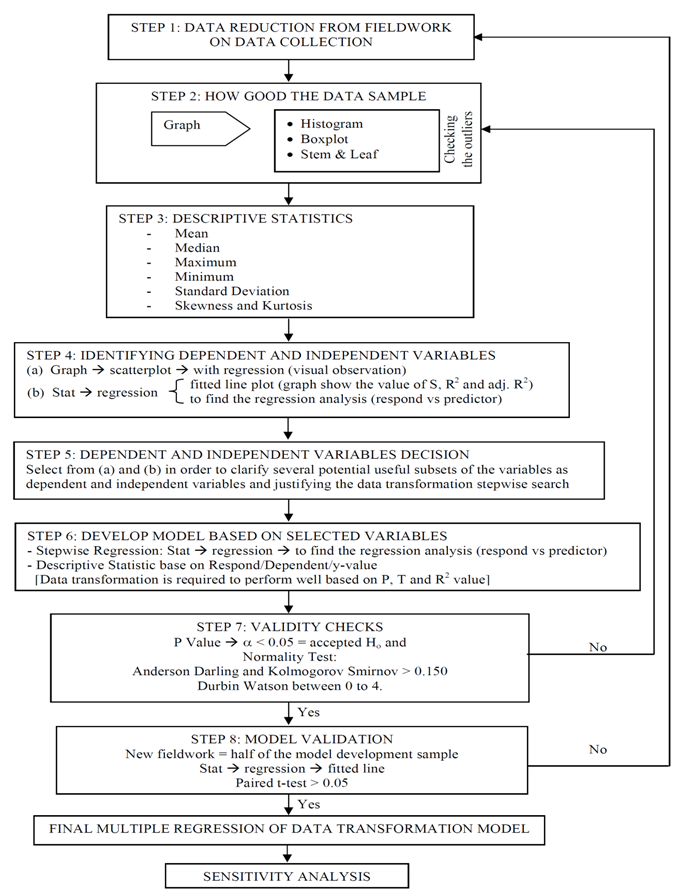 | Figure 1. Statistical Methodology |
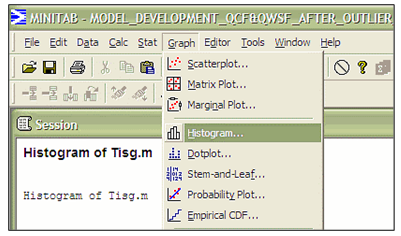 | Figure 2. Checking the outliers |
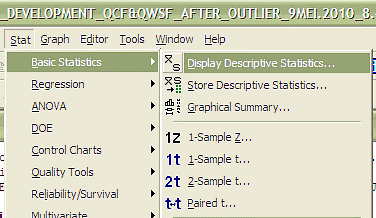 | Figure 3. Checking Descriptive Statistic |
Step 4: In this stage needs to identify which variables are dependent or independent. Normally, the scatter plot or fitted line plot can be used to determine the dependent or independent variables (see Figure 4 and 5). The dependent and independent variables are normally determined based on visual observation or the value of standard deviation S and coefficient of determination R2. The decision for dependent and independent are made for the purpose of research studies. Correlation is a statistical tool used to describe the degree to which one variable in a linear relation to another variable[10].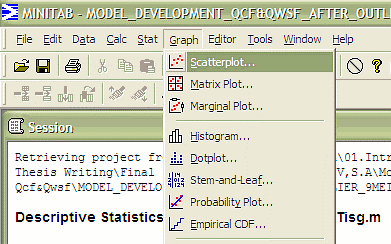 | Figure 4. Checking dependent or independent variables based on scatter plot |
Step 5: Next, the decision on the significant relationship of each parameters with the data reduction are identified through scatter plot and regression analysis process. In determining the dependent and independent variables, the multiple regression of data transformation is applied in order to make it easier to be visualized and to improve interpretability. The standard error value is equal to the coefficient of the unit. Value relative to the standard error of this coefficient is very important to identify the reliability of the statistic analysis[6].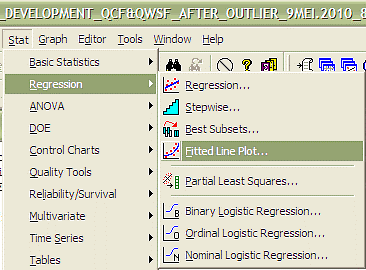 | Figure 5. Checking dependent or independent variables based on fitted line plot |
Step 6: After the final selected dependent and independent variable had been decided, in order to perform the multiple regression of data transformation model (see Figure 6), the data transformation is required to perform well based on P, T and R2 value. Step 7: There are two types of validity that need to be checked, which are model development and model validation. At this stage, after the multiple regression of data transformation model had been made, then the model needs to be calibrated and analyzed to make sure that the model development for weaving section flow at roundabout is valid. In model development, this validity can be checked well through normality test: if P value less than 0.05 (means accept Ho), Anderson Darling and Kolmogorov Smirnov test > 0.150 and Durbin Watson test value in the range 0 to 4 (see Figure 7). If one of test is not valid, the model needs to be re-checked again through from Step 2. | Figure 6. Develop Model based on Selected Variables |
 | Figure 7. Validity Checks for Develop Model |
 | Figure 8. Model Validation with other New Fieldwork |
Step 8: In this stage, the model needs to be validated with other new fieldwork data. Normally the minimum data is half of the model development sample[16]. The comparison result of new fieldwork data needs to be in similarity with model development data through t-paired test. The t-paired test is thus, an indicator for this model validation where the value should be more than 0.05 (see Figure 8). If the value is less than 0.05, then the data need to be re-checked again in Step1 especially the range of minimum and maximum value should not be less or more than model development value. That is why many model equations had their limitation or range values based on their fieldwork conditions. Finally, after all steps had been accepted, the Final Multiple Regression of Data Transformation Model can become as successful model. In this study, model validation was performed by comparing the developed model output with new fieldwork data.[11],[13],[2] and[15] had explained that validation is the process whereby model outputs (e.g other fieldwork or simulation) are compared to actual field data of model developed to determine how well the model replicates real-world conditions.
3. Assessing the Need of Transformation
There is some reason that some equations are needed to be transformed in order to be successfully due to Step 7 (see Figure 1). Therefore, the researcher needs to have a full concentration of understanding from previous researcher’s concept or from their own fieldwork data results in order to be success in developing the model equation. Even though, the researchers had success at Step 7 (see Figure 1), the validation from new fieldwork is needed through Step 8 (see Figure 1) in order to know whether the model developed is capable enough for another fieldwork data.
4. Numerical Results and Applications
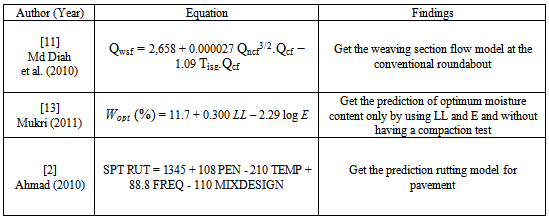
Here are some of developed models results on multiple regressions of data transformation models in different fields (see Table 1):Table 1. Develop Model
 |
| |
|
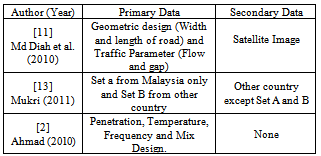
Through three of these models, the results and analysis according from Section 2 are elaborated further.Step 1: Retrieve the data from fieldwork or laboratory (either from primary or secondary data source). See Table 2. Step 2: In this stage, after the data analysis was made, the outliers of data analysis need to be checked thoroughly in MiniTab. Figure 9 shows the sample result of three models through histogram plot. From the results, Figure 9 shows the histogram plot for the overall models data which are normal distribution condition and represents a good data in order to develop the model. When the reasonableness of regression model is satisfied, it is important to investigate and determine whether the residual is appropriate as the normal distribution assumption[12].Table 2. Type of Data from Fieldwork or Laboratory
 |
| |
|
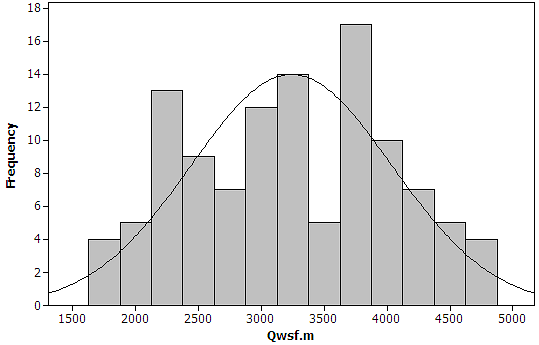 | Figure 9. Sample Results of Histogram Plot of the Models |
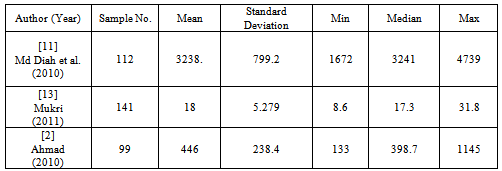
Step 3: The limitation of the minimum and maximum for each data variables is shown in Table 3. Basically, the range of data variables can be determined from related theory, studies from previous researchers or in technical guideline. Otherwise, the data reduction from fieldwork data collection needs to be screened thoroughly in order to know exact range of each data variables.Table 3. Results from Fieldwork or Laboratory
 |
| |
|
Step 4: In this stage, the parameters are identified either dependent or independent variables. From Figure 10, the scatter plot or fitted line plot are used to determine the dependent or independent variables. The dependent and independent variables are normally determined based on visual observation or the value of standard deviation S and coefficient of determination R2. The decision for dependent and independent are made for the purpose of research studies.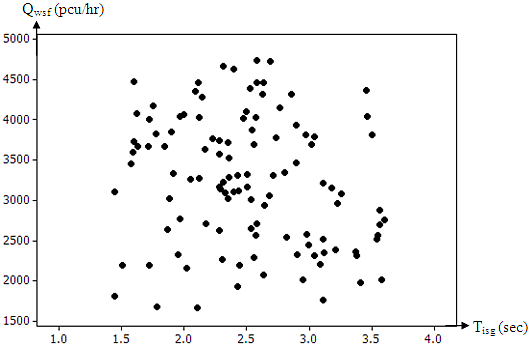 | Figure 10. Sample of Scatter Plot for Measured the Model |
 | Figure 11. Sample of Fitted Line Plot |
 | Figure 12. Sample of Validity Checked for the Model |
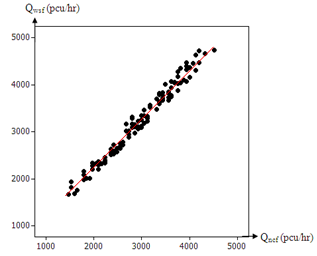
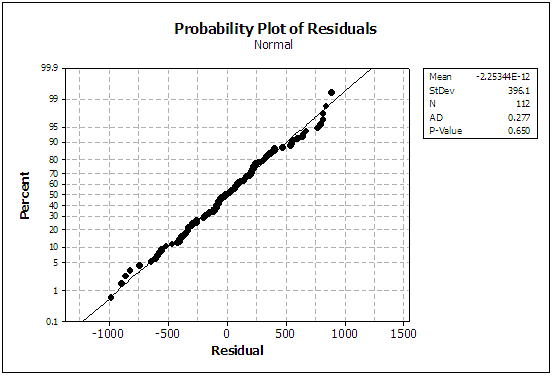
Step 5: Next, the decision on the significant relationship of each parameters with the data reduction are identified through fitted line plot and regression analysis process. In determining the dependent and independent variables, the multiple regression of data transformation is applied in order to make it easier to be visualized and to improve interpretability (see Figure 11). Step 6: After the final selected dependent and independent variable had been decided, in order to perform the multiple regression of data transformation model (see Table 4), the data transformation is required to perform well based on P, T and R2 value. Step 7: There are two types of validity that need to be checked, which are model development and model validation. At this stage, after the multiple regression of data transformation model had been made, then the model needs to be calibrated and analyzed to make sure that the models development are valid. In models development (see Figure 12), this validity can be checked well through normality test: if P value less than 0.05 (means accept Ho), Anderson Darling and Kolmogorov Smirnov test > 0.150 and Durbin Watson test value in the range 0 to 4. If one of test is not valid, the model needs to be re-checked again through from Step 2. Kolmogorov Smirnov test performed to determine the residual that has a high value for Goodness-of-fit[8].Table 4. Final Data Transformation Requirement
 |
| |
|
Step 8: In this stage, the model needs to be validated with other new fieldwork data. Normally the minimum data is half of the model development sample[16]. The comparison result of new fieldwork data needs to be in similarity with model development data through t-paired test. The t-paired test is thus, an indicator for this model validation where the value should be more than 0.05 (see Figure 13). If the value is less than 0.05, then the data need to be re-checked again in Step1 especially the range of minimum and maximum value should not be less or more than model development value. That is why many model equations had their limitation or range values based on their fieldwork conditions. For the purpose of the comparing analyse, this is the best way for collecting new data set which is used for model development and validation[9].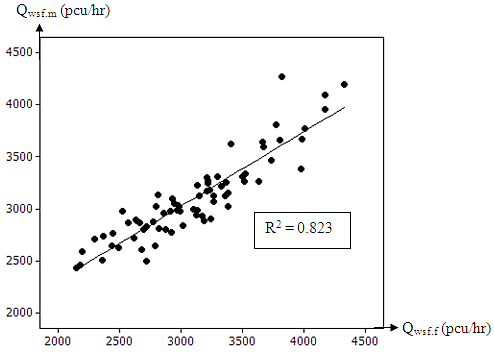 | Figure 13. Sample of Validity Checked for Model New Fieldwork |
Finally, after all steps had been accepted, the Final Multiple Regression of Data Transformation Model can become as successful model. In this study, model validation was performed by comparing the developed model output with new fieldwork data.[11],[13],[2] and[15] had explained that validation is the process whereby model outputs (e.g other fieldwork or simulation) are compared to actual field data of model developed to determine how well the model replicates real-world conditions.
5. Conclusions
This paper deliberated thoroughly the steps on model development and validation process of data transformation. The parameters from develop model are basically needs to be understood which comprises relevant and significant behind the concept in order to develop the model (e.g. in scatter plots, the limitation of minimum and maximum of each variable were resolute and the independent variables were determined based on the relationship with the response variables). In determining the integration between variables, the stepwise regression of data transformation method was used and applied in MINITAB software. Hence, the models in this paper have been successfully developed, and sensitivity analysis of the model will be investigated in next stage of research study.
ACKNOWLEDGEMENTS
The writers would like to thanks the Faculty of Civil Engineering (FCE), Research Management Institute (RMI), and Authorities of Universiti Teknologi MARA (UiTM) for their constant support and encouragement.
References
| [1] | Adnan, M.A. (2007). “Development of Entrance Ramp Merging Density Model based on an Urban Expressway Traffic Condition.” Ph.D Thesis. |
| [2] | Ahmad, J. (2010), “A Study on Moisture Induced Damage and Rutting of Hot Mix Asphalt.” PhD Thesis. |
| [3] | Al-Omari, B.H., Al-Masaeid, H.R., and Al-Shawabkah, Y.S. (2004). “Development of a Delay Model for Roundabouts in Jordan,” Journal of Transportation Engineering © ASCE, January /February 2004. |
| [4] | Cheng, T.C. (2004). “Robust regression diagnostics with data Transformations.” Computational Statistics & Data Analysis 49 (2005) 875 – 891. |
| [5] | Chik, A.A., Che Puan, O., and Ming Jing, C. (2004). “Entry and Circulating Flow Relationship at a Roundabout.” Jurnal Kejuruteraan Awam 16(1): 48-60. |
| [6] | Faria, D. A. (2003). “A Framework to transform Real Time GPS Data Derived From Transit Vehicles to Determine Speed-flow Characteristics of Arterials.” Ph.D., Dissertation, The University of Texas Arlington, U.S. |
| [7] | Ip, W.C., Wong, H., Wang, S.G., and Jia, Z.Z. (2004). “A GIC rule for assessing data transformation Inregression.” Statistics & Probability Letters 68 (2004) 105–110. |
| [8] | Kleinbaum, D.G. & Kupper, L.L. (1978). “Applied Regression Analysis and other Multivariable Methods.” Duxbury Press, North Scituate, Massachusetts. (Asmirza 2001). |
| [9] | Kutner, M.H., Nachtsheim, Netes C.J. J. & Li, W. (2005). “Applied Linear Statistical Models.” 5th Edition, U.S.: Mc. Graw Hill. |
| [10] | Levin, R.I. & Rubin, D.S. (2000). “Statistik Untuk Pengurusan.” Terj. Susila Munisamy & Halimah Awang. Malaysia: Pearson Education Malaysia Sdn. Bhd. Selangor. |
| [11] | Md Diah, J., Abdul Rahman, M. Y., Adnan, M. A., and Atan, I. (2010). “Weaving section flow model at weaving area of Malaysian conventional roundabout.” J. Transp. Eng., 136(8), 782–792, August. |
| [12] | Mendenhall, W., Beaver, R.J. & Beaver B.M. (2006). “Probability and Statistics.” 12th Edition. Thomson Brooks-Cole, The Thomson Corporation. U.S. |
| [13] | Mukri, M. (2011), “Development of compaction and hydraulic conductivity model for sedimentary residual soil.” PhD Thesis. |
| [14] | Osborne, J.W. (2002). “Notes on the use of data transformations.” Practical Assessment, Research & Evaluation, 8(6). Retrieved March 26, 2010 from http://PAREonline.net/getvn.asp?v=8&n=6 . This paper has been viewed 56,458 times since 5/30/2002. |
| [15] | Rakha, H., Hellinga, B., Van, Aerde, M., and Perez, W. (1996). “Systematic Verification, Validation and Calibration of Traffic Simulation Models,” Transportation Research Board 75th Annual Meeting January 1996 Washington, D.C. |
| [16] | Ryan, T.P. (2007). “Modern Engineering Statistics.” John Wiley & Sons. Inc. Publication, ISBN 978-0-470-08187-7. |
 Abstract
 Reference
 Full-Text PDF
 Full-Text HTML