J. Subramani 1, S. Balamurali 2
1Department of Statistics, Pondicherry University, R V Nagar, Kalapet, Puducherry, 605 014, India
2Department of Computer Applications, Kalasalingam University, Krishnankoil, 626 190, Tamilnadu, India
Correspondence to: J. Subramani , Department of Statistics, Pondicherry University, R V Nagar, Kalapet, Puducherry, 605 014, India.
| Email: |  |
Copyright © 2012 Scientific & Academic Publishing. All Rights Reserved.
Abstract
Statistical process control tools and techniques are widely used in assessing and monitoring manufacturing process. Effective implementation of statistical process control tools will improve the productivity and quality; reduce the wastage and improve the business together with various other benefits. Process capability indices are very well used to assess the performance of the production process. However the problem is to keep the produced items in the inventory until to take a decision on the acceptance of the lots based on the outcome of the process capability analysis. An attempt has been made in this paper to overcome such difficulties. As a result we have presented a simple method to assess the process capability indices on line itself, which helps the process as well as the quality engineers to take an instant decision on the manufacturing process whether the process has to be allowed further or to be modified. The method is explained with the help of illustrations.
Keywords:
Manufacturing Range, on Line Computation, Process Capability Index, Sample Size, Tolerance
Cite this paper:
J. Subramani , S. Balamurali , "On Line Computation of Process Capability Indices", International Journal of Statistics and Applications, Vol. 2 No. 5, 2012, pp. 80-93. doi: 10.5923/j.statistics.20120205.06.
1. Introduction
The present scenario of total quality management demands the effective use of statistical tools for analysing quality problems and controlling, monitoring, maintaining and improving the performance of manufacturing process. Many of the quality characteristics are measurable in nature and can be expressed in terms of numerical measurements and are to be monitored and controlled during the production. When dealing with measurable quality characteristics, it is usually necessary to monitor the behaviour of the mean value of the quality characteristics and its variability. To study the behaviour of the production process and to take a necessary action on the process, there are several statistical tools available which include frequency distribution, histogram, Pareto chart, scatter diagram, control charts, regression analysis, process capability analysis, design of experiments and Taguchi methods and are to be effectively used for further improvements on quality and productivity. Among the statistical tools mentioned above, the use of process capability analysis has been increasingly recognised by industrial sectors, particularly the automobile manufacturing industries. The world giant manufacturer of automobiles namely Ford, Chrysler, and General Motors have together developed a Quality System namely QS 9000 standards and advised their suppliers to follow the QS 9000 – Quality Systems Requirements and to get certified for the same to continue as one of the potential suppliers to the above automobile manufacturing giants. The process capability analysis as discussed by Montgomery[10] is a vital part of an overall quality improvement program. Several PCIs have been developed among which the basic indices are Cp, Cpk and Cpm (refer to Kane[8]; Chan et.al.[5]). A detailed review of the PCIs can be seen in Kotz and Johnson[9] and Yum and Kim[13]. The statistical data collected for assessing the suitability of the manufacturing processes and or for computing the process capability indices can also be used to:v Predict how well the process will hold the tolerancesv Assist process engineers in selecting a processv Assist product engineers in modifying a productv Assist in establishing the frequency of samplingv Assess the capability of a new equipmentv Select competing vendorsv Reduce variationsv Predict the outgoing quality level etc.,However the problem encountered in the present day manufacturing systems are as follows:v The process capability indices are computed only after a considerable period.v There is no method available to assess the capability of the process on line v It requires frequent interference of the processv It requires storing the produced items for a considerable period before taking the decision to accept or reject or rework based on the outcome of the process capability study.v In case of allowing the process before getting the process capability indices, there may be a situation, one has to call back the produced items already passed on.v It requires 100% inspection and sorting out of the items produced in non capable processThe process capability indices Cp, Cpk and Cpm were investigated by many authors. For example, the 95% confidence limits for the capability indices Cp and Cpk were constructed by Chou et al.[6]. As their limits on Cpk can produce 97% or 98% lower confidence limits (instead of 95%) making them conservative, an approximation presented by Bissell[3] is recommended. Boyles[4] provided an approximate method for finding lower confidence limits for the index Cpm. All these lower confidence limits are calculated based on the assumption that the process is normally distributed. Franklin and Wasserman[7] constructed the confidence limits for some basic capability indices and examined their behaviours when the underlying process is either normal, skewed or heavy tailed. Balamurali and Kalyanasundaram[2] constructed bootstrap confidence limits for the capability indices Cp, Cpk and Cpm based on lognormal and chi-squared distributions. Balamurali[1] considered the above capability indices under short run production processes and also constructed the bootstrap confidence limits.An attempt is made in this paper to provide online computation of process capability indices which helps to assess the capability of the process on line itself. As a result a simplified procedure is presented for computing the process capability indices for given sample size, sample range and tolerance instantaneously without actually computing the standard deviations and without using the formulae for computing the process capability indices Consequently we have proposed a new manufacturing system called “ Capability Based Manufacturing System”, which avoids unnecessary disturbance to the process; 100 % inspection; sorting and segregation; rework and scrap etc. The results are presented in the Table 1 to Table 10 and are given in the appendix. The Tables 1 to 9 can be used to determine the  value for the given sample size, tolerance and the mean of the sample ranges. On the other hand, it can also be used to determine the manufacturing range to achieve the required
  value. Table 10 can be used to determine the
  value for the given
  and the delta (the proportion of shift in the mean to the targets value). The Table 10 can also be used to know the delta value be allowed to achieve the required
  and
and  values. For want of space we have not presented all the tables developed for various values of
  , Tolerance and Delta not included in the Table 1 to Table 10. If anyone interested to get other tables are advised to contact the author by email or post.
2. Main Results
The following are the various computational formulae involved in constructing the control charts and for the computation of process capability indices, which will be used to derive the simplified procedure for the computation of online process capability indices:  : Mean of i-th sample
  : Grand Mean
  : Range of i-th sample
 : Mean of Range values
 : Upper Control Limit for
  -Chart
 : Lower Control Limit for
  -Chart
 : Upper Control Limit for R-Chart
 : Lower Control Limit for R-Chart
 : Process Capability Index
 : Upper Process Capability Index
 : Lower Process Capability Index
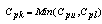 : Process Capability Index
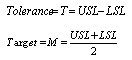 USL: Upper Specification Limit of the Quality CharacteristicsLSL: Lower Specification Limit of the Quality CharacteristicsFor
  - Chart, the 3-sigma control limits are obtained as:
  where
where  is the standard deviation of sample mean. Further
  , the control limits can be rewritten as
  . Further in Quality Control, the standard deviation
  can be normally estimated from the range values using the formula
  . Which implies the control limits for the
  -chart using
  are obtained as
 , which can be written as
  where
where . Similarly, one may obtain the control limits for the R-Charts. Similarly, two Capability Indices
  and
and  are used for measuring the Process Capability, where
 will take only the variability into consideration and will not consider the centrality of the process for assessing the process capability. Whereas the capability index
  will take into account both, the variation and centrality of the process. For a detailed discussion on the definition and the derivation of various formulae involved in control charts and process capability analysis one may refer to Montgomery[10], Subramani[11, 12] and the references cited there in.
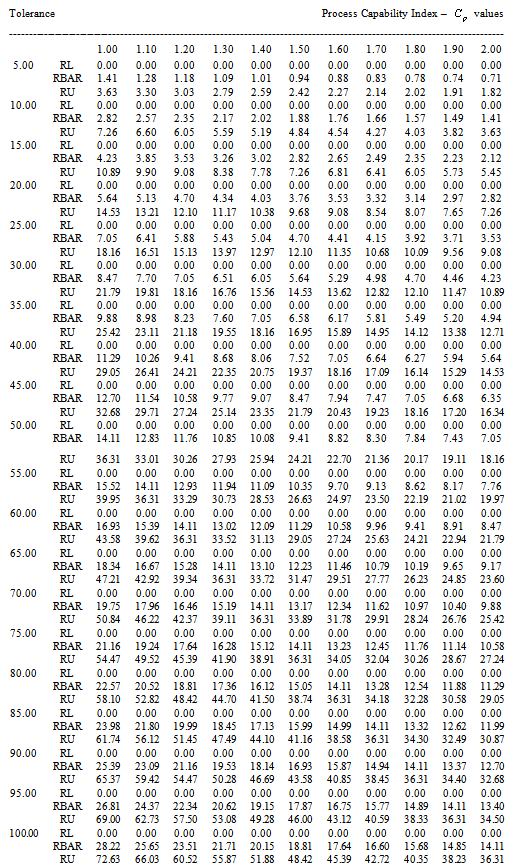
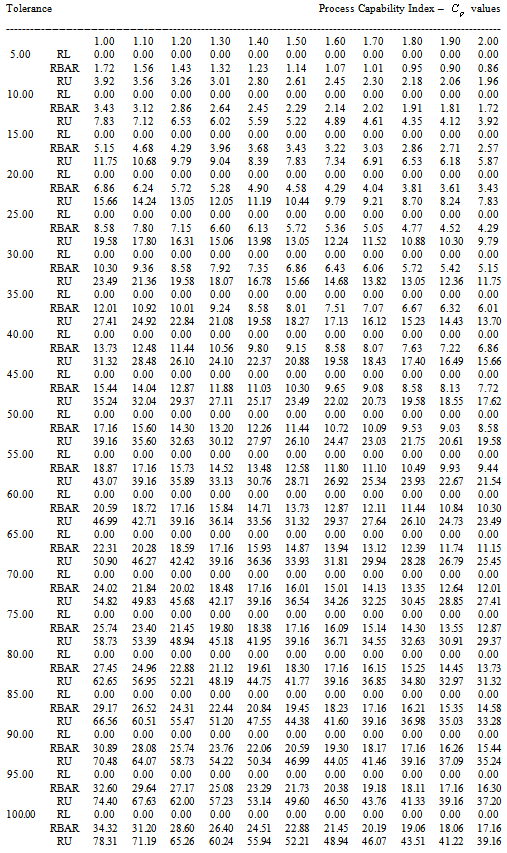
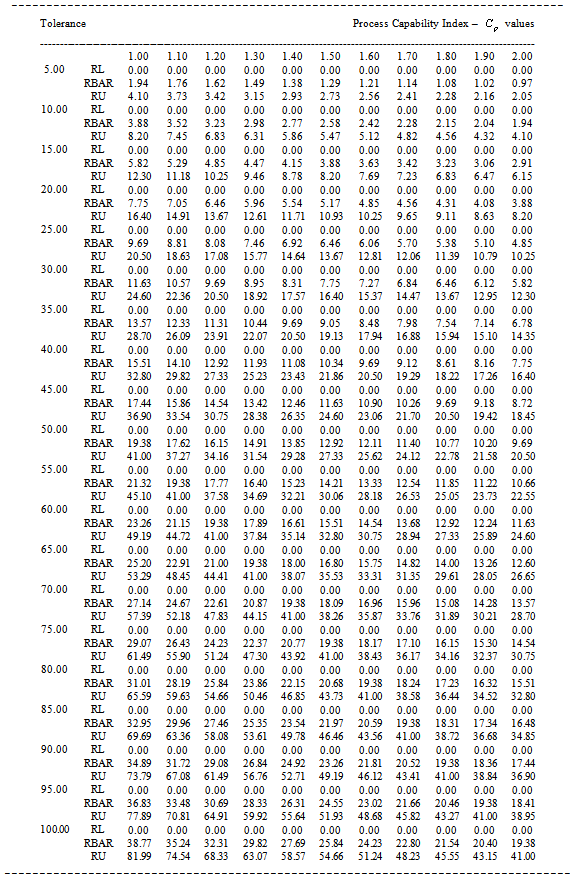
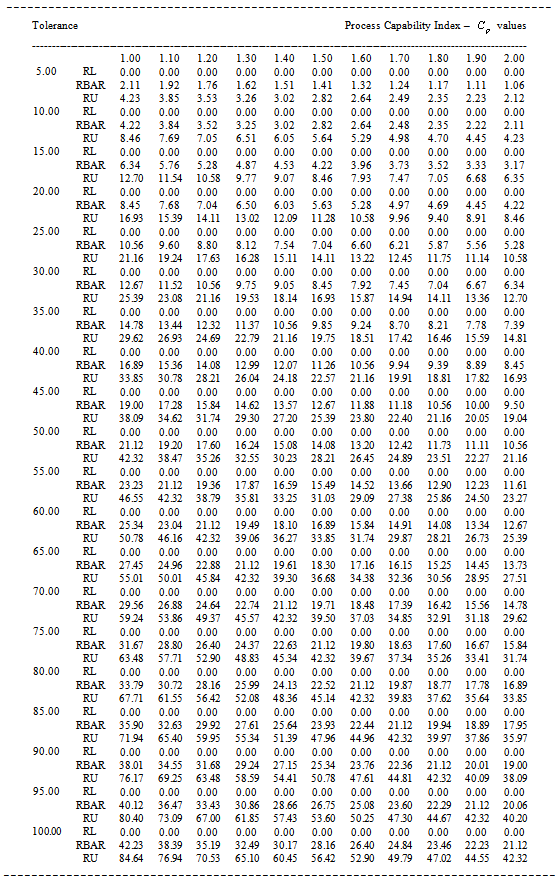
2.1. Computation of Average Range, Maximum and Minimum Range Values Vs Process Capability Index Values
Consider the process capability index 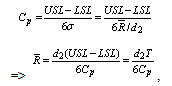 where T is the Tolerance.Further assume that
  and
and  are the maximum and the minimum range values in which range the producer can operate the manufacturing process so as to meet the customer requirements including the process capability indices
  values. That is, the maximum allowable range value should be in between
  and
and . The limit of these range values can be obtained from the
  values obtained in the above equation as follows:
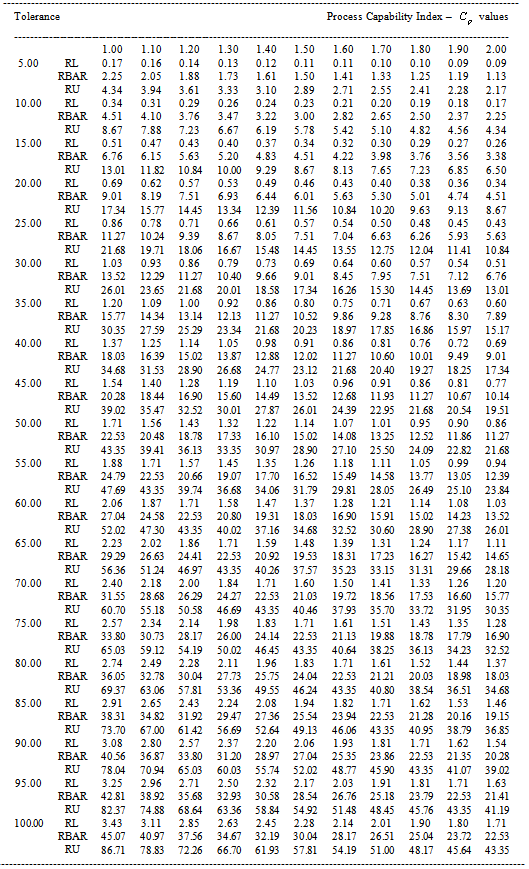
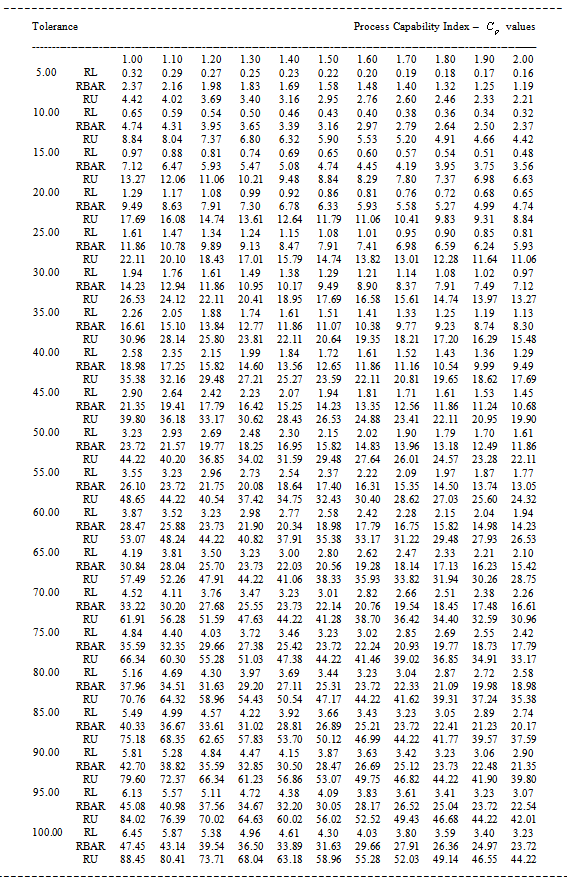
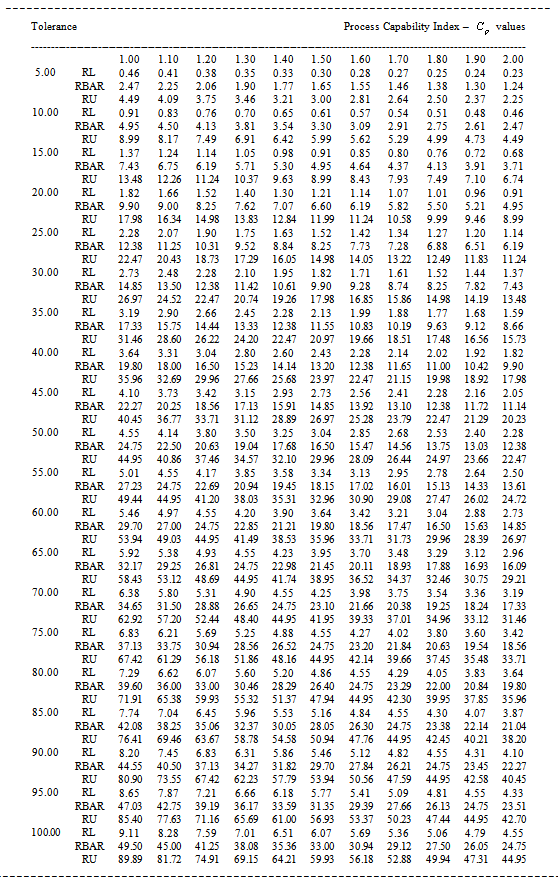
 From the above equations one can easily determine the required average range value and the maximum and minimum values to be operated so as to meet the customer requirements. That is, for any given value of
  , sample size n and the manufacturing tolerance T, as per the requirements of the customer the producer can determine the range values in which he has to operate the manufacturing process. For want of space and for the sake of convenience we have tabulated
  values for the given values of
  with increments of 1,
  with increments of 5 and
  with the increments of 0.1 respectively the sample size, tolerance and process capability index values in Tables 1 to 9. These tables can also be used to determine the value of process capability index
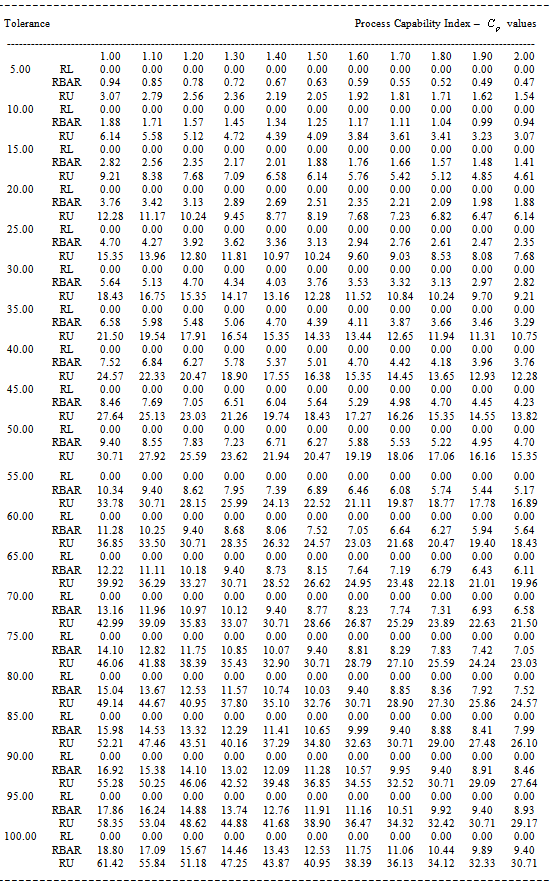
  for the range values, average range in which the process is operating and the sample size by looking at the appropriate columns corresponding to the tolerance and range values by not actually computing the process capability index. This is the advantageous of this study. The above can be explained with the help of the following illustrations.Suppose that the customer wants to get products produced in a manufacturing process with tolerance 20 and process capability index
  with 1.7. Let us assume that the producer measures the process capability with a sample size of 5 then we use the Table 4 to determine the manufacturing range values. If we look at the Table 4 for n=5, it gives that for the given sample size 5, the tolerance 20 and
  value 1.7 the average range value is 4.56 and the upper value of the range is 9.65. Hence to achieve the customer needs, the producer has to operate the manufacturing process with manufacturing range of 0 to 9.65 units. On the other hand the Tables from 1 to 9 can also be used to determine the process capability index
  without actually computing the σ value and
  value by using the formulae as detailed below: Let the given specification be n=5, T=50 and the operating Range of
  value is 20. By looking at the Table 4 with sample size n=5, in the row of T=50 and inside the Row the value close to 20 we obtain the
  value must be in between 1 and 1.1.
2.2. Computation of Process Capability Index  for the shift in the Process Average Vs Process Capability Index
  Values
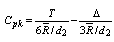
Consider the capability index  is defined as
  =Minimum of
  , Where
 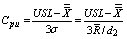 and
and 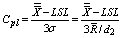 .Consider
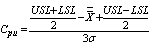
 Consider
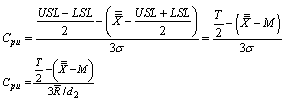
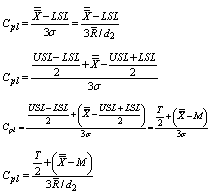 From the above expressions one can obtain
  =Minimum of
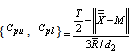
 where
where 
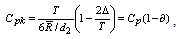 where
where  , the proportion of shift in the process average to the total tolerance. If we multiply the
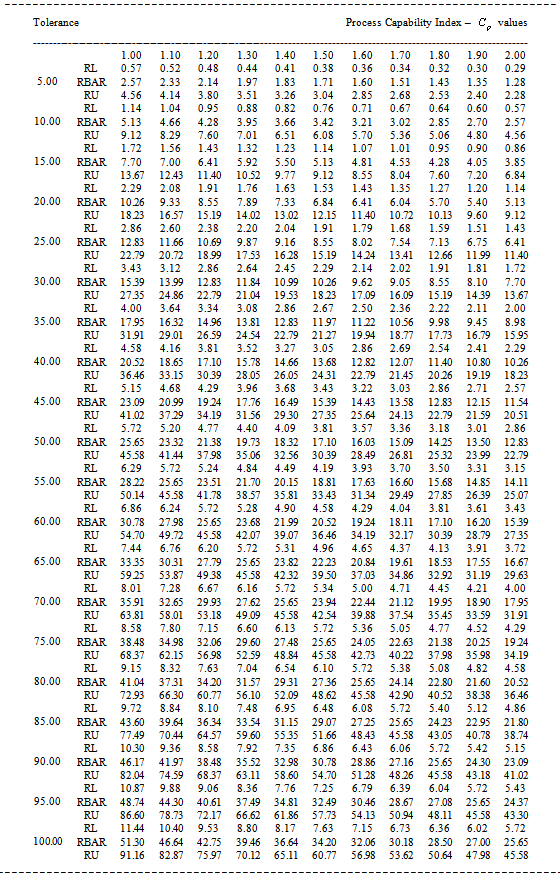
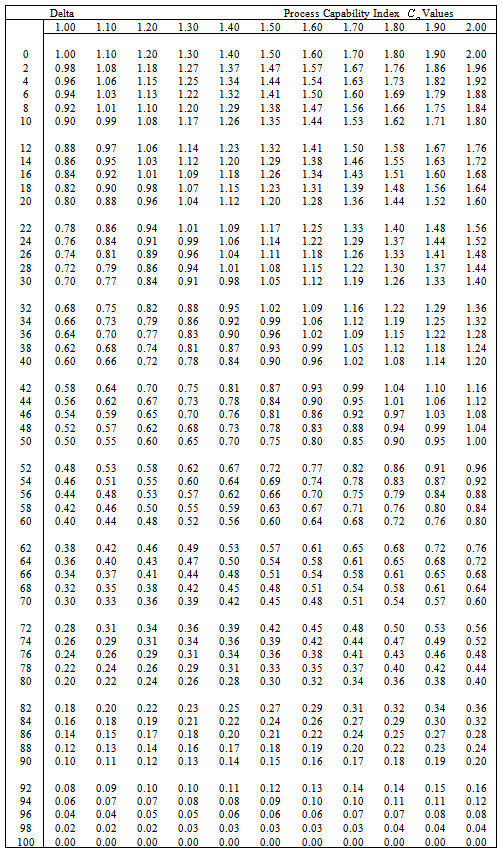
  by 100 one may get the percentage of the shift in the process average to the total tolerance.For want of space and for the sake of convenience of the readers, we have tabulated
  values for the given values of
  (in percentage to the total tolerance) in the range
 with increments of 2 and the process capability index values in the range
  with the increments of 0.1 respectively in Table 10. The Table 10 can be used to determine the value of process capability index
  for the delta values (in percentage to the tolerance) and the process capability index
  by looking at the appropriate columns corresponding to the delta values and the
  values by not actually computing the process capability index
  . The above can be explained with the help of the following illustrations.Table 10 can be used to determine the value of
  for the given value of
  and the process shift from the target value. For example with the process capability
  in the range of 1.7 with the delta of 30 the process capability index
  value will be 1.36 only. Similarly the Table 10 can also be used to decide the amount of shift in process average from the target value to maintain the required process capability indices
  and
and  for the given tolerance.
3. Conclusions
The present scenario of total quality management requires effective use of statistical tools and techniques for a continual improvement on the production processes. Particularly, the automobile sectors require the use of process capability indices to assess the suitability of the manufacturing process as well as to assess the products quality. After the initial approval of the manufacturing process, the future performance will be assessed in terms of the process capability indices, for which the data are collected for a longer period. In case, the computed process capability indices have not satisfied the required conditions, the manufactured products will be screened and called back for some times. In such situations the decision will affect the smooth flow of the production line and also increase the cost of production due to withdrawal of some products; screening of the production lot; rework, rejection and inventory of some produced items. To avoid all these problems, we have suggested a method to assess the process capability indices while the production process is on. As a result we reduce the inventory, recall, rework and rejection of produced items. All these features have been explained with the help of numerical examples.
APPENDIX
Table 1. RL, RBAR and RU values for the given
 value and the Sample Size n=2 value and the Sample Size n=2
 |
| |
|
Table 2. RL, RBAR and RU values for the given
 value and the Sample Size n=3 value and the Sample Size n=3
 |
| |
|
Table 3. RL, RBAR and RU values for the given
 value and the Sample Size n=4 value and the Sample Size n=4
 |
| |
|
Table 4. RL, RBAR and RU values for the given
 value and the Sample Size n=5 value and the Sample Size n=5
 |
| |
|
Table 5. RL, RBAR and RU values for the given
 value and the Sample Size n=6 value and the Sample Size n=6
 |
| |
|
Table 6. RL, RBAR and RU values for the given
 value and the Sample Size n=7 value and the Sample Size n=7
 |
| |
|
Table 7. RL, RBAR and RU values for the given
 value and the Sample Size n=8 value and the Sample Size n=8
 |
| |
|
Table 8. RL, RBAR and RU values for the given
 value and the Sample Size n=9 value and the Sample Size n=9
 |
| |
|
Table 9. RL, RBAR and RU values for the given
 value and the Sample Size n=10 value and the Sample Size n=10
 |
| |
|
Table 10. values for the given
 and the DELTA* values and the DELTA* values
 |
| |
|
References
| [1] | Balamurali, S, Bootstrap confidence limits for short run capability indices, Quality Engineering, 15(4), 643–648,2003. |
| [2] | Balamurali, S. and Kalyanasundaram, M, Bootstrap lower confidence limits for the process capability indices Cp, Cpk and Cpm, International Journal of Quality and Reliability Management, 19( 8/9), 1088–1097, 2002. |
| [3] | Bissell, A.F, How reliable is your capability index?, Applied Statistics, 39(3), 331–340, 1990. |
| [4] | Boyles, R.A, The Taguchi capability index, Journal of Quality Technology, 23(1), 17–26, 1991. |
| [5] | Chan, L.K., Cheng, S.W. and Spring, F.A, A new measure of process capability: Cpm, Journal of Quality Technology, 30(3), 162–175, 1988. |
| [6] | Chou, Y., Owen, D.B. and Borrego, S.A, Lower confidence limits on process capability indices, Journal of Quality Technology, 22(3),223–229,1990. |
| [7] | Franklin, L.A. and Wasserman, G.S, Bootstrap lower confidence limits for process capability indices, Journal of Quality Technology, 24(4), 196–210, 1992. |
| [8] | Kane, V.E, Process capability indices, Journal of Quality Technology, 18, 41–52, Corrigenda, p.265, 1986. |
| [9] | Kotz, S. and Johnson, N.L, Process capability indices – a review, 1992–2000, Journal of Quality Technology, 34(1), 2–19, 2002. |
| [10] | Montgomery, D.C, Introduction to Statistical Quality Control, John Wiley, New York, 2004 |
| [11] | Subramani, J, Application of Systematic Sampling in Process Control, Statistics and Applications- Journal of Society of statistics, Computer and Applications, (New Series), Vol 2, No2, pp 7-17, 2004 |
| [12] | Subramani, J, Process Control in the Presence of Linear Trend, Model Assisted Statistical Applications, 5, 272-281, 2010 |
| [13] | Yum, B-J. and Kim, K-W, A bibliography of the literature on process capability indices: 2000–2009, Quality and Reliability Engineering International, 27(3),251–268,2011 |
 Abstract
 Reference
 Full-Text PDF
 Full-Text HTML