K. K. Singh 1, Brijesh P. Singh 2, Kushagra Gupta 3
1Department of Statistics, Centre for Population Studies, Banaras Hindu University, Varanasi, India
2Faculty of Commerce & DST-CIMS, Banaras Hindu University, Varanasi, India
3Department of Statistics, Banaras Hindu University, Varanasi, India
Correspondence to: K. K. Singh , Department of Statistics, Centre for Population Studies, Banaras Hindu University, Varanasi, India.
| Email: |  |
Copyright © 2012 Scientific & Academic Publishing. All Rights Reserved.
Abstract
Fertility plays an important role in any demographic transition and total fertility rate (TFR) is one of the basic measurements of fertility. Due to non-availability of complete and reliable data, a large number of indirect techniques have been developed to estimate the demographic parameters with incomplete data. Some of these techniques are based on utilizing the data from stable population theory while others are based on the regression technique in which the parameters are estimated through regression equations between the dependent variable which is the TFR and the independent variables which is the socio economic well as demographic variables. In the present paper an indirect method has been proposed to estimate the TFR using regression analysis. In these types of analysis the most serious problem is the choice of predictor variable. If the choice of predictor variable is good then it gives the better estimate for the dependent variable (TFR). Using new predictor variable (proposed in this paper), the improved model explained about 85 percent of the variation in TFR. The findings reveal that the values of TFR calculated by the present method are quite close to the observed values of the TFR without involving much computational complexities at state level for different background characteristics. By using this modified estimate of TFR, the demographers can easily calculate the birth averted for different regions as well as states also.
Keywords:
Births Averted, Total Fertility Rates, Contraception, Linear Regression, Contraceptive Prevalence Rate, Percentage Decrement
Cite this paper:
K. K. Singh , Brijesh P. Singh , Kushagra Gupta , "Estimation of Total Fertility Rate and Birth Averted due to Contraception: Regression Approach", International Journal of Statistics and Applications, Vol. 2 No. 5, 2012, pp. 47-55. doi: 10.5923/j.statistics.20120205.01.
1. Introduction
Fertility is governed by a complex set of biological, socio-economic, political, legal and psychological factors. This is widely affected by different demographic and socioeconomic factors as well as reproductive attitude and behaviour. Therefore, social scientists belonging to different disciplines have developed and calibrated theories of fertility suited to their disciplinary approaches. Changes in fertility can be ascertained by studying summary measure of fertility such as Crude Birth Rate (CBR) and Total Fertility Rate (TFR) as well as by birth order distribution and age pattern of fertility. Here, the latter provides more information about the age and order of birth at which changes are occurring. A better picture of fertility can be obtained by examining the TFR, because it is not affected by the age structure of the population. The TFR is interpreted as the average number of children born to a woman during her complete reproductive period.The functioning of the vital registration system is not adequate in coverage and quality both in majority of developing nation. In spite of carefully planned and executed, any survey data from developing countries comprise large errors of omission of events, errors in the identification of the appropriate time period in which the events have occurred, and serious errors in the reporting of the age of the mothers due to recall lapse and thus age heaping in the data. These errors affect the fertility measures such as CBR, TFR, etc. up to a great extent. Due to these facts researchers develop some appropriate technique which is free from the above mentioned error. To overcome these difficulties the indirect method is useful. The most popular indirect method is regression technique. Using indirect method the TFR is generally estimated through the birth history and own-children method. Cho et. al.[14] have suggested own child method which contains reverse survival technique (15 years) for estimating age specific fertility rate (ASFR) from cross-sectional survey. Another indirect technique for estimation of TFR is proximate determinants model which is given by Bongaart [1] and Bongaart and Potter[2]. They have proposed a simple but ingenious method of quantifying the relative effects of the proximate determinants on fertility in a given population. The methods of estimating births averted were described in the literature in the late 1960s and early 1970s and it can be grouped into three major categories (Kelly[4]): (i) ‘rules of thumb’; (ii) couple-years of effective contraception; and (iii) methods based on ASFR. Ross’s[5] has explained the rules of thumb which says that ‘Five IUDs (intra-uterine devices) inserted this year will prevent one birth next year and another birth each year for at least four more years.’ Although rules of thumb is a convenient for obtaining quick estimates, but it over simplify the components needed for more precise calculations. Potter[3] have given the method of couple-years of effective contraception, which is sophisticated and relatively comprehensive at the individual level but place heavy demands for data on users and requires the estimation of the length of the birth interval in the absence of contraception. Methods based on ASFRs, requires good estimates of ASFRs before and after the programme, which at the time were rarely available. This can also be used to estimate the expected number of births among contraceptive users.After 1970’s some more modification has been done. Brass’s[18] suggested a P/F ratio method for estimating fertility and its advancement has been done by Hobcraft et.al.[19]. This needs the data on last birth history with the age group of the females. Furthermore stable population method has been used by Rele[15,16] for estimating TFRs. With the use of sample registration system some modification has been done by Swamy et. al.[17]. Palmore [21] and Gunasekaran & Palmore[22] also suggested a few regression models to provide indirect estimates of fertility levels. The continuous rise of contraceptive use nationally and globally implies that many unintended pregnancies, as well as induced abortions and maternal deaths, are being prevented (Sai[8]; Khan et. al.[6]; Ross et. al.[10,11]). Mauldin and Ross[7], Jain[9] have used contraceptive prevalence rate (CPR) to predict TFR of any population. These estimates were used primarily by researchers and by managers of family planning programmes to assess the effectiveness of various contraceptive methods and modes of service delivery. In this paper similar indirect estimation procedure has been suggested for estimating TFR through a new predictor variable (NPV). Using the proposed NPV, number of births averted has also been estimated for 19 major states of India.
2. The Data
After 1990s the Ministry of Health and Family Welfare, Government of India, has been relying increasingly on the country’s National Family Health Surveys (NFHS) to monitor and evaluate the success of its family planning and reproductive and child health programmes at both national and state level. The first of such survey (NFHS-I) was conducted in 1992-93. This gives family and health related information quite briefly. After that the NFHS-II was conducted in 1997-98 which incorporates some more information related to family planning and reproductive and child health. Finally the third and current NFHS-III has been conducted in 2005-06 to know the current scenario of fertility pattern. Demographers always face problems due to non-availability of complete and reliable data. For the proposed analysis we have used available data on combination of contraceptive prevalence and proportion of females having no children during last 60 months prior to survey date i.e. having open birth interval 5 years or more and not using any contraceptive during last 5 years for the estimation of TFR. Total number of births in last three years were also considered for estimation of births averted in last three years. Observed values of TFR have been taken from NFHS-III[13] report. Also in the present study data for CPR and open birth interval for women who are currently married has been taken form NFHS-III.
3. The Choice of Predictor
In this type of estimation procedure the choice of predictor variable(s) is very crucial, critical and important. Thus a researcher should have brief knowledge of the dependent variable and associated independent variable(s) which should explain the data in better way and to have reliable results. It is worthwhile to be noted that in this method the dependent and independent variable(s) should be highly correlated. There are so many predictor variable(s) for estimating the TFR. Some demographers have used proportion of 3+ order births for estimation of TFR. Others have used the weighted average of proportions of different birth orders to estimate TFR. Mauldin and Ross[7], Jain[9] have used CPR to predict TFR of any population. A robust regression, including a linear and a quadratic term for CPR (for currently married women) has been done by Li Liu et.al[12]. These types of predictor variables give quite reliable estimates for TFR.Here a NPV for obtaining more reliable and efficient estimates for TFR has been proposed. This predictor variable is the combination of proportion of females currently using contraceptives and proportion of females having open birth interval more than 5 years or more and not using any contraceptive during last 5 years.
4. Methodology
The proposed method is essentially based on the technique of regression analysis. This analysis is carried out by ordinary least square (OLS) assumptions. Here the basic assumption of OLS has been fulfilled since the data are taken from normal population and they are independent also. State level information for the predictor variable is extracted for 19 major states in India. Using regression analysis concept, firstly the relationship between TFR and CPR has been established. Line of regression between TFR (Y) and CPR (X) is drawn taking 19 major states of India considering NFHS – III data and its equation is as follows: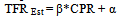 | (1) |
where,TFR Est - Estimated TFR.β - Regression coefficient.CPR - Contraceptive prevalence rate.α - Intercept and this can be treated as the extreme point of TFR according to Model-1 given by equation (1) and also this indicate the maximum TFR in the absence of CPR.Again a similar type of regression analysis has been done by taking dependent variable as TFR and independent variable NPV, which is combination of CPR and the proportion of women whose open birth interval is more than 5 years and never used contraceptive method in this period. Here the line of regression is drawn between TFR (Y) and NPV (X) for the 19 major states of India with the data of NFHS-III. Equation for the Regression line is given as: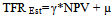 | (2) |
where,TFR Est - Proposed estimated TFR using regression given by equation (2).γ- Coefficient of regression line for equation (2).NPV - New Predictor Variable (Additive combination of CPR and proportion of currently married females having open birth interval more than 5 years and have not used contraceptives during this period. These two groups are mutually exclusive).µ - Intercept and this can be treated as the extreme point of TFR according to Model-2 given by equation (2) and also this indicates the maximum TFR rate in the absence of NPV.Here, the model after considering the NPV gives higher value of R2 than the previous one where only CPR is taken as predictor variable. Thus, one can say that Model-2 explains the data better than Model -1.
5. Results and Discussion
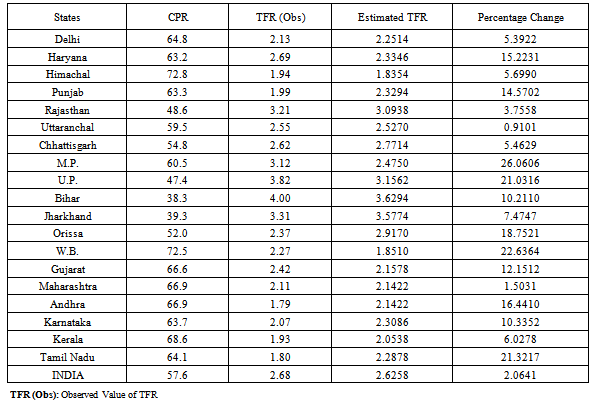
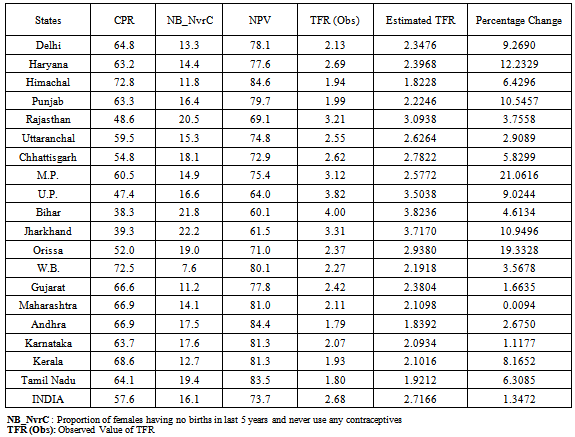
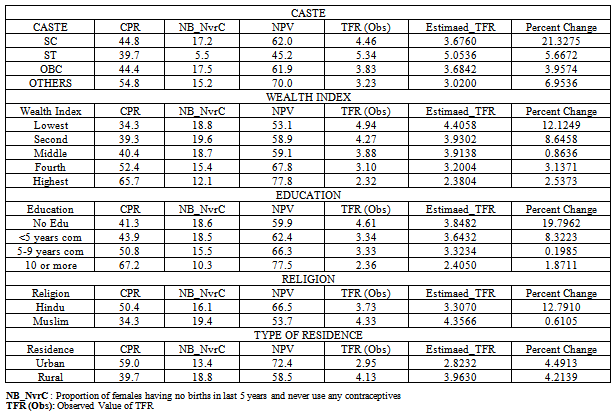
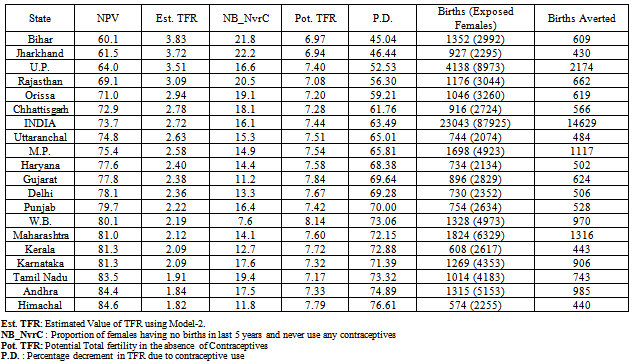
India's cultural diversity is reflected in substantial fertility variation across the nation. This diversity can also be seen through the contraceptive use of the couple across the states. Figure 1 shows the scatter plot between the variables CPR and TFR utilizing the NFHS-III data on different major states of India. Furthermore, it shows the regression line taking TFR as dependent variable and CPR as independent variable. The estimated value of coefficient of this regression line is -0.054, which is negative. This means that the increment in CPR will decrease the TFR. Through the regression equation it is cleared that if we increase the CPR by one unit the TFR is lowered down by 0.054 units. If CPR is equal to zero then TFR will take the value α, i.e. it will go up to 5.81. This means that if contraceptive use is absent in the society a female will have 5.81 children on an average in her entire reproductive period and if contraceptive use will rise up to 100 percent then TFR will reduces up to 0.41. In other worlds one can say that if all females start using contraceptives the TFR will lower down to 0.41 children on an average per female. The coefficient of determination (R2) of this regression line is 0.709. This indicates that about 71 percent variation in TFR can be explained by this regression line.Table 1 shows the CPR, TFR (observed) and TFR (estimated) for 19 major states of India. The predicted value of TFR is obtained with the help of linear regression using Model-1. Himachal Pradesh shows highest use of CPR which is 72.8 percent. After Himachal Pradesh, West Bengal is at second highest and Kerala is at third highest in contraceptive use with CPR 72.5 percent and 68.6 percent respectively. Delhi is at seventh place in the use of current contraceptives. The states Chhattisgarh, Orissa, Rajasthan, Uttar Pradesh, Jharkhand and Bihar shows CPR lower than All India level which is 57.6 percent. Bihar shows lowest CPR with 38.3 percent and Uttar Pradesh shows CPR with 47.4 percent.Figure 2 shows the scatter plot between TFR and NPV. Again simple linear regression analysis has been carried out to find the relationship between TFR and NPV. With the help of 19 major states data the estimated value of regression coefficient of this model was obtained as -0.082. This negative coefficient clearly explains that as proportion of NPV increases, a decrease in TFR will be observed. From the regression equation it is clear that one unit increase in NPV will give 0.082 units reduction in TFR. This Model-2 has coefficient of determination higher than Model-1. The value of coefficient of determination (R2) was observed as 0.849. It implies that about 85 percent of the variation in TFR is explained by NPV. Now if we go for the extreme values of NPV, i.e. 100 percent then TFR reduces up to 0.56. If NPV is equal to zero, TFR will take the value γ, i.e. it will rise up to 8.76 which is maximum value of TFR according to this model. Table 2 gives the data for CPR, proportion of females whose open birth interval is more than 5 years and never used any contraceptives, contraceptives prevalence rate, TFR (observed) and TFR (estimated) for 19 major states of India using Model-2. The estimated TFR is this case more closed than previous estimate of TFR which is given in Table-1. Himachal Pradesh shows lowest estimated TFR 1.82 and Bihar shows highest estimated TFR 3.82. India has estimated value of TFR as 2.72. The states Chhattisgarh, Orissa, Rajasthan, Uttar Pradesh, Jharkhand and Bihar have TFR higher than all India with same sequence from low to high as shown in Table 1. Some states like Kerala was 3rd lowest place in estimate TFR in Table 1 but if we use NPV as a predictor than it moves on to 5th lowest place which is represented in Table 2. The state Andhra which was at 5th place from the lowest TFR estimated in Table 1 now got 2nd place from the lowest TFR estimated in Table 2 which means that in this state some females control fertility without using any contraceptive.The changes were occurred due to the use of an additive indicator in addition to CPR which is proportion of females whose open birth interval is more than 5 years with never use any contraceptives. This additive indicator is very useful to predicted TFR for different states of India. If we consider only proportion of females whose open birth interval more than 5 years with never use any contraceptives, 10 states are there which have higher proportion than all India. The state Jharkhand shows this proportion highest as 22.2 percent and West Bengal shows this proportion lowest with just 7.6 percent. Bihar is at 2nd highest proportion and Rajasthan is at 3rd highest proportion. The result clearly shows that Bihar is at 2nd place in this proportion but estimated TFR is high because of low contraceptive use. The states Andhra and Tamil Nadu have high proportion of both factor and got 2nd and 3rd place in lowest estimated TFR.Table 3 represents the CPR, proportion of females having no births in last 5 years and never used any contraceptives, NPV, observed value of TFR, estimated value of TFR and percentage change in the observed and estimated values of TFR according to different demographic and socio-economic background characteristics of India’s largest state Uttar Pradesh by the application of Model 2. TFR is estimated with the help of NPV for different groups for example caste, wealth index, educational status, religion and place of residence for the state Uttar Pradesh. From the table it is clear that scheduled tribe (ST) category shows highest estimated TFR than the other caste category group. Proportion of females whose open birth interval is more than 5 years with never use any contraceptives is quite low (5.5 percent) for ST category and highest for others backward category (OBC). NPV is observed to be highest in caste category ‘other’, whereas, it is lowest for ST category. The difference between the estimated TFR for other caste category and ST category is about 2 children per female.In case of wealth Index groups, increase in wealth index shows decrement in TFR. Proportion of current contraceptive use increases as the wealth index increases, whereas, proportion of females whose open birth interval is more than 5 years or more with never use any contraceptives decreases as wealth index increases. This may be perhaps because of their awareness about the contraceptive and their effectiveness. The difference between lowest and highest wealth index groups with respect to the estimated value of TFR is observed to be about 2 children per women.In case of education differential, no education group have CPR 41.3 percent and another additive indicator in NPV have 18.6 percent proportion and 10+ education group have CPR 67.2 percent and additive indicator other than CPR in NPV have proportion 10.3 percent. Here again the proportion of contraceptive user increases as education status increases and the proportion of females whose open birth interval is more than 5 years with never use of any contraceptives decreases as education status increases. But if we consider the effect jointly i.e. proportion of NPV, it increases as educational status increases. Thus, estimated values of TFR decrease as education level increase which can be clearly observed in Table 3.Hindu religion group shows 50.4 percent contraceptive use and Muslim group shows 34.3 percent contraceptive use. There is about 15 percent difference in CPR between these two groups. The factor proportion of females whose open birth interval is more than 5 years with never use any contraceptives is 16.1 percent for Hindu group and 19.4 percent for Muslim group. The values of estimated TFR is differ by one child between Hindu and Muslim groups. This is mainly due to the perception of religion against the use of contraceptives.Urban group has 59.0 percent contraceptive use and rural group has 39.7 percent contraceptive use. The difference between urban and rural group in CPR is 19.3 percent which is fairly apart. Similarly, the proportion of NPV difference between rural and urban group is 13.9 percent. Again the people living in Urban and Rural place has a difference of one child in estimated TFR. This indicates that the urban peoples have more aware about the contraceptive method use and have proper knowledge of different varieties available in the society.From the results shown in Table 3, it is quite clear that the estimated values of TFR and observed values of TFR are close enough. This indicates that Model-2 is quite helpful to get the estimates of TFR at different background characteristics at state level and it is very easy to obtain.Table 4 represents the NPV, estimated value of TFR, proportion of females having no births in last 5 years and the female have never used any contraceptives in their complete reproductive period prior to survey date, potential TFR in the absence of current contraceptives, percentage decrement (PD) in TFR due to use of contraceptives, births in last three years with exposed number of females and number of births averted in last three year among the females who were exposed for 19 major states of India by using current contraceptives. Estimated value of TFR is obtained with the help of NPV and potential value of TFR is obtained by taking additive indicator only, which is the proportion of females who have not given births in last 5 years and not used any contraceptive till reference date, in place of NPV in Model-2. Thus, the potential TFR will provide the TFR in the absence of current contraceptive. It is clear from the Table that by the use of current contraceptive, there is a reduction of 14629 births in all over INDIA among the total 87925 females considered who are exposed to the risk of conception. Maximum 2174 births have been reduced by Uttar Pradesh for sample size of 8975 currently married females and minimum 430 births with sample size of 2295 currently married females have been averted in Jharkhand. The states Maharashtra and Madhya Pradesh reduce the births more than 1000 children with sample size 6329 and 4923 currently married females respectively. Thus, a large number of births have been averted in the presence of current contraceptives use by different states of India.More precisely Fig.3 gives the percentage reduction in TFR for major states of India by the use of current contraceptive. India is a country with cultural, traditional and regional diversity and thus this variation is observed in fertility parameters across the nation. India taking as a whole shows about 63.5 percent decrement in TFR due to the use of contraceptives. Highest percentage of decrement in TFR (76.6 percent) is shown by Himachal Pradesh and lowest percentage of decrement in TFR (45.0 percent) is shown by Bihar. Uttar Pradesh shows third lowest place in decrement of TFR with 60.0 percent. The states Chhattisgarh, Orissa, Rajasthan, Uttar Pradesh, Jharkhand and Bihar have low percentage of decrement in TFR with respect to All India level. The state Kerala stands at 5th place in highest percentage decrement in TFR. Tamil Nadu stands at 3rd place and Maharashtra stands at 6th place from the highest percent decrement (PD). Finally in a nutshell there are so many methods discussed in the introductory section, the avialability of the data is one of the important ploblem of these methods. This study gives a simplest procedure to estimates the TFRs at state level. The same model can be used to estimates TFRs upto the differnt demographic divident of state also. It also includes the recent study of number of births averted due to the contraceptive use at state level.  | Figure 1. Observed relationship and fit of linear regression results for TFR on CPR for 19 major states of INDIA |
 | Figure 2. Observed relationship and fit of linear regression results for TFR on NPV for 19 major states of INDIA |
Table 1. Estimation of Total Fertility Rates using Contraceptive Prevalence Rate for Major States: (NFHS-III Data)
 |
| |
|
Table 2. Estimation of Total Fertility Rates using New Predictor Variable for Major States: (NFHS-III Data)
 |
| |
|
Table 3. Estimation of TFR for Different Demographic and Socio-Economic Background Charecteristics of Uttar Pradesh utilizing Model-2 : (NFHS-III Data)
 |
| |
|
Table 4. Estimation of total number of births averted in last three years by the use of current contraceptives for 19 major states of India: (NFHS-III Data)
 |
| |
|
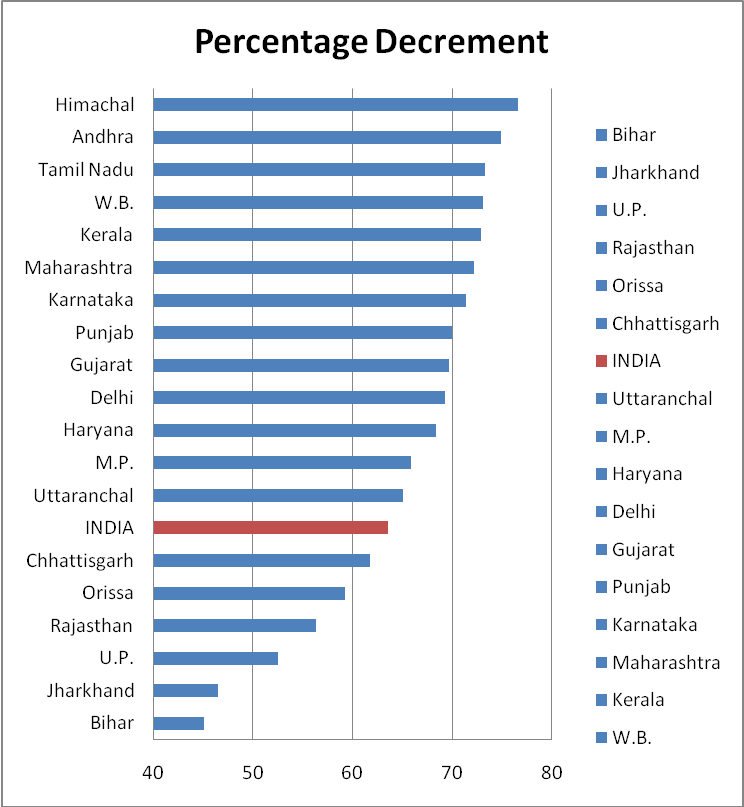 | Figure 3. Percentage Decrement (PD) in TFR due to Contraception for 19 major states of INDIA |
References
| [1] | Bongaart, J. 1978. A frame work for analyzing the proximate determinants of fertility. Population and Development Review, Vol. 4, p. 105-132. |
| [2] | Bongaart, J. and Potter, R.G. 1983. Fertility, Biology and Behavior, Academic Press, New York. |
| [3] | Potter, Robert G. 1969. Estimating births averted in a family planning program, in S. J. Behrman, Leslie Corsa, and Ronald Freedman (eds.), Fertility and Family Planning: A World View. Ann Arbor: University of Michigan Press, pp. 413_434. |
| [4] | Kelly, William J. 1971. Estimation of births averted by family planning programs: the parity approach, Studies in Family Planning 2(9): 197_201. |
| [5] | Ross, John A. 1966. Cost of family planning programs, in Bernard Berelson (ed.), Family Planning and Population Programs: A Review of World Developments. Chicago: University of Chicago Press, pp. 761_762. |
| [6] | Koenig, Michael, Vincent Faveaux, A. I. Chowdhury, J. Chakraborty, and M. A. Khan. 1988. Maternal mortality in Matlab, Bangladesh: 1976_1985, Studies in Family Planning 19(2): 69_80. |
| [7] | Mauldin, W. P. and J. A. Ross. 1991. Family planning programmes: Efforts and Results, 1982-1989. Studies in family planning, 22(6): pp. 350-367 |
| [8] | Sai, Fred. 1992. How family planning can save lives in Africa, African Health 14(3): 10_11. |
| [9] | Jain, A. 1997 Consistency between contraceptive use and fertility in India. Demography India, 26(1): 19-36. |
| [10] | Ross, John A., John Stover, and Amy Willard. 1999. Profiles for Family Planning and Reproductive Health Programs: 116 Countries. Washington, DC: Futures Group International. |
| [11] | Ross, John A., John Stover, and Demi Adelaja. 2005. Profiles for Family Planning and Reproductive Health Programs: 116 Countries, 2nd edn. Washington, DC: Futures Group International. |
| [12] | Liu Li, Becker Stan, Tsui Amy and Ahmed Saifuddin. 2008. Three methods of estimating births averted nationally by contraception, Population Studies, 62: 2, 191 – 210. |
| [13] | IIPS (International Institute for Population Science). 1995. National Family Health Survey-3 India (2005-06). IIPS, Bombay. |
| [14] | Cho, Lee-Jay, R. D. Retherford, and M. K. Choe. 1986. The Own-Children Method of Fertility Estimation. Honolulu: University of Hawaii Press. |
| [15] | Rele JR. Fertility Analysis Through Extension of Stable Population Concepts. Berkely: University of California; 1967 Republished in 1977 by the Greenwood Press, Westport, Connecticut, asPopulation Monograph Series No.2. |
| [16] | Rele JR. Fertility Levels and Trends in India, 1951-81. Population and Development Review. 1987; 13(3):513-530 |
| [17] | Swamy VS; Saxena AK; Palmore James A.; Mishra Vinod; Rele JR, and Luther Norman Y. RGI. Evaluating the sample registration system using indirect estimates of fertility and mortality. New Delhi: Registrar General of India; 1992 Nov 24; Occasional Paper. (1992 (3)). |
| [18] | Brass, W., .1968. Methods of analysis and estimation. In: The Demography of Tropical Africa. Edited by W. Brass et al. Princeton University Press, Princeton. |
| [19] | Hobcraft, JN; Goldman, N; Chidambaram, VC .1982. Advances in the P/F ratio method for the analysis of birth histories. Population Studies; 36(2): 291-316. |
| [20] | United Nations.1983. Indirect Techniques for Demographic Estimation-Manual X. (Population Studies, No. 81) New York: United Nations. |
| [21] | Palmore, James A., .1978. Regression Estimates of Changes in Fertility, 1955-60 to 1965-75, for Most Major Nations and Territories. Papers of the East-West Population Institute, No. 58. Honolulu: East-West Center. |
| [22] | Gunasekaran, Subbiah, and Palmore, James A. 1984. Regression Estimates of the Gross Reproduction Rate Using Moments of the Female Age Distribution. Asia and Pacific Census Forum 10 (May 1984):5-9 |
 Abstract
 Reference
 Full-Text PDF
 Full-Text HTML