Özlem Ege Oruç , Armağan Kanca
Department of Statistics, Dokuz Eylul University, İzmir, 35160, Turkey
Correspondence to: Özlem Ege Oruç , Department of Statistics, Dokuz Eylul University, İzmir, 35160, Turkey.
| Email: |  |
Copyright © 2012 Scientific & Academic Publishing. All Rights Reserved.
Abstract
A fundamental concept of information theory, relative entropy and mutual information, is directly applicable to evaluation of diagnostic test performance. The aim of this study is to demonstrate how basic concepts in information theory apply to the problem of quantifying major depressive disorder diagnostic test performance. In this study, the performances of the Dexamethasone Suppression Test-DST and the Thyroid-Stimulating Hormone Test-TSH, two of the diagnosis tests of Major Depressive Disorder, are evaluated with the method of Information Theory. The amount of information gained by performing a diagnostic test can be quantified by calculating the relative entropy between the posttest and pretest probability distributions. And also demonstrates that diagnostic test performance can be quantified as the average amount of information the test result provides about the disease state. It is aimed that this study will hopefully give various points of view to the researchers who want to make research on this subject by explaining how the tests used for the diagnosis of various diseases are evaluated with this way.
Keywords:
Diagnostic Tests, Information Theory, Entropy, Relative Entropy, Mutual Information
Cite this paper:
Özlem Ege Oruç , Armağan Kanca , "Evaluation and Comparison of Diagnostic Test Performance Based on Information Theory", International Journal of Statistics and Applications, Vol. 1 No. 1, 2011, pp. 10-13. doi: 10.5923/j.statistics.20110101.03.
1. Introduction
Diagnostic tests are widely used in many areas. In particular, these tests have a huge importance in medicine sector. By courtesy of early and accurate diagnosis can decrease the morbidity and mortality of disease. It is often important to compare various diagnostics test with each other for specific clinical conditions in order to determine which one is the best to use. To evaluate the performance of a diagnostic test within a given population, we ideally determine both the test result and the disease state for every individual in that population. One of the approaches used to analyze the performance of diagnostic tests in recent years, information theory. This theory of knowledge and uncertainty for the measurement is based on a mathematical basis. In 1973, , Goodenough and.Rossmann have developed a formula used in assessing the performance of diagnostic tests using information theory[1]. After this work, Somoza and Mosmann developed new mathematical and graphical method to evaluate and compare the performance of diagnostic tests for the value of any prevalence (P) using the properties of the ROC analysis and information theory approach[2]. In 1999, Lee was obtained the distance between patients and healthy distributions using the concept of relative entropy [3]. In 2002, Benish was investigated the concept of relative entropy with a different perspective[4].The aim of this study is to demonstrate how basic concepts in information theory apply to the problem of quantifying diagnostic test performance.
2. Methods
2.1. Basic Concepts of Diagnosis Test
A fundamental concept of information theory, relative entropy and mutual information, is directly applicable to evaluation of diagnostic test performance. In this study the amount of information gained by performing a diagnostic test can be quantified by calculating the relative entropy between the posttest and pretest probability distributions. And also demonstrates that diagnostic test performance can be quantified as the average amount of information the test result provides about the disease state. While evaluating diagnosis test performance creating sample is the first thing that should be done. A sample group is selected, the diagnosis is made and the group is tested. On the condition that there is a bilateral class result as disease positive / negative and the test result positive / negative, a crosstab is created. The crosstab is as below.Table 1. Relations Between Prevalence And The Level of Test
 |
| |
|
Let  be the probability that patient
  will get a positive diagnosis and
  be patient
  s probability of a positive test.
 is called as the prevalence and it is equal to
  value. It is also called as pretest probability of disease.
  is called as the level of the test and it is equal to
  value. We also define
  and
and .
. : If both diagnosis and test are positive, it is called a true positive.
  : If diagnosis is negative and test is positive, it is called a false positive.
  : If diagnosis is positive and test is negative, it is called a false negative.
  : If both diagnosis and test are negative, it is called a true negative. We are going to mention about 5 criteria for the calculation of the test quality. These criteria will also be used in the Information Theory. Sensitivity: The possibility of finding sick people among actually sick people.
 | (1) |
Specificity: The possibility of finding health people among actually healthy people.  | (2) |
Efficiency is defined as  | (3) |
The Predictive Value of A Positive Test: Positive test result gives the possibility of being ill. | (4) |
The Predictive Value of A Negative Test: Negative test result gives the possibility of not being ill. | (5) |
We learn whether the diagnosis test has legitimacy or not with one of the statistical test of Chi-Square. The Chi-Square test depends on sample size ( ),
), and
and  values.
  and
and  are quality indices and calculated with the formulas below.
 | (6) |
 | (7) |
2.2. Entropy, Relative Entropy and Mutual Information
A fundamental concept of information theory, relative entropy and mutual information, is directly applicable to evaluation of diagnostic test performance. This section briefly defines Shannon entropy, relative entropy (Kullback-Leibler divergence) and mutual information. The entropy is a measure of the average uncertainty in a data set. It is the number of bits on average required to describe the random variable. Let  be a discrete random variable, taking a finite number of possible values
  with respective probabilities
  for
for  and
and  The Shannon entropy
  is defined by
 | (8) |
in the works Cover and Thomas[5]. While evaluating the performance of the diagnosis test using the information theory, we need to explain the concepts of test results and disease statement. Disease statement is shown with D. On the condition that there are two statements such as the existence or the non-existence of a disease, we can specify the Disease Statement as follows.
 =Get ill before diagnosis test
 =Get not ill before diagnosis testThe probability distribution of the disease statement before the test is defined with Prevalence (
 ) and 1-Prevalence (
 ) values. In this case, the entropy before the test is calculated with this formula:
 | (9) |
The mutual information of two random variables is a quantity that measures the mutual dependence of the two variables. The interpretation is that when mutual information is absent, marginal distributions are independent and their entropies add up to total entropy. Mutual information  for the random variables x and Y is evaluated by the formula
 | (10) |
See Cover and Thomas [5].After the diagnosis test is applied, the uncertainty of the disease statement changes. On the condition that the diagnosis test results are known, the entropy of the disease statement is called conditional entropy and is calculated according to the formula below. | (11) |
If  is defined as pretest entropy, we need to define
  as the expected value of posttest entropy. Besides, the difference between
  and
and ) is called as Mutual Information. Mutual Information is shown as
  [7].
[7].  is the reduction in the uncertainty of
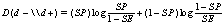
  due to the knowledge of T. Mutual Information is the general criterion of what the diagnosis test will tell us.The relative entropy (Kullback-Leibler divergence)
  is an appropriate measure of the similarity of the underlying distribution. It may be calculated from
 | (12) |
The properties of the relative entropy equation (12) make it non-negative and it is zero if both distributions are equivalent namely, . The smaller the relative entropy is the more similar the distribution of the two variables and vice versa, see Cover and Thomas [5].In diagnosis tests, the distance between positive posttest entropy and pretest entropy is relative entropy. This distance is called as the information content which is provided with positive result and it is shown with
  Similarly, the distance between negative posttest entropy and pretest entropy is called information content which is provided with negative result and it is shown with
  The concepts of
  and
and  are calculated according to the formulas below.
 | (13) |
 | (14) |
while B in the formula is calculated with the formula of .
.  is directly equal to
  (the level of the test) value.Therefore we can find the value of mutual information by using I. pos. and I. neg. formulas. The relationship between mutual information and
  /
/  is found with the formula.
 | (15) |
The value of  which is called “rule in potential” is the criterion showing the existence of the disease. Similarly, the value of
  which is called “rule out potential” is the criterion showing the non-existence of the disease. The formulas for the concepts of
  and
and  are as below.
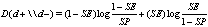 | (16) |
 | (17) |
See [4].
3. Application and Results
Major Depressive Disorder is to feel so sad, bored, distressed and depressed that it ruins daily routine and social functions of the person suffering. Major Depressive Disorder patients can not even manage their daily routines. In this study, the performances of the Dexamethasone Suppression Test-DST and the Thyroid-Stimulating Hormone Test-TSH, two of the diagnosis tests of Major Depressive Disorder, are evaluated with the method of Information Theory. In this application, data of 200 patients who applied DEU. medical faculty department of psychiatry are studied; The results of DST and TSH diagnosis tests are evaluated below.Table 2. Relations Between The Measurement Probabilities of Outcome, Prevalence and Level of Diagnostic Tests
 |
| |
|
According to the results deduced from the first 4 tables for application, the DST and the TSH have the same prevalence however, the level of the test values are different. Since  value of DST is bigger than
  value of TSH; it can be said that DST can select actually ill people better than TSH from the sample. Since
  value of TSH is bigger than
 value of DST; it can be said that TSH can select actually healthy people better than DST from the sample. Since the
  value of DST is higher than the
  value of TSH, we can conclude that DST is more efficient and has less error than TSH.When we have a look at the legitimacy of the test, we can see that both tests are legitimate. Since both Chi-square values are high and
  of both tests are smaller than alpha (
 ), we call both tests legitimate. Besides we see that
 , and
, and  parallel to
  and
and  values respectively.
Table 3. Measurements of the Quality of Diagnostic Tests
 |
| |
|
Table 4. Measurements Of The Legitimacy For Diagnostic Tests
 |
| |
|
Table 5. Probabilities and Conditional Probabilities of Disease Statement and Test Results for Diagnostic Tests
 |
| |
|
We see that PVP and PVN values on Table 3 are equal to  and
and  values on Table 5 respectively. On the condition that the test is positive, the possibility to diagnose the person as ill is higher for the TSH test; however, if the test is negative, the possibility to diagnose the person as healthy is higher for the DST test.
Table 6. Relations among Entropy, Conditional Entropy and Mutual Information
 |
| |
|
If we take the disease statement as the random variable, the random variable is indicated either as disease exists before diagnosis test or disease non-exists before diagnosis test. According to this situation the entropy of the disease is only affected with the possibility of disease existence or disease non-existence. Since these possibilities are equal in both tests, the entropy of the disease is the same. When we have a look at Table 6, the entropy value is the same but  values are different. According to the result of
 , DST provides more diagnostic information than TSH for value of P=0.6. Therefore DST dominates TSH.
Table 7. Table of Information Gain by Performing Diagnostic Tests
 |
| |
|
When we have a look at the results of Table 7, we firstly notice that the values of Negative Likelihood Ratio and the values of Positive Likelihood Ratios are different. If the value of the Negative Likelihood Ratio or the value of the Positive Likelihood Ratios were the same, two tests could not dominate each other[6].According to the results of Table 7, a positive test result provides more information than a negative test result for both tests when  is 0.6 (also
  is equal for both tests). The positive test result of TSH provides more information than the positive test result of DST. On the contrary, the negative result of DST provides more information than the negative result of TSH. Therefore, we can conclude that
  is related to
  and
and  is related to
 .Another result that can be deduced from Table 7 is the comparison of
  and
and  values.
  value is higher for TSH and TSH is the most specific diagnostic test to rule in disease (existence of the disease).
  value is higher for DST and DST is the most sensitive diagnostic test to rule out disease (non-existence of disease ) [7].
4. Discussion and Results
In recent years, for the evaluation of the diagnosis tests, in addition to the other methods, measures calculated according to the information theory have become important.In this study, it has been explained that how these measures are calculated for the diagnosis tests used in physic and the performances of two tests used for the diagnosis of the major depressive disorder are interpreted by calculating with these methods.It is aimed that this study will hopefully give various points of view to the researchers who want to make research on this subject by explaining how the tests used for the diagnosis of various diseases are evaluated with this way.
References
| [1] | Metz, C.E, Goodenough D.J, and Rossmann, K. Evaluation of receiver operating characteristic curve data in terms of information theory, with applications in radiography. Radiology. 1973;109: 297-303 |
| [2] | Mossman, D. and Somoza, E. Maximizing diagnostic information from the dexamethasone suppression test: An approach to criterion selection using receiver operating characteristic analysis. Archives of General Psychiatry. 1989; (46), 653-60 |
| [3] | Lee, W.C. Selecting Diagnostic Tests for Ruling Out or Ruling In Disease: The Use of the Kullback-Leibler distance. International Journal of Epidemiology. 1999; (28), 521-525 |
| [4] | Benish, W.A. The use of information graphs to evaluate and compare diagnostic tests. Methods Inf Med. 2002; (41), 114-118 |
| [5] | Cover, T.M. and Thomas, J.A. 2006. Elements of Information Theory 2nd Edition (Chapter 2: Entropy, relative Entropy, and Mutual Information), Page:13-22. New Jersey: John Wiley & Sons, Inc |
| [6] | Benish, W.A. Intuitive and axiomatic arguments for quantifying diagnostic test performance in units of information. Methods Inf Med. 2009; (48), 552-557 |
| [7] | Boyko, E.J. Ruling Out or Ruling In Disease with the Most Sensitive or Specific Diagnostic Test Short Cut or Wrong Turn? Medical Decision Making. 1994; (14), 175-179 |
 Abstract
 Reference
 Full-Text PDF
 Full-Text HTML