-
Paper Information
- Next Paper
- Paper Submission
-
Journal Information
- About This Journal
- Editorial Board
- Current Issue
- Archive
- Author Guidelines
- Contact Us
International Journal of Statistics and Applications
p-ISSN: 2168-5193 e-ISSN: 2168-5215
2011; 1(1): 1-5
doi: 10.5923/j.statistics.20110101.01
Modeling of Diabetic Patients Associated with Age: Polynomial Model Approach
 Abstract
 Reference
 Full-Text PDF
 Full-Text HTML
Md. Rafiqul Islam
Department of Population Science and Human Resource Development, Rajshahi University, Bangladesh
Correspondence to: Md. Rafiqul Islam , Department of Population Science and Human Resource Development, Rajshahi University, Bangladesh.
| Email: |  |
Copyright © 2012 Scientific & Academic Publishing. All Rights Reserved.
Diabetes mellitus is a set of diseases that involves troubles with the hormone insulin. It is characterized by chronic elevation of blood glucose level exceeding normal value. In this paper, an effort has been made to fit mathematical model to diabetic patients as well as its cumulative distribution for both sexes associated with age of in . For this purpose, the data have been taken from Noor (2008). In this study, an attempt has been given attention to show that the polynomial model is tried to fit to the distribution of diabetic patients associated with age as well as its cumulative distribution. It is found that the distribution of diabetic patients for both sexes associated with age follows bi-quadratic polynomial model. Moreover, it is investigated that cumulative distribution of diabetic patients follow cubic polynomial model. Cross validity prediction power is employed to the fitted model to verify the stability of the model in this manuscript.
Keywords: Distribution Of Diabetic Patients, Polynomial Model, Variance Explained (R2), Cross Validity Prediction Power (Cvpp), F-Test
Cite this paper: Md. Rafiqul Islam , "Modeling of Diabetic Patients Associated with Age: Polynomial Model Approach", International Journal of Statistics and Applications, Vol. 1 No. 1, 2011, pp. 1-5. doi: 10.5923/j.statistics.20110101.01.
Article Outline
1. Introduction
- Diabetes is a number of diseases that create problems with hormone insulin. Generally, the pancreas releases insulin to assist our body store and use the sugar and fat from the food that we eat. Diabetes, also familiar as Diabetes Mellitus, is a collection of metabolic disorders characterized by chronic hyperglycemia owing to relative insulin deficiency or resistance or both. Diabetes affects the body's ability as well as capacity to use blood sugar for energy. Diabetes affects people of all kinds of socio-economic conditions all over the present technological world. For this, in the era of globalization, an attention is given to concentrate to build mathematical model for the diabetic patients. In fact, mathematical model is a very realistic and sophisticated mechanism to express data in mathematical formulation. Mathematical models are actually of great useful to all discipline of applied knowledge in distinguishing important and unimportant variables. At last but not least, model is important for estimation, prediction as well as forecasting purposes. In this study, deterministic models are used to build up some mathematical relation between diabetic patients related to age of in . Conventionally, one can draw graphs for any event but it is very important to know what types of models are apt for that event. For this purpose,a polynomial model is chosen to apply for age association of diabetic patients. A brief discussion about polynomial model is addressed in the following that will be employed in various branches of health sciences:A general expression of the structure
 (Waerden, 1948)where
  indicates the constant term;
  represents the coefficient of
  (i =1, 2, 3, ..., n) but a1, a2,..., an are also constants. In addition to these constants belong to a field indicating a nonempty set in which group for addition, group for multiplication and left as well as right distributive law hold and n is the positive integer, is called a polynomial of degree n and the symbol x is called an indeterminate. An effort has been made here to find out what types of models are appropriate to the distribution of diabetic patients associated with age. Thus, the fundamental objectives of this study are briefly mentioned below:i) to build up mathematical models to the distribution of diabetic patients associated with age of Rajshahi City in Bangladesh, ii) to fit a mathematical model to the cumulative distribution of diabetic patients related to age of Rajshahi City in Bangladesh, and iii) to apply cross-validity prediction power (CVPP),
  , to the model to verify the stability of the model.This paper is mainly organized into five sections. First section is introduction and sources of data are included in second section. Section three contains materials and methods in which data smoothing, model fitting, model validation, shrinkage coefficient of the fitted model, F-test as well as velocity and acceleration curve of a function are briefly described here. Results of this study are narrated in section four. Lastly, section five concludes the discussion of this paper.
2. Sources of Data
- The data on the distribution of diabetic patients for both sexes (jointly male and female) associated with age of in have been taken from Noor (2008).
3. Materials and Methods
3.1. Data Smoothing
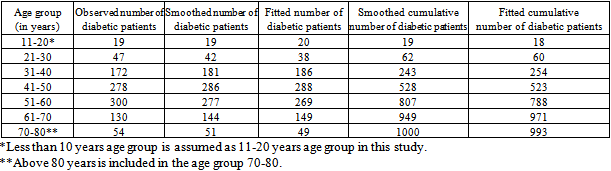
- Before going to fit mathematical model to the data set, first the data is plotted in the graph paper, then we see that there is some sort of distortions in the data set. It is unexpected. For this reason, to remove any anomalies in the data, the data is smoothed by Free Hand Curve Method. The smoothed data is demonstrated in Table 1 and thereafter, it is used to fit mathematical model to fulfill the objectives of this manuscript.
3.2. Model Fitting
- Using the scattered plot of the distribution of diabetic patients associated with age, it is observed that the distribution of diabetic patients can be fitted by polynomial model with respect to age. Therefore, an nth degree polynomial model is considered and the form of the model is
 where, x indicates mid value of age group; y represents distribution of diabetic patients associated with age ;
 is the constant;
  is the coefficient of
  (i =1, 2, 3, ..., n) and u is the stochastic error term of the model. Here a suitable n has been selected for which the error sum of square is minimum. The software STATISTICA was used to fit the mathematical model to this data aggregate.
 3.3. Model Validation
- To check the stability of the model, the cross validity prediction power(CVPP),
 , is applied. The formula for CVPP is given in the following
 where, n is the number of cases, k = the number of regressors in the model and the cross-validated R is the correlation between observed and predicted values of the dependent variable (Stevens, 1996). Islam (2003 and 2005) and Islam et al. (2003 and 2005) had employed CVPP as model validation or accuracy test of the fitted model.
3.4. Shrinkage Coefficient of the Model
- The shrinkage coefficient of the model is the absolute value of the difference of
 and R2. The stability of R2 of this model is equal to 1- shrinkage. The smaller quantity of the shrinkage value indicates the better fit of the model. Islam and Ali (2004) employed shrinkage coefficient as the better fit of the model.
3.5. F-test
- To verify the measure of the overall significance of the fitted model as well as the significance of R2, the F-test is employed to this model. The formula for F-test in mathematics is as follows:
 where k is the number of parameters to be estimated, n is the number of cases and R2 is the coefficient of determination in the model (Gujarati, 1998).
3.6. Velocity and Acceleration Curve of the Diabetic Patients
- Let any curve can be represented by y = f(x) in which x is argument and y is entry. Then, the velocity curve of y with respect to x is symbolized by
 and is defined by
  That is, the velocity is the rate of change of y with respect to x (Loney, 1990). Moreover, acceleration is defined by the rate of change of velocity due to age x. In this paper, the velocity and acceleration curve only for the fitted model of diabetic patients in terms of age are enumerated and depicted in Figure 3 and Figure 4 respectively in result and discussion section.
4. Results of This Study
- The polynomial model is assumed for the distribution of diabetic patients associated with age in and the fitted model is
 | (1) |
 = 0.994857. This is the polynomial of degree four, i.e. bi-quadratic polynomial model.The polynomial model is assumed for the cumulative distribution of diabetic patients associated with age of in and the fitted model is
 | (2) |
 = 0.999983 and shrinkage coefficient=0.00001414 . This is the polynomial of degree three, i.e. cubic polynomial model.From this statistics we see that the fitted models are highly cross-validated and their shrinkages are 0.004842857 and 0.00001414 for the models (1) and (2) respectively. These imply that both the fitted model is more than 99% stable. Moreover, all the parameters of the fitted model are highly statistically significant with exceeding 99% of variance explained. Moreover, the stability of R2 of these models is also more than 99%. In this study, the calculated values of F-statistics are 1666.2 and 9999 for the models (1) and (2) respectively, that is, which mean that both the fitted model is overall significant at 1% level. Therefore, from these statistics it is seen that the fitted model and corresponding R2 are highly statistically significant. As a result, both the models are better fit. Thereafter, the prediction is better done and the predicted values of the model are also demonstrated in the Table1. After the fitted model, velocity and acceleration curve are estimated only for the distribution of diabetic patients in terms of age and shown in Figure 3 and Figure 4 correspondingly.
|
 | Figure 1. Smoothed and fitted diabetic patients associated with age in Rajshahi City, Bangladesh |
 | Figure 2. Smoothed and fitted cumulative distribution of diabetic patients associated with age in Rajshahi City, Bangladesh |
 | Figure 3. The velocity curve for the fitted model of diabetic patients associated with age in Rajshahi City, Bangladesh |
 | Figure 4. The acceleration curve for the fitted model of diabetic patients associated with age in Rajshahi City, Bangladesh |
5. Conclusions
- In this paper, it is found that fourth degree polynomial model containing more than 99% variation is fitted to the distribution of diabetic patients associated with age of in . On the other hand, cumulative distribution of diabetic patients in accordance with age follow cubic polynomial model with explaining more than 99% variation. It should be noted that the usual models such as exponential model, Gompertz model, Makeham model and log-linear model were also applied for the distribution of diabetic patients and cumulative distribution of diabetic patients but seems to be worse fitted with respect to their coefficient of determination as well as shrinkage coefficients. Therefore, the results of these models were not shown here.
ACKNOWLEDGEMENTS
- I heartily thanks to Behzad Noor for submitting the M. Sc. thesis to the Dept. of Population Science and Human Resource Development, .