-
Paper Information
- Paper Submission
-
Journal Information
- About This Journal
- Editorial Board
- Current Issue
- Archive
- Author Guidelines
- Contact Us
International Journal of Sports Science
p-ISSN: 2169-8759 e-ISSN: 2169-8791
2025; 15(1): 21-29
doi:10.5923/j.sports.20251501.03
Received: Jun. 3, 2025; Accepted: Jul. 1, 2025; Published: Jul. 25, 2025

Validity of Repetitions to Failure to Estimate and Track Changes in Leg Extension One-Repetition Maximum
 Abstract
 Reference
 Full-Text PDF
 Full-text HTML
Justin S. Pioske, Jocelyn E. Arnett, Dolores G. Ortega, Trevor D. Roberts, Richard J. Schmidt, Terry J. Housh
Department of Nutrition and Health Sciences, University of Nebraska Lincoln, Lincoln, NE 68583, USA
Correspondence to: Justin S. Pioske, Department of Nutrition and Health Sciences, University of Nebraska Lincoln, Lincoln, NE 68583, USA.
| Email: |  |
Copyright © 2025 The Author(s). Published by Scientific & Academic Publishing.
This work is licensed under the Creative Commons Attribution International License (CC BY).
http://creativecommons.org/licenses/by/4.0/

Equations utilizing repetitions-to-failure and submaximal weights offer an alternative to direct one-repetition maximum (1RM) testing, but limited data exist regarding their validity in tracking training-induced changes in lower-body 1RM. Therefore, this study aimed to cross-validate 5 equations for estimating pre-training, post-training, and training-induced changes in leg extension 1RM. Twenty-eight recreationally active men (mean ± SD: age = 20.46 ± 1.38 yrs; body mass = 84.77 ± 12.46 kg) trained 3 days per week for 8 weeks, performing one set of bilateral leg extension to failure at ≥ 80% 1RM. Direct 1RM values were measured at pre- and post-training. The repetitions-to-failure and training weight from the first and last training sessions were used to estimate 1RM. Cross-validation analyses included the constant error, correlation coefficient, standard error of estimate, and total error. Training significantly increased (p < 0.001) leg extension 1RM (21.87 ± 8.93kg) and training weight (23.08 ± 7.61 kg) but not repetitions-to-failure (0.64 ± 3.09 repetitions, p = 0.281). The total error at pre- (5.09 kg) and post-training (5.04 kg) were lowest for equation 4 ([RTF0.1·W] + 1.0) and equation 2 (-0.46 + [0.79·RTF] + [1.08·W]), respectively. All equations, however, exhibited high total error values (7.16 to 14.29 kg) for estimating increases in leg extension 1RM. Therefore, separate equations may be appropriate for estimating pre- and post-training 1RM, but none are recommended for assessing changes over time.
Keywords: Prediction, Error, Cross-validation, Resistance Training, Strength
Cite this paper: Justin S. Pioske, Jocelyn E. Arnett, Dolores G. Ortega, Trevor D. Roberts, Richard J. Schmidt, Terry J. Housh, Validity of Repetitions to Failure to Estimate and Track Changes in Leg Extension One-Repetition Maximum, International Journal of Sports Science, Vol. 15 No. 1, 2025, pp. 21-29. doi: 10.5923/j.sports.20251501.03.
Article Outline
1. Introduction
- Increasing muscular strength through resistance training is considered an essential component of physical health and fitness [1]. Greater muscular strength is associated with improved physical ability of daily activities [2,3] and reduced risk of all-cause mortality [4,5]. The one-repetition maximum (1RM) is the most commonly used method to assess dynamic constant external resistance (DCER) muscular strength and is defined as the maximal amount of weight that can be lifted against gravity in a single repetition through a full range of motion [6,7]. In addition, the 1RM assessment can be used to monitor training-induced changes in muscular strength following a DCER training program [8–11]. Having athletes perform frequent 1RM assessments for multiple muscle groups, however, can be impractical for some practitioners. For example, 1RM testing is a trial-and-error method that involves multiple submaximal, maximal, and supramaximal repetitions which can consume a large amount of time [6,12–14], accumulate unwanted fatigue that can lead to a potential injury [15–17], and undermine the amount of time and effort devoted to training [7,11]. Therefore, an alternative to 1RM testing is to use equations (EQs) that estimate 1RM from repetitions to failure (RTF) performed at a submaximal weight [7,11,12,18–21].A number of regression EQs have been developed [13,21–32] to estimate 1RM values from RTF with submaximal weights ranging from 20-95% of 1RM for a variety of specific movements [21,23,25,26,29,31,33–35]. In addition, generic EQs have been developed that are not limited to a specific movement and can be utilized for a variety of different movements [22,24,27,28,30,32]. In some cases, however, the derivation studies of these generic EQs provided limited information regarding the sample characteristics (i.e. years of resistance training experience) and/or the derivation methodology (i.e. equipment, number of RTF, and weight used), making it difficult to determine their external validity. Previous studies have used cross-validation procedures to quantify the accuracy of EQs to estimate 1RM values on independent samples of subjects [9,12,14,17,19,29,36]. These studies examined the validity of the EQs using correlation coefficients and constant error values (CE = mean difference between estimated and measured 1RM values). In general, the EQs that most accurately estimated a single assessment of 1RM exhibited correlation coefficients and CE values of approximately 0.85 to 0.99 and -0.9 kg to 2.1 kg, respectively. Few studies, however, have included total error (TE) values to determine the validity of these EQs [17,18,21,37]. The TE represents the true difference between estimated and measured 1RM and is the single best criterion for quantifying the prediction error [21,38–41]. Cross-validation studies, therefore, should also include the TE when determining the validity of EQs in estimating 1RM values from a single assessment. If EQs are to be used as an alternative to the direct assessment of 1RM [11], their external validity would be increased if they demonstrated a high degree of validity for estimating 1RM values before and after training. Braith et al. [23] reported, however, that separate linear EQs were required to accurately estimate pre- and post-training leg extension (Leg Ex) 1RM with 7-10 RTF. Previous studies that have examined the predictive ability of these EQs across a resistance training intervention [8–10,16,23,42] have reported inconsistent findings due to factors such as the movement performed (i.e. upper versus lower body, the number of muscle groups involved), the sample characteristics (i.e. gender, years of resistance training experience, etc.), the methodology used (i.e. number of RTF and weight used), and the type of EQ (i.e. exponential versus linear). Brechue and Mayhew [8,9] and Mayhew et al. [16] reported estimations within ± 5% of measured post-training bench press and squat 1RM values with submaximal weights between 80% and 90% compared to approximately ± 12% for weights between 60% and 80% of 1RM using exponential EQs. Thus, previous reports [8–10,16,42] have recommended the use of submaximal weights that are greater than 80% of 1RM for accurately estimating post-training 1RM values regardless of the type of EQ used. It is possible that a change in relationship between the RTF and training weight during a resistance training program influences the accuracy of the EQs for estimating training-induced changes in 1RM [23,43]. Few studies [8,16,42] have investigated if EQs can accurately track the training-induced changes in bench press 1RM values, and only Roberts et al. [10] investigated their predictive ability for estimating training-induced changes in 1RM for the lower body (i.e. Leg Ext). Roberts et al. [10], however, used submaximal weights between 33.9 and 75.8% of post-training 1RM to estimate post-training and training-induced changes in 1RM, resulting in large TE values (21.9 kg to 39.1 kg and 21.0 kg to 31.9 kg, respectively). Therefore, the purpose of this study was to cross-validate 5 EQs for estimating pre-training, post-training, and absolute training-induced changes in Leg Ext 1RM with RTF weights that are ≥ 80% of 1RM. Based on previous studies [8,9,16,42], it was hypothesized that the EQs would accurately track training-induced changes in Leg Ext 1RM.
2. Methods
2.1. Subjects
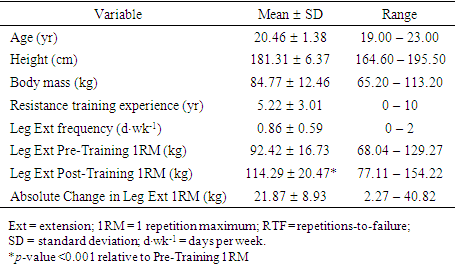
- Thirty-five men volunteered to participate in the present study. Seven of the volunteers, however, voluntarily withdrew due to reasons unrelated to the study. Therefore, twenty-eight men (mean ± SD: age = 20.46 ± 1.38 yrs; height = 181.31 ± 6.37 cm; body mass = 84.77 ± 12.46 kg) completed this study (Table 1). Prior to participating the study, all subjects reported no lower body pathologies that would affect their Leg Ext performance. The subjects were recreationally active [44] and reported participating in the following activities for a minimum of 1 day per week prior to the start of the study: Resistance training (n = 23), aerobic training (n = 23), running (n = 2), swimming (n = 1), biking (n = 2), flag football (n = 2), basketball (n = 6), volleyball (n = 3), softball (n = 1), broomball (n = 1), and yard work (n = 1). Most subjects had previous resistance training experience (experience = 5.22 ± 3.01 yrs) and included the Leg Ext movement in their exercise rotation (0.86 ± 0.59 days per week; Table 1). The subjects were informed of the benefits and risks of participation in the study, signed a written Informed Consent form, and completed a Health History Questionnaire. The ethical principles in the present study were approved by an institution affiliated with one of the authors.
|
2.2. Study Design
- The subjects visited the laboratory on 26 occasions over a 10-week period. During the first visit, demographic information was collected, the subjects were familiarized with the resistance training procedures, and their pre-training bilateral Leg Ext 1RM was assessed. The subjects then began the 8-week bilateral Leg Ext DCER training program which included 24 training sessions each separated by a minimum of 24 hours. The resistance training sessions consisted of 2 warm-up sets of 8 repetitions and 1 working set of RTF at approximately 80% of 1RM. At least 48 hours after the last training session, the subject’s post-training bilateral Leg Ext 1RM was assessed. The present study cross-validated five EQs to estimate pre-training, post-training, and absolute training-induced changes in bilateral Leg Ext 1RM using the weight and RTF values from the first and last training sessions.
2.3. One-Repetition Maximum
- The bilateral Leg Ext 1RM test was performed on a plate-loaded Hammer Strength Iso-Lateral resistance machine (Hammer Strength, Cincinnati, OH). Before testing, the subject’s maximal Leg Ext range of motion was determined using a ruler fastened to an adjustable tripod (Figure 1). While the subject’s legs were fully extended, an investigator adjusted the height of the tripod to contact the shin pad bar of the Leg Ext machine. The height of the ruler was recorded and used to standardize the subject’s range of motion for all testing and training visits. The 1RM testing protocol followed the guidelines established by the National Strength and Conditioning Association for lower body movements [45]. The warm-up included one set of 5-10 repetitions with a light weight, a second set with a heavier weight that would result in 3-5 repetitions, and a third set with a near maximal weight that could be completed in 2-3 repetitions. The subjects were given 1-2 minutes of rest between each warm-up set and 2-4 minutes of rest between the last warm-up set and the first 1RM attempt. The first 1RM attempt was performed with a 13.6-18.1 kg increase in weight from the final warm-up set. If the subsequent 1RM attempt were successful, the weight was increased by 13.6-18.1 kg. If an attempt was unsuccessful, the weight was decreased by 4.5-6.8 kg. The weight was increased or decreased by an investigator until the subjects successfully completed a 1RM, and the smallest change in weight possible between attempts was 2.3 kg. The determination of 1RM typically required 3-5 attempts each separated by 2-4 minutes of rest. The subjects were given strong verbal encouragement by the investigators during all 1RM attempts. The 1RM attempts were considered successful if the subject reached full extension as determined by the ruler fastened to the tripod.
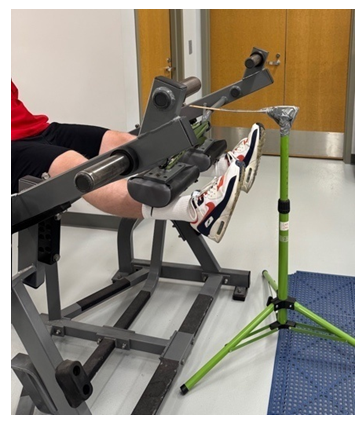 | Figure 1. The leg extension set up for testing and training |
2.4. Resistance Training
- The Leg Ext DCER training visits were performed 3 days per week for 8 weeks. The training visits consisted of 2 warm-up sets and 1 working set to failure. The two warm-up sets consisted of 8 repetitions at approximately 50% and 70% of the pre-training 1RM and the single working set consisted of RTF at approximately 80% of the subject’s pre-training 1RM. To ensure the subjects reached their maximum number of repetitions, strong verbal encouragement was given by an investigator and 2-5 minutes of rest was allowed between sets. A repetition was considered successful if that the shin pad bar contacted the ruler. The task was terminated when the subjects could no longer contact the ruler with the shin pad bar for 2 consecutive repetitions or when the subjects voluntarily decided to end the task. The weight adjustment for subsequent training sessions depended on the number of repetitions completed during the working set. If the subject completed 8-9 or ≥ 10 RTF, the weight for the warm-up and working sets was increased by 2.3 or 4.5 kg, respectively. If the subjects completed ≤ 7 RTF, however, the weight for the subsequent training session remained unchanged for the warm-up and working sets.
2.5. Equations for Estimating One Repetition Maximum
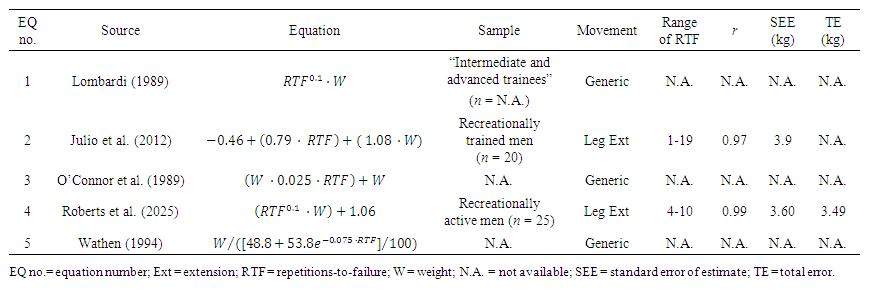
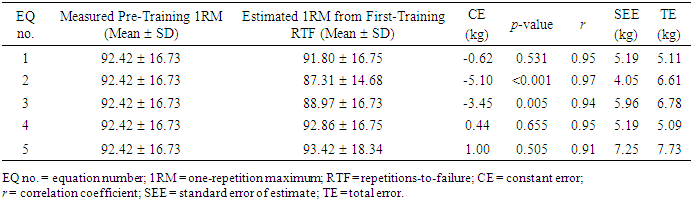
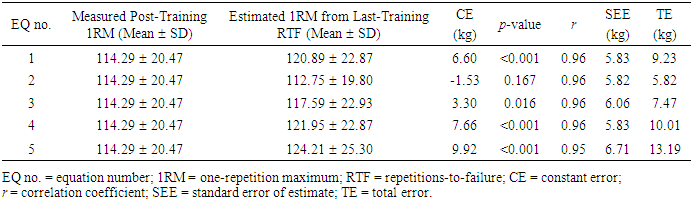
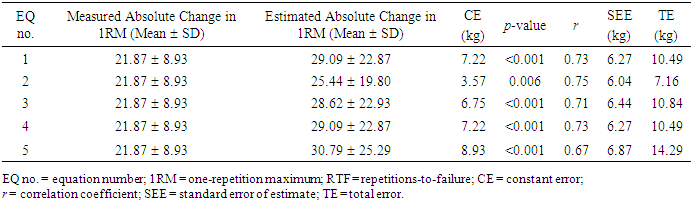
- The EQs in the present study were selected based on the findings from two recent cross-validation studies [10,21] specific to the Leg Ext movement. Of the 8 EQs cross-validated by these studies [10,21], 5 EQs [21,26,28,30,32] met the inclusion criteria of a TE value less than 15 kg. The EQs in the present study (Table 2) used either a linear model (EQs 2 and 3) or an exponential model (EQs 1, 4, and 5) to estimate 1RM values from RTF. Of the 5 EQs, only EQ 2 [26] was derived specifically from the Leg Ext movement, while EQs 1, 3, and 5 are generic EQs and not limited to a specific movement (Table 2). Equation 4 was derived by adding the cross-validation constant error (CE = mean difference between estimated and measured 1RM values) from Roberts et al. [21] to the y-intercept of the original EQ of Lombardi [28] (EQ 1) based on the recommendation of Lohman [46].
 | Table 2. The equations used in the cross-validation analyses and derivation methodologies |
2.6. Statistical Analysis
- The pre-training to post-training absolute changes in the measured Leg Ext 1RM as well as the RTF weight, the RTF weight as a % of pre-training 1RM, and number of RTF values from the first and last training session were analyzed with paired t-tests. Estimated pre-training 1RM, estimated post-training 1RM, and estimated absolute training-induced changes in 1RM values were statistically cross-validated by examining the CE values using paired t-tests, Pearson Correlation Coefficients (r), standard error of estimates (SEE), and TE values using the following equation:
 | (1) |
3. Results
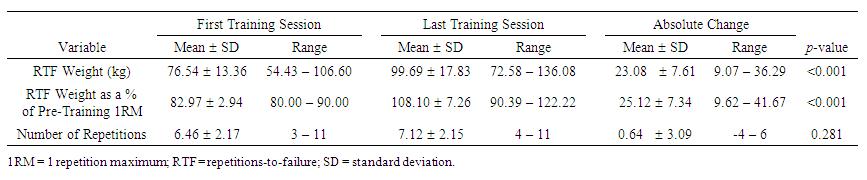
- The subjects completed an average of 22 (91.20 ± 6.36%) of the 24 training visits, with a range of 20-24 (83.33 to 100%) visits completed. The subjects’ pre-training, post-training, and absolute training-induced changes in Leg Ext 1RM are presented in Table 1. The absolute changes in the RTF weight (23.08 ± 7.61 kg), RTF weight as a % of pre-training 1RM (25.12 ± 7.34%), and number of RTF (0.64 ± 3.09 repetitions) are presented in Table 3. There was a significant increase (p < 0.001) in absolute Leg Ext 1RM from pre-training (92.42 ± 16.73 kg) to post-training (114.29 ± 20.47 kg). The RTF weight and the RTF weight as a % of pre-training 1RM increased significantly (p < 0.001) from the first-training session (76.57 ± 13.36 kg and 82.97 ± 2.94%, respectively) to the last-training session (99.69 ± 17.83 kg and 108.10 ± 7.26%, respectively), while the number of RTF were not different (p = 0.281) between the first and last training sessions (6.46 ± 2.17 repetitions and 7.12 ± 2.15 repetitions, respectively).
 | Table 3. Leg Extension Performance Characteristics of the Subjects (n = 28) |
|
|
4. Discussion
- The purpose of this study was to use cross-validation procedures to determine the accuracy of 5 EQs for estimating pre- and post-training Leg Ext 1RM values from the weights performed and RTF during the first- and last-training sessions and quantify the error for estimating training-induced changes in 1RM from the EQs in recreationally active men. In the present study, the mean pre-training Leg Ext 1RM normalized to body mass ([92.42 kg / 84.77 kg] x 100 = 109%) was less than that reported by Roberts et al., [10] for an independent sample of recreationally active men (155%). In addition, the 8 weeks of Leg Ext DCER training in the present study resulted in a 23.66% mean increase in Leg Ext 1RM which was comparable to the study of Roberts et al. [10] that reported an increase of 27.27% following an 8-week Leg Ext DCER training protocol.In the present study, the mean values for the estimated pre-training 1RM from EQs 2 and 3 differed significantly from the mean measured pre-training 1RM, while EQs 1, 4, and 5 exhibited no mean differences between the estimated and measured pre-training 1RM (Table 4). These findings were not consistent with those of previous cross-validation studies for the Leg Ext movement [10,21,37]. For example, previous studies [10,21,37] have reported that EQ 5 overestimated the mean measured pre-training 1RM (CE = 3.61 to 10.2 kg). The differences between the results of the present study and those of Wood et al. [37] may be attributable to age (54.22 ± 3.12 yrs) related differences in muscular strength and endurance [49,50] compared to the sample in the present study (20.46 ± 1.38 yrs). The findings of Roberts et al. [10,21], however, may be attributable to the greater number of RTF performed (4-17 repetitions and 4-21 repetitions, respectively) compared to the present study (3-11 repetitions). The improved accuracy from the range of RTF performed in the present study, compared to that of Roberts et al. [10], was consistent with previous studies [8,9,16,17,43,51] that have reported more accurate estimations of 1RM with lower (≤ 10) rather than higher RTF ranges for lower and upper body movements. In addition, all EQs in the present study exhibited very strong correlations (r = 0.91 to 0.97) between the estimated and measured pre-training Leg Ext 1RM values, which were consistent with previous cross-validation studies for lower body strength exercises including the squat, deadlift, and Leg Ext [10,12,21,37]. Furthermore, in the present study, EQs 1 and 4, demonstrated small differences between the SEE and TE values (0.08 kg and 0.10 kg, respectively), with EQ 4 exhibiting the lowest TE value of 5.09 kg (Table 4). This TE accounted for 5.50% of the mean pre-training 1RM (92.42 kg) and, therefore, EQ 4 provided the most accurate estimates of pre-training Leg Ext 1RM. For the post-training estimates (Table 5), four of the five EQs (EQs 1, and 3-5) overestimated the mean measured post-training Leg Ext 1RM with CE values that ranged from 3.30 kg (EQ 3) to 9.92 kg (EQ 5). There was no mean difference, however, for EQ 2 for the post-training Leg Ext 1RM estimations with a CE value of -1.53 kg. All the EQs exhibited very strong correlations (r = 0.95 to 0.96) between the estimated and measured 1RM values (Table 5). In addition, the SEE and TE values ranged from 5.82 kg (EQ 2) to 6.71 kg (EQ 5) and 5.82 kg (EQ 2) to 13.19 kg (EQ 5), respectively. These findings were not consistent with those of Roberts et al. [10] who reported that EQs 1-3 underestimated the post-training Leg Ext 1RM values (CE = -35.6 kg to -9.4 kg and TE = 21.9 kg to 39.1 kg) following 8 weeks of resistance training. It is likely that the lower TE values in the present study, compared to those of Roberts et al., [10], can be explained by the weights and number of RTF used to estimate the post-training 1RM values. The weights used to estimate post-training Leg Ext 1RM values in the present study ranged from 90.39% to 122.22% of pre-training 1RM and resulted in 4-11 RTF, while Roberts et al. [10] reported using 80.0-83.3% of pre-training 1RM (equivalent to 33.9% to 73.8% of post-training 1RM) and resulted in 11-37 RTF. The improved accuracy in the present study, compared to that of Roberts et al. [10], supported previous reports [8,9,17,18,43,51] of greater accuracy in estimating 1RM values when using heavier weights (≥ 80% of 1RM) that result in fewer RTF (≤ 10) than those that used lighter weights and greater RTF. Furthermore, in the present study, the TE values expressed as a percentage of the mean measured post-training 1RM (114.29 kg) were greater for all the EQs, except for EQ 2, when compared to their respective pre-training estimates of 1RM (Table 4). Specifically, EQ 2 demonstrated a lower TE value equivalent to 5.09% of the mean measured post-training 1RM (114.29 kg) versus 7.15% of the mean measured pre-training 1RM (92.42 kg). Thus, 4 of the 5 EQs in the present study, demonstrated greater error for estimating the post-training 1RM than the pre-training 1RM. Eight weeks of Leg Ext DCER training in the present study resulted in a mean increase of 21.87 kg (23.66%) in Leg Ext 1RM and the subjects were able to complete a greater percentage of 1RM from the first training session (82.97 ± 2.94%) to the last training session (87.41 ± 5.28%), with no difference in RTF (3-11 and 4-11 repetitions, respectively). For estimating the absolute training-induced increases in Leg Ext 1RM, all the EQs overestimated (CE = 3.57 kg to 8.93 kg) the mean measured training-induced increases. Furthermore, the SEE values ranged from 6.04 kg (EQ 2) to 6.87 kg (EQ 5) and TE values ranged from 7.16 kg (EQ 2) to 14.29 kg (EQ 5). All of the EQs demonstrated strong relationships (r = 0.67 to 0.75) between the mean estimated and measured absolute training-induced increases in Leg Ext 1RM values, and the TE values relative to the mean measured absolute increase in 1RM value (21.87 kg) ranged from 32.74% to 65.36%. The results of the present study were not consistent with those of Roberts et al. [10], who reported TE values of 69.36% to 94.23% (relative to the measured absolute change in 1RM of 34.6 kg), likely due to the lighter post-training RTF weights (33.9% to 73.8% of 1RM) used in the EQs. Therefore, the present findings suggested that performing RTF with weights that are greater than 80% of 1RM can reduce the error associated with estimating the training-induced increases in Leg Ext 1RM. Despite the reduced error observed with weights greater than 80% of 1RM, none of the EQs in the present study accurately estimated the training-induced increases in Leg Ext 1RM following 8 weeks of resistance training. The inability of the EQs to accurately estimate the training-induced increases in 1RM can be explained by comparing each EQ’s post-training estimated values to their respective pre-training estimated values. The EQs in the present study that did not demonstrate similar accuracy for estimating pre- and post-training 1RM resulted in large errors for estimating the training-induced increases in 1RM (Table 6). In the present study, a greater proportion of subjects achieved or surpassed the target of 8 repetitions during the last training session (53.57%) at ~90% of 1RM compared to the first training session (39.29%) at ~80% of 1RM. It is likely that a change in the relationship between RTF and training weight from the first to last training session may have affected the accuracy of the EQs for estimating post-training Leg Ext 1RM and, therefore, the training-induced increases in Leg Ext 1RM. Future studies are needed to examine the effect of resistance training interventions with a lower repetition target (e.g., 3-5 repetitions) on the relationship between RFT and training weight as well as the predictive ability for linear and exponential EQs to estimate post-training and training-induced increases in 1RM. The results of this study were limited to young, recreationally active men and the bilateral Leg Ext movement. Thus, the current findings cannot be extrapolated to men in different age groups, women, or other movements. Future studies are needed to examine the validity of previously published EQs for estimating upper and lower body 1RM in these populations and for various movements. Furthermore, the current study utilized the Hammer Strength (Hammer Strength, Cincinnati, OH) Leg Ext machine and it is unknown if the current findings would be replicated using other equipment.
5. Conclusions
- The findings of the present study indicated that EQ 4 most accurately estimated pre-training Leg Ext 1RM, while EQ 2 provided the most accurate estimate of post-training 1RM. None of the EQs, however, accurately quantified the absolute training-induced increase in Leg Ext 1RM. Therefore, it is recommended that EQ 4 be used to estimate pre-training 1RM and EQ 2 for post-training 1RM in young, recreationally active men for the bilateral Leg Ext movement. None of the EQs, however, were suitable for assessing training-induced increases in Leg Ext 1RM.
ACKNOWLEDGEMENTS
- The authors would like to thank the subjects for their participation in this study.
References
| [1] | Garber CE, Blissmer B, Deschenes MR, Franklin BA, Lamonte MJ, Lee I-M, et al. Quantity and Quality of Exercise for Developing and Maintaining Cardiorespiratory, Musculoskeletal, and Neuromotor Fitness in Apparently Healthy Adults: Guidance for Prescribing Exercise. Medicine & Science in Sports & Exercise 2011; 43: 1334–59. https://doi.org/10.1249/MSS.0b013e318213fefb. |
| [2] | Brill PA, Macera CA, Davis DR, Blair SN, Gordon N. Muscular strength and physical function. Med Sci Sports Exerc 2000; 32: 412–6. https://doi.org/10.1097/00005768-200002000-00023. |
| [3] | Hairi NN, Cumming RG, Naganathan V, Handelsman DJ, Le Couteur DG, Creasey H, et al. Loss of Muscle Strength, Mass (Sarcopenia), and Quality (Specific Force) and Its Relationship with Functional Limitation and Physical Disability: The Concord Health and Ageing in Men Project. Journal of the American Geriatrics Society 2010; 58: 2055–62. https://doi.org/10.1111/j.1532-5415.2010.03145.x. |
| [4] | García-Hermoso A, Cavero-Redondo I, Ramírez-Vélez R, Ruiz JR, Ortega FB, Lee D-C, et al. Muscular Strength as a Predictor of All-Cause Mortality in an Apparently Healthy Population: A Systematic Review and Meta-Analysis of Data From Approximately 2 Million Men and Women. Archives of Physical Medicine and Rehabilitation 2018; 99: 2100–13. https://doi.org/10.1016/j.apmr.2018.01.008. |
| [5] | Saeidifard F, Medina-Inojosa JR, West CP, Olson TP, Somers VK, Bonikowske AR, et al. The association of resistance training with mortality: A systematic review and meta-analysis. European Journal of Preventive Cardiology 2019; 26: 1647–65. https://doi.org/10.1177/2047487319850718. |
| [6] | Brown L E, Weir JP. ASEP Procedures Recommendation I: Accurate Assessment of Muscular Strength and Power. Journal of Exercise Physiology 2001; 4: 1–21. |
| [7] | Suchomel TJ, Nimphius S, Stone MH. The Importance of Muscular Strength in Athletic Performance. Sports Med 2016; 46: 1419–49. https://doi.org/10.1007/s40279-016-0486-0. |
| [8] | Brechue WF, Mayhew JL. Upper-body work capacity and 1RM prediction are unaltered by increasing muscular strength in college football players. J Strength Cond Res 2009; 23: 2477–86. https://doi.org/10.1519/JSC.0b013e3181b1ae5f. |
| [9] | Brechue WF, Mayhew JL. Lower-body work capacity and one-repetition maximum squat prediction in college football players. J Strength Cond Res 2012; 26: 364–72. https://doi.org/10.1519/JSC.0b013e318225eee3. |
| [10] | Roberts TD, Smith RW, Arnett JE, Ortega DG, Pioske JS, Schmidt RJ, et al. Cross-validation of Equations for Estimating Pre-training, Post-training, and Training-induced Changes in Leg Extension 1-Repetition Maximum. American Journal of Sports Science and Medicine 2024; 12: 29–35. https://doi.org/10.12691/ajssm-12-2-2. |
| [11] | Suchomel TJ, Nimphius S, Bellon CR, Hornsby WG, Stone MH. Training for Muscular Strength: Methods for Monitoring and Adjusting Training Intensity. Sports Med 2021; 51: 2051–66. https://doi.org/10.1007/s40279-021-01488-9. |
| [12] | LeSuer DA, McCormick JH, Mayhew JL, Wasserstein RL, Arnold MD. The Accuracy of Prediction Equations for Estimating 1-RM Performance in the Bench Press, Squat, and Deadlift. The Journal of Strength & Conditioning Research 1997; 11: 211–3. |
| [13] | Mayhew JL, Ball TE, Arnold MD, Bowen JC. Relative Muscular Endurance Performance as a Predictor of Bench Press Strength in College Men and Women. The Journal of Strength & Conditioning Research 1992;6:200–6. |
| [14] | Whisenant MJ, Panton LB, East WB, Broeder CE. Validation of submaximal prediction equations for the 1 repetition maximum bench press test on a group of collegiate football players. J Strength Cond Res 2003; 17: 221–7. https://doi.org/10.1519/1533-4287(2003)017<0221:vospef>2.0.co;2. |
| [15] | Bengtsson V, Berglund L, Aasa U. Narrative review of injuries in powerlifting with special reference to their association to the squat, bench press and deadlift. BMJ Open Sport Exerc Med 2018; 4: e000382. https://doi.org/10.1136/bmjsem-2018-000382. |
| [16] | Mayhew JL, Johnson BD, Lamonte MJ, Lauber D, Kemmler W. Accuracy of prediction equations for determining one repetition maximum bench press in women before and after resistance training. J Strength Cond Res 2008; 22: 1570–7. https://doi.org/10.1519/JSC.0b013e31817b02ad. |
| [17] | Ware JS, Clemens CT, Mayhew JL, Johnston TJ. Muscular Endurance Repetitions to Predict Bench Press and Squat Strength in College Football Players. The Journal of Strength & Conditioning Research 1995; 9: 99–103. |
| [18] | Mayhew JL, Prinster JL, Ware JS, Zimmer DL, Arabas JR, Bemben MG. Muscular endurance repetitions to predict bench press strength in men of different training levels. J Sports Med Phys Fitness 1995; 35: 108–13. |
| [19] | Mayhew JL, Kerksick CD, Lentz D, Ware JS, Mayhew DL. Using Repetitions to Fatigue to Predict One-Repetition Maximum Bench Press in Male High School Athletes. Pediatric Exercise Science 2004; 16: 265–76. https://doi.org/10.1123/pes.16.3.265. |
| [20] | Ribeiro A, Silva JA da, Nascimento M, Martinho D, Santos L dos, Salles B de, et al. Accuracy of 1RM Prediction Equations Before and After Resistance Training in Three Different Lifts. International Journal of Strength and Conditioning 2024; 4: 1570–7. https://doi.org/10.47206/ijsc.v4i1.327. |
| [21] | Roberts TD, Smith RW, Arnett JE, Ortega DG, Schmidt RJ, Housh TJ. Cross-Validation of Equations for Estimating 1 Repetition Maximum From Repetitions to Failure for the Bench Press and Leg Extension. J Strength Cond Res 2025; 39: 96–105. https://doi.org/10.1519/JSC.0000000000004987. |
| [22] | Beam W, Adams G. Exercise Physiology Laboratory Manual. 9th ed. New York, NY: McGraw-Hill Education; 2019. |
| [23] | Braith RW, Graves JE, Leggett SH, Pollock ML. Effect of training on the relationship between maximal and submaximal strength. Medicine & Science in Sports & Exercise 1993; 25: 132. |
| [24] | Brzycki M. Strength Testing—Predicting a One-Rep Max from Reps-to-Fatigue. Journal of Physical Education, Recreation & Dance 1993; 64: 88–90. https://doi.org/10.1080/07303084.1993.10606684. |
| [25] | Dohoney P, Chromiak JA, Lemire D, Abadie BR, Kovacs C. Prediction of one repetition maximum (1-RM) strength from a 4-6 RM and a7-10 RM submaximal strength test in healthy young adult males. Journal of Exercise Physiology Online 2002; 5: 54–9. |
| [26] | Julio U, Panissa V, Franchini E. Prediction of one repetition maximum from the maximum number of repetitions with submaximal loads in recreationally strength-trained men. Science & Sports 2012; 27: 69–76. https://doi.org/10.1016/j.scispo.2012.07.003. |
| [27] | Lander J. Maximum based on reps. National Strength & Conditioning Association Journal 1984; 6: 60–1. |
| [28] | Lombardi VP. Predicting Maximum Lifts. Beginning Weight Training: The Safe and Effective Way, Dubuque, IA: W.C. Brown; 1989, p. 201–4. |
| [29] | Macht JW, Abel MG, Mullineaux DR, Yates JW. Development of 1RM Prediction Equations for Bench Press in Moderately Trained Men. J Strength Cond Res 2016; 30: 2901–6. https://doi.org/10.1519/JSC.0000000000001385. |
| [30] | O’Connor R, Simmons J, O’Shea P. How to Get What You Want from Weight Training. Weight Training Today. 1st ed., Egan, MN: West; 1989, p. 6–14. |
| [31] | Reynolds JM, Gordon TJ, Robergs RA. Prediction of one repetition maximum strength from multiple repetition maximum testing and anthropometry. J Strength Cond Res 2006; 20: 584–92. https://doi.org/10.1519/R-15304.1. |
| [32] | Wathen D. Load Assignment. Essentials of Strength Training and Conditioning, Champaign, IL: Human Kinetics; 1994, p. 436–9. |
| [33] | Abadie BR, Altorfer GL, Schuler PB. Does a Regression Equation to Predict Maximal Strength in Untrained Lifters Remain Valid When the Subjects Are Technique Trained? The Journal of Strength & Conditioning Research 1999; 13: 259–63. |
| [34] | Cummings B, Finn KJ. Estimation of a One Repetition Maximum Bench Press for Untrained Women. The Journal of Strength & Conditioning Research 1998; 12: 262. |
| [35] | Desgorces FD, Berthelot G, Dietrich G, Testa MSA. Local muscular endurance and prediction of 1 repetition maximum for bench in 4 athletic populations. J Strength Cond Res 2010; 24: 394–400. https://doi.org/10.1519/JSC.0b013e3181c7c72d. |
| [36] | Ribeiro Neto F, Guanais P, Dornelas E, Coutinho ACB, Costa RRG. Validity of one-repetition maximum predictive equations in men with spinal cord injury. Spinal Cord 2017; 55: 950–6. https://doi.org/10.1038/sc.2017.49. |
| [37] | Wood T, Maddalozzo G, Harter R. Accuracy of Seven Equations for Predicting 1RM Performance of Apparently Healthy, Sedentary Older Adults. Measurement in Physical Education and Exercise Science 2002; 6: 67–94. https://doi.org/10.1207/S15327841MPEE0602_1. |
| [38] | Housh DJ, Housh TJ, Weir JP, Stout JR, Weir LL, Johnson GO. Cross-Validation of Equations for Predicting Isokinetic Peak Torque in Men. Isokinetics and Exercise Science 1994;4:146–9. https://doi.org/10.3233/IES-1994-4404. |
| [39] | Katch FI, and Katch VL. Measurement and Prediction Errors in Body Composition Assessment and the Search for the Perfect Prediction Equation. Research Quarterly for Exercise and Sport 1980; 51: 249–60. https://doi.org/10.1080/02701367.1980.10609286. |
| [40] | Lohman TG. Skinfolds and Body Density and Their Relation to Body Fatness: A Review. Human Biology 1981; 53: 181–225. |
| [41] | Sinning WE, Dolny DG, Little KD, Cunningham LN, Racaniello A, Siconolfi SF, et al. Validity of “generalized” equations for body composition analysis in male athletes. Med Sci Sports Exerc 1985; 17: 124–30. |
| [42] | Roberts TD, Smith, Robert W., Arnett ,Jocelyn E., Ortega, Dolores G., Pioske, Justin S., Schmidt, Richard J., et al. Accuracy of Estimating Pre-Training, Post-Training, and Training-Induced Changes in Bench Press 1-Repetition Maximum. Measurement in Physical Education and Exercise Science 2025; 0: 1–10. https://doi.org/10.1080/1091367X.2025.2483797. |
| [43] | Mayhew JL, Brechue WF, Smith AE, Kemmler W, Lauber D, Koch AJ. Impact of testing strategy on expression of upper-body work capacity and one-repetition maximum prediction after resistance training in college-aged men and women. J Strength Cond Res 2011; 25: 2796–807. https://doi.org/10.1519/JSC.0b013e31822dcea0. |
| [44] | McKay C, Hoch JM, Hoch MC, Dlugonski D. Sports Specialization, Physical Literacy, and Physical Activity Levels in Young Adults. J Sport Rehabil 2023; 32: 190–5. https://doi.org/10.1123/jsr.2022-0057. |
| [45] | McGuigan M. Administration, Scoring, and Interpretation of Selected Tests. Essentials of Strength Training and Conditioning 4th Edition. 4th ed., Champaign, IL: Human Kinetics; 2015, p. 265. |
| [46] | Lohman TG. Prediction Equations and Skinfolds, Bioelectrical Impedence, and Body Mass Index. Advances in Body Composition Assessment. vol. 5. Champaign, IL: Human Kinetics; 1992. |
| [47] | Evans JD. Straightforward Statistics for the Behavioral Sciences. Thomson Brooks/Cole Publishing Co; 1996. |
| [48] | Malek MH, Housh TJ, Coburn JW, Schmidt RJ, Beck TW. Cross-Validation of Ventilatory Threshold Prediction Equations on Aerobically Trained Men and Women. The Journal of Strength & Conditioning Research 2007; 21: 29–33. |
| [49] | Candow DG, Chilibeck PD. Differences in Size, Strength, and Power of Upper and Lower Body Muscle Groups in Young and Older Men. The Journals of Gerontology: Series A 2005; 60: 148–56. https://doi.org/10.1093/gerona/60.2.148. |
| [50] | Paris MT, McNeil CJ, Power GA, Rice CL, Dalton BH. Age-related performance fatigability: a comprehensive review of dynamic tasks. Journal of Applied Physiology 2022; 133: 850–66. https://doi.org/10.1152/japplphysiol.00319.2022. |
| [51] | Mayhew JL, Hill SP, Thompson MD, Johnson EC, Wheeler L. Using absolute and relative muscle endurance to estimate maximal strength in young athletes. Int J Sports Physiol Perform 2007; 2: 305–14. https://doi.org/10.1123/ijspp.2.3.305. |