-
Paper Information
- Paper Submission
-
Journal Information
- About This Journal
- Editorial Board
- Current Issue
- Archive
- Author Guidelines
- Contact Us
International Journal of Sports Science
p-ISSN: 2169-8759 e-ISSN: 2169-8791
2025; 15(1): 11-20
doi:10.5923/j.sports.20251501.02
Received: Mar. 15, 2025; Accepted: Apr. 20, 2025; Published: Apr. 23, 2025

Cardiorespiratory Relationships during Simulated Horse Galloping and Racing
 Abstract
 Reference
 Full-Text PDF
 Full-text HTML
Michaela M. Keener, Gavin C. Vice, Kimberly I. Tumlin, Nicholas R. Heebner
Sports Medicine Research Institute, College of Health Sciences, University of Kentucky, Lexington, USA
Correspondence to: Michaela M. Keener, Sports Medicine Research Institute, College of Health Sciences, University of Kentucky, Lexington, USA.
| Email: |  |
Copyright © 2025 The Author(s). Published by Scientific & Academic Publishing.
This work is licensed under the Creative Commons Attribution International License (CC BY).
http://creativecommons.org/licenses/by/4.0/

Heart rate (HR) is commonly used to estimate energy expenditure (EE) based on the assumption of a linear cardiorespiratory relationship between HR and volume of oxygen consumption (VO2). However, activities with increased upper body movement, such as arm cranking, have a disproportionate increase in HR compared to VO2 when compared to whole body exercise, such as running. Race riding (RR) requires the rider to pump their arms at a high rate and thus may require a more specific EE and VO2 estimation. Therefore, the purpose of this study was to compare the cardiorespiratory response between running and simulated galloping and assess if HR is an appropriate predictor of VO2 in RR activities. It was hypothesized that 1) HR would be significantly higher during simulated RR activities than running at equivalent VO2 levels and that 2) HR would not contribute significant information to a model to predict VO2 during simulated RR activities. Thirteen race riders (31% females) completed a graded exercise test (GXT) on a treadmill and performed simulated races and three steady-paced gallops on a motorized galloping simulator. HR and VO2 were continuously measured during all phases. Individual trendlines from the GXT were used to calculate equivalent VO2 values between the galloping and running phases. Paired t-tests evaluated for differences between running and simulated galloping phases. Generalized estimating equations (GEE) were used to assess if HR contributed to predicting VO2 between running, simulated steady-paced galloping, and simulated racing. Results showed that HR was significantly higher (p<0.05) during all galloping conditions compared to running at an equivalent VO2, with average differences ranging from 14-35 bpm. HR contributed significantly (p<0.05) to GEE to predict VO2 for all conditions, but the slope of the relationship was significantly lower (p<0.05) during steady-paced galloping than treadmill running or simulated racing. The current study suggest that HR is a reliable predictor of EE during simulated galloping activities, but that HR is influenced by the specialized movement patterns RR utilize while galloping. Future research should explore cumulative EE across a workday, incorporate excess post-exercise oxygen consumption (EPOC), and evaluate live riding conditions to better understand the physiological demands of RR activities to inform tailored exercise regiments and nutritional guidelines for this population.
Keywords: Horseracing, Jockey, VO2Max Testing
Cite this paper: Michaela M. Keener, Gavin C. Vice, Kimberly I. Tumlin, Nicholas R. Heebner, Cardiorespiratory Relationships during Simulated Horse Galloping and Racing, International Journal of Sports Science, Vol. 15 No. 1, 2025, pp. 11-20. doi: 10.5923/j.sports.20251501.02.
Article Outline
1. Introduction
- Heart rate (HR) is a fundamental parameter in the estimation of energy expenditure (EE) based on the widely accepted assumption of a linear relationship between HR and the volume of oxygen consumption (VO2) [1]. This linear relationship is the foundation for models of estimating EE in numerous physical activities and submaximal VO2 testing, such as running and cycling [2-5]. The cardiorespiratory relationship for each physical activity depends on the activity's movement pattern. Previous data reports a high correlation between heart rate and VO2 in whole-body exercises, such as running and using an elliptical [6-8]. Activities involving greater upper body movement, such as arm cranking, lead to a disproportionate increase in HR relative to VO2 [1, 9-11]. This discrepancy arises from differences in muscle mass, muscle fibre composition, blood pressure, oxygen extraction, and hemodynamic afterload [3,9-14].Equestrians who ride thoroughbreds in the horse racing industry are classified mainly as race riders (RR) and can fall into subcategories of licensed jockeys, apprentice jockeys, and exercise riders. Exercise riders work with horses during daily training but do not ride in sanctioned races. Licensed and apprentice jockeys are primarily hired to ride in sanctioned races but often exercise horses to make additional income, network with trainers, and prepare for upcoming races. All RRs can experience weight restrictions from race jurisdictions or trainers. Jockeys (licensed and apprentice) commonly restrict their caloric and fluid intake rather than exercising and eating a balanced diet to maintain weight [15-19]. Uses of weight-making habits such as chronic dehydration and caloric restriction can result in imbalanced hormones, weakened bone health, and decreased mental health. Such behaviours are detrimental to the immediate and long-term health and quality of life of RRs [16,20-26]. One challenge in developing healthier weight-management practices stems from the limited availability of data on EE associated with individual RR activities, such as racing and exercising horses.Previous research reports that male Irish jockeys have an average EE of 2,546-2,587 kcal/day, with standard deviations ranging from 420-550 kcal/day that do not change significantly across seasons [27]. This estimate, derived from doubly labelled water, provides an overview of total daily EE but does not capture the EE of individual riding activities. Among American jockeys, the number of races ridden, and horses exercised varies widely day-to-day, leading to significant fluctuations in EE from RR activities [19]. Without precise EE for individual activities, interventions may fail to account for these daily variations, which could cause RRs to revert to unhealthy weight-making practices. Developing tailored interventions accounting for these dynamic workloads is essential in creating sustainable and health-protective weight-making practices for the RR community. Therefore, accurate EE assessments and estimations from HR are crucial to inform such future interventions. Few studies have evaluated EE across individual activities in which RRs participate regularly. The most common way to estimate EE during a single activity bout is by measuring VO2 through indirect calorimetry using portable metabolic units [28]. For safety and weight-making reasons, jockeys cannot wear portable metabolic units during live racing, and some trainers are concerned for the safety of their riders wearing them while training on young horses. Therefore, few studies have evaluated EE on live horses. One study successfully reported the average VO2 and HR data during various horse gaits used while exercising horses [29]. However, they do not report VO2 and HR values at a gallop, the horse's fastest gait often used during sprint exercise rides (breezing) and racing [28,29]. The limited ability to capture VO2 and EE during live riding leads researchers and practitioners to estimate EE from HR. Previous studies report elevated HR during live racing, exercising, and simulated riding [17,30-33]. Various racing simulators exist. Manual self-propelled models require the riders to use their arms to lift the simulator's head. In contrast, motorized models propel themselves and include multiple speeds and modes. Previous research indicates that the HR response while riding a galloping simulator is significantly lower than during galloping on a live horse [30-33]. Researchers presume the differences arise from the RR not having to interact with a live horse (i.e., restraining or coaxing the horse forward) and the differences in movement patterns of the two modalities. However, using a galloping simulator allows for consistency in speed, stride frequency, stride rhythm, and time ridden across research participants. Reported HR during live racing averages between 160-180 bpm and peaks between 182-187 bpm, falling into the category of vigorous activity [30,31,34]. Although RR bouts are brief, it is common for RR to ride multiple horses a day for varying times, speeds, and distances. Relying on HR to estimate EE during these activities may be misleading when compared to other activities, such as running. RR movement patterns require crouching over the horse's back, using quasi-isometric muscle engagement, and maintaining their centre of mass near the horse's midline to reduce the horse's workload [35]. Simultaneously, while the RR holds this position with their lower body, their upper body helps drive the horse forward. Wilson and colleagues reported jockeys push the horse forward with their arms approximately 100 times during a 3.2 km race, suggesting a significant component of upper body movement that could affect the linear cardiorespiratory relationship often used to estimate EE [27]. Based on previous research in similar modalities (i.e., arm cranking), understanding the relationship between HR and VO2 in RR activities is critical to ensure a solid foundation for future research and educational programs for improving weight maintenance practices in RRs. The current study's aim was to evaluate the cardiorespiratory response RR experiences between running on a treadmill and riding a galloping simulator. Our primary hypothesis was that due to the large recruitment of upper body movement, HR would be significantly higher during galloping conditions than when running on a treadmill at the same rate of VO2. Our secondary hypothesis was that when galloping on a horse simulator, HR would not significantly contribute to a model's ability to predict VO2 but would during running. We intended to determine if using HR is a good indicator of EE for RR activities. By enhancing our understanding of EE estimation from HR, this research can guide future interventions to establish sustainable weight-management and fuelling practices in the RR community. These efforts aim to improve the health and performance of RRs while enhancing their long-term health and quality of life.
2. Methods
- The study was approved by the University of Kentucky’s Institutional Review Board (Protocol No. 56494). Verbal and written informed consent were completed in English prior to collecting any personal data besides the basic inclusion and exclusion criteria. All data was collected at a single sports medicine research institute location.
2.1. Inclusion and Exclusion Criteria
- Recruitment was a convenience sample of RRs aged 18 to 50 from July 2021 to April 2022 through word-of-mouth and social media posts. Eligible riders were required to currently work in the racing industry, ride at least twice per week over the past six months, and canter or gallop at least once a week. Riders were excluded if they had sustained injuries that prevented participation in practice or competition for more than one week in the past six months. Following a signed informed consent, participants completed the American College of Sports Medicine (ACSM) Risk Stratification Assessment to determine their suitability for high-intensity exercise without needing further medical evaluation. Participants requiring further medical evaluation were excluded.
2.2. Equipment
- Before the participants arrived, the Parvo metabolic cart (ParvoMedics, Salt Lake City, Utah, USA) was calibrated per the manufacturer's instructions. Participants were sized and fitted with a VO2 mask (Hans Rudolph, inc., Shawnee, Kansas, USA) and a Polar H10 Heart Rate Monitor (Polar, Kempele, Finland). Researchers tested the metabolic mask for leaks prior to each exercise bout. Participants completed a running graded exercise test (GXT) on a motorized flat Woodway treadmill (Woodway, Pewaukee, Wisconsin, USA). All participants rode the MK9 Racewood motorized galloping horse simulator (Racewood Ltd., Tarporley, United Kingdom) (Figure 1). The MK9 Simulator features five remote-controlled steady-galloping speeds and a “neck mode.” Neck mode allows riders to control the simulator by applying pressure to the neck to accelerate and applying pressure to both reins to decelerate.
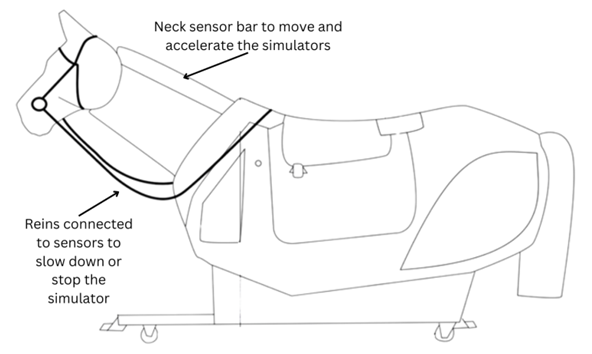 | Figure 1. Outline of the Racewood MK9 Simulator and location of the sensors for a participant to control the simulator’s speed when using “neck mode.” |
2.3. Testing Protocol
- Participants' age, height, weight, sex, RR cohort and resting HR were recorded prior to their warmup, which was a self-selected jog for 5 minutes. Following the warmup, the researchers explained the GXT protocol, the BORG 6-20 rate of perceived effort (RPE) scale and the ACSM's scales for claudication, dyspnea, and angina [36]. The metabolic cart collected breath-by-breath VO2 data for all phases, and HR was collected at 60Hz for all conditions.Prior to starting the GXT protocol, heart rate and VO2 were recorded for one minute. A staged GXT protocol was used, and started at a 0% incline, with participants self-selecting a jogging pace they felt they could maintain for the duration of the test. The treadmill incline was increased by 2% every two minutes. The test continued until the participants felt they could either 1) no longer continue or 2) not finish at least one minute of the next stage. Participants pointed at printed scales every minute to indicate their RPE and if they were experiencing any abnormal symptoms in the other ACSM scales.After a five-minute rest, participants completed a familiarization period on the galloping simulator. All participants rode in the same race saddle and were allowed to adjust their stirrups during the familiarization period. The familiarization period included riding for at least 30 seconds at three of the five remote-controlled steady-paced galloping speeds. These speeds simulate galloping at an estimated 20-24 mph (S1), 28-32 mph (S3) and 36-40 mph (S5). Speed options S2 and S4 on the simulator were not used during this data collection. All jockeys (licensed and apprentice) rode for a minimum of one minute in the neck mode to familiarize themselves with controlling the simulators speed by applying pressure to the neck and reins. After completing the familiarization period, the participants rested for fifteen minutes. After the rest period, all jockeys rode two simulated races. Jockeys completed the simulated races in neck mode, enabling them to control the simulator’s speed. This setup mimics a live race, where the horse’s speed and the rider's exertion progressively increase throughout the race. There was a video from the jockey’s perspective from a dirt race that lasted 1:45.05 on a screen directly in front of the RRs to use for visual cues throughout the simulated race. Exercise riders did not complete simulated races as that is outside their occupational demand. All RR completed two-minute bouts at the three remoted controlled steady-state galloping speeds in a randomized order. Participants rested for fifteen minutes between each bout (races and steady-state galloping) on the galloping simulator with the metabolic mask removed.
2.4. Data Processing
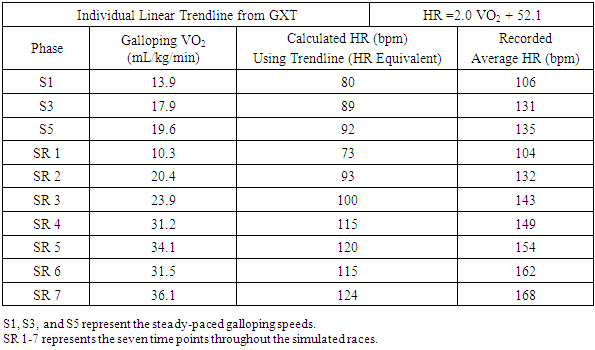
- HR and VO2 data were averaged in 15-second increments for all tests. Kcals were calculated for every 15-second average throughout the simulated races to estimate caloric expenditure. VO2Max values were compared to the ACSM's normative values. Based on these normative values, the percentile and fitness categories (superior, excellent, good, fair, poor) were recorded [36]. To compare HR at the same VO2 between the treadmill and all galloping bouts, individual trendlines were calculated from each participant’s GXT breath-by-breath VO2 and synchronized HR data. Linear equations to estimate HR from VO2 were calculated for each trendline. For the steady-paced galloping phases, the average VO2 from the final 15-second increment from each speed was used to calculate an equivalent HR for running on the treadmill. For the simulated race that progressively gets faster throughout the race, the race data was broken into seven 15-second averages for VO2 and HR data. The seven average VO2 points were used to calculate seven HR equivalents throughout the simulated race. Examples of this process are in Figure 2 and Table 1. Only the data from the second simulated race was utilized for analysis to provide an additional familiarization to the simulator’s neck mode.
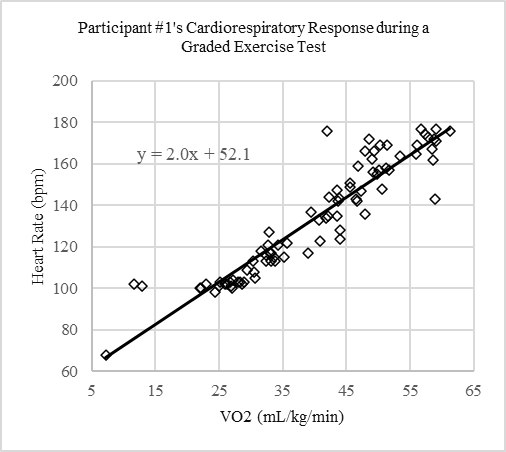 | Figure 2. Results of an example participant’s GXT breath-by-breath VO2 and synchronized HR data with a trendline and linear equation used to estimate HR equivalents while running to compare to HR while galloping at an equivalent VO2 |
2.5. Data Analysis
- Data from each GXT were evaluated to determine if the participants reached a “true” VO2Max value based on the following criteria: 1) Plateau of VO2 during the final two minutes of the test (change in VO2 ≤ 2 mL); 2) Reached 95% Age predicted maximal heart rate; 3) Final minute average Respiratory Exchange Ratio (RER) ≥ 1.05; 4). Reported an RPE ≥ 19. Participants had to meet at least two of the four criteria to achieve a “true” VO2Max. To evaluate if HR had a significant impact on a model to predict VO2 during steady-paced galloping and the simulated race compared to running, three data sets were created. Data set one included the final 15-second increment average VO2 and HR from each two-minute stage of the GXT for all participants. Data set two included the final 15-second increment average VO2 and HR from each two-minute steady-paced galloping bout for all participants. Data set three included the seven 15-second average VO2 and HR increments from the jockeys second simulated race. Data was imported into SAS (SAS Institute, Cary, North Carolina, US) for analysis. One participant’s HR data was lost during the S2 galloping phase. No other data was identified as missing. Shapiro-Wilks tests evaluated numerical data for normality, with alpha set to 0.05 for all statistical tests. All numerical data was normally distributed. A Pearson-correlation test was used to examine the relationships between age and VO2Max percentile with HR and VO2 from steady-paced galloping and simulated race data. No significant correlations were found. A point-biserial correlation test was used to analyze if there was a relationship between sex and steady-paced galloping and simulated race VO2 and HR data. No significant correlations existed in these relationships. A post-hoc power analysis was conducted using the observed effect size from the simulated race HR data and indicated that the study had a power of 0.999 with a significance level of 0.05. For the primary hypotheses, paired t-tests were used to evaluate differences in HR between the calculated treadmill HR equivalents and the recorded galloping HR data. Effect sizes were calculated using Cohen’s D to quantify the magnitude of differences between conditions. For the secondary hypothesis the three separate data sets from the treadmill, steady-paced galloping, and simulated race were imported into SAS. Generalized Estimating Equations (GEE) were calculated for each data set. This statistical approach accounts for the nature of correlated data from repeated measurements within participants. The GEE models were used to predict VO2 from HR data. Wald tests were used to evaluate difference between the slopes from the GEE models.
3. Results
- Fourteen RR initially enrolled, but one RR was excluded as they experienced symptoms of claustrophobia when wearing the metabolic mask. No participants were excluded based on their response to the ACSM Risk Stratification Assessment.
3.1. Demographics
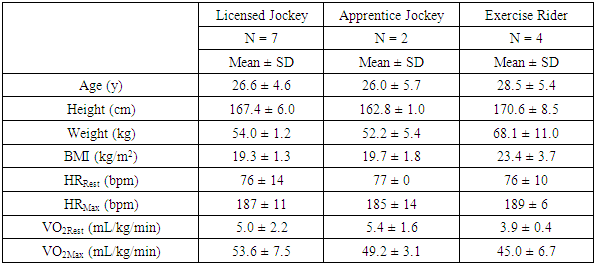
- Of the thirteen RR who completed the protocol, four were female and the other nine were males. There were seven licensed jockeys, two apprentice jockeys, and four exercise riders. The average age was 27.1 ± 4.7 years old. Average anthropometric values were 167.7 ± 6.5 cm and 58.1 ± 9.1 kg. Average BMI was calculated to be 20.6 ± 2.9 kg/m2. Cohort specific demographics are in Table 2.
|
3.2. Maximal Exercise Tests Results
- Only one participant failed to meet a minimum of two of the four criteria for a “true” VO2Max during their GXT but had a VO2Max value that was categorized as superior. All thirteen participants (100%) met the VO2 plateau in the final two minutes of the test. Twelve (92.3%) reported an RPE ≥ 19. Six (46.2%) reached their 95% age predicted maximal heart rate, and five (38.5) had an average RER greater than 1.05 in the final minute of the test. The average VO2Max for all RR was 50.3 ± 7.5 mL/kg/min and ranged from 38.3 to 61.3 mL/kg/min. The average maximal HR attained was 187 ± 9 bpm and ranged from 175-206 bpm. HR and VO2 data by RR cohort are in Table 2. Comparing the VO2Max results with the ACSM normative values, 46.2% of the RR had superior fitness, 23.1% excellent fitness, 7.7% good fitness, 15.4% fair fitness, and 7.7% poor fitness. No abnormal symptoms were reported during the GXTs.
3.3. Heart Rate Between Running and Galloping Phases
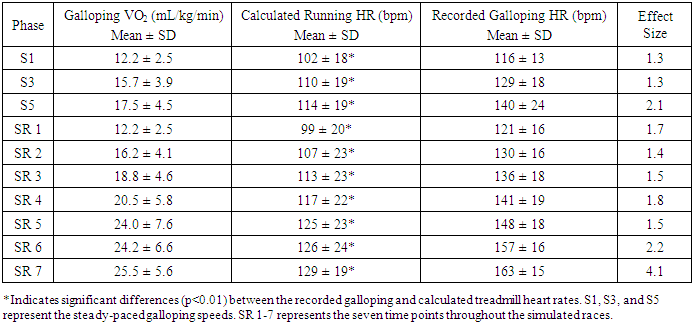
- Recorded and calculated heart rates using the individualized linear trendlines at an equivalent VO2 are in Table 3. The data shows significant differences between calculated treadmill HR equivalents and recorded HR during all galloping phases. HR during steady-paced galloping and simulated races were consistently higher than HR during running. The average difference between calculated and recorded heart rates during the steady-paced galloping ranged from 14 bpm at S1, to 26 bpm at S5. The average differences between calculated and recorded heart rate for the seven intervals across the 1:45 minute simulated race ranged from 22 bpm in the first 15-second increment up to 35 bpm in the final 15-second increment. All comparisons of HR yielded large effect sizes (Cohen’s d > 1.3) indicating substantial differences between the modalities across all conditions.
|
3.4. Simulated Galloping Energy Expenditure and Metabolic Equivalents
- EE was calculated for the steady-paced galloping using the final 15-second increment from each two-minute bouts. During S1, the average EE was 3.5 ± 0.6 kcals/min and had an average metabolic equivalent (MET) rate of 3.5 ± 0.7. During S3, the average EE was 4.4 ± 0.8 kcal/min with an average MET rate of 4.5 ± 1.1. During S5, the average EE was 5.0 ± 1.0 kcal/min with an average MET rate of 5.0 ± 1.3. For the simulated race, kcals were calculated for every 15 second increment and summed. The 15-second increments for EE ranged from 0.8 – 1.7 kcals/15-seconds. The simulated race of 1:45 had a total EE of 9.4 ± 1.9 kcals with a final MET rate of 7.3 ± 1.6 in the final 15-second push.
3.5. Cardiorespiratory Modelling
- Figure 3 shows the results of the GEE model analyses, which examined the contributions of HR to predict VO2 across the different exercise modalities, including treadmill running, steady-paced galloping, and simulated racing. The analysis revealed that during treadmill running, HR significantly enhanced the model’s predictive capability for VO2, and HR was positively associated with VO2 (𝛽=0.36, SE = 0.02, 95% CI: 0.33–0.40, 𝑝 <0.0001). This model had an exchangeable working correlation of .93, suggesting strong correlation among repeated measures within clusters.
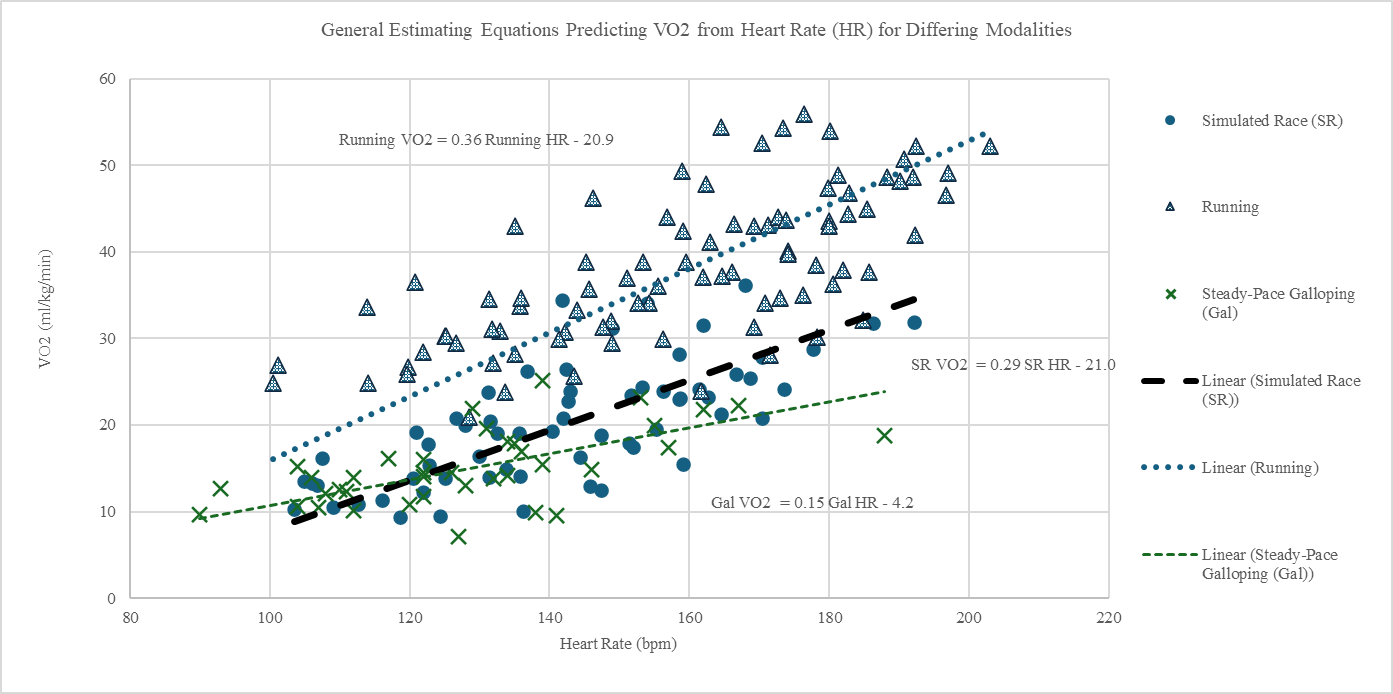 | Figure 3. General Estimating Equations (GEE) for predicting VO2 from HR during running on a treadmill, steady-paced galloping and riding a simulated race from all participants |
4. Discussion
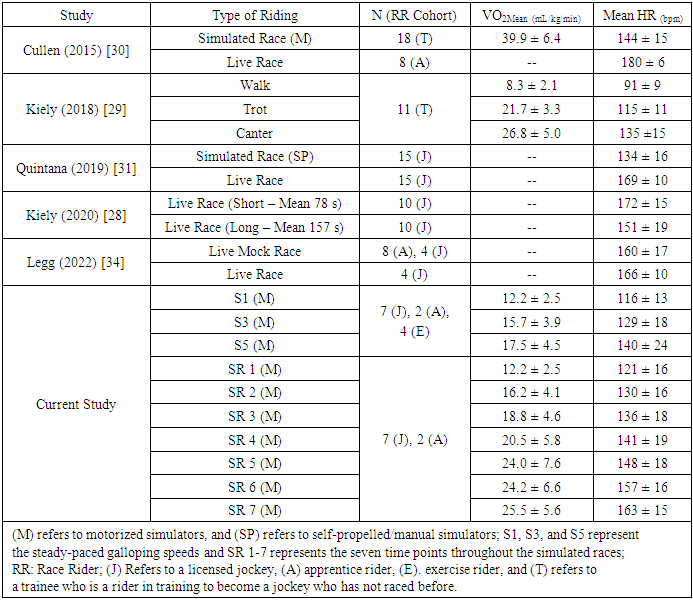
- The current study’s primary focus was to compare the differences in cardiorespiratory responses between running and simulated galloping activities to determine if HR can serve as an appropriate indicator of EE during RR activities. The findings support that HR is significantly higher during RR activities than running but still contributed to predicting VO2 and, subsequently, EE across all activities. Our primary hypothesis was that recruitment of upper body movement would increase HR significantly higher during simulated galloping conditions than when running on a treadmill at the same rate of VO2. Average HR differences were between 14-35 bpm higher in galloping activities than running at an equivalent VO2, supporting the primary hypothesis. The current study is the first to evaluate steady-paced and a simulated race using the neck mode on a galloping simulator, allowing the participant to control the simulators speed. Table 4 compares our findings with previous research evaluating HR in simulated and live galloping conditions.
|
5. Conclusions
- HR remains a valuable predictor of VO₂ when assessing simulated RR, despite higher HR at equivalent VO2 levels than running activity. Elevated HR observed during simulated galloping is attributable to the increased involvement of upper body muscles required for the specialized movement patterns of galloping. Despite reporting relatively low EE during simulated races, galloping activities achieved MET values consistent with moderate to vigorous physical activity levels as defined by ACSM guidelines. This study is the first to the authors’ knowledge to provide an equation to predict EE from HR during simulated galloping at steady-paced speeds and during simulated races. These findings contribute to a foundation for estimating EE from HR in the RR community to guide future tailored weight-making based on daily EE. Future research should explore the EE-HR relationship more in-depth on live horses, the cumulative EE across a RRs workday, how EE is different based on horse characteristics, environmental conditions, and varying intensities of live riding, and the impact EPOC has on EE of various RR activities.
References
| [1] | S. K. Powers, E. T. Howley, and J. Quindry, Exercise physiology: Theory and application to fitness and performance. McGraw-Hill New York, NY, 2007. |
| [2] | B. de Geus, S. De Smet, J. Nijs, and R. Meeusen, "Determining the intensity and energy expenditure during commuter cycling," British journal of sports medicine, vol. 41, no. 1, pp. 8-12, 2007, doi: 10.1136/bjsm.2006.027615. |
| [3] | D. A. Schneider, A. N. Wing, and N. R. Morris, "Oxygen uptake and heart rate kinetics during heavy exercise: a comparison between arm cranking and leg cycling," European journal of applied physiology, vol. 88, no. 1, pp. 100-106, 2002, doi: 10.1007/s00421-002-0690-5. |
| [4] | L. Keytel et al., "Prediction of energy expenditure from heart rate monitoring during submaximal exercise," Journal of sports sciences, vol. 23, no. 3, pp. 289-297, 2005. |
| [5] | H. Besson, S. Brage, R. W. Jakes, U. Ekelund, and N. J. Wareham, "Estimating physical activity energy expenditure, sedentary time, and physical activity intensity by self-report in adults," The American Journal of Clinical Nutrition, vol. 91, no. 1, pp. 106-114, 2009, doi: 10.3945/ajcn.2009.28432. |
| [6] | L. C. Dalleck and L. Kravitz, "Relationship between %heart rate reserve and %VO2 reserve during elliptical crosstrainer exercise," Journal of sports science & medicine, vol. 5, no. 4, pp. 662-671, 2006. |
| [7] | J. Parak, M. Uuskoski, J. Machek, and I. Korhonen, "Estimating heart rate, energy expenditure, and physical performance with a wrist photoplethysmographic device during running," JMIR mHealth and uHealth, vol. 5, no. 7, p. e7437, 2017. |
| [8] | M. Klass, V. Faoro, and A. Carpentier, "Assessment of energy expenditure during high intensity cycling and running using a heart rate and activity monitor in young active adults," PloS one, vol. 14, no. 11, p. e0224948, 2019. |
| [9] | J. Calbet et al., "Central and peripheral hemodynamics in exercising humans: leg vs arm exercise," Scandinavian journal of medicine & science in sports, vol. 25, pp. 144-157, 2015. |
| [10] | J. A. L. Calbet, H. C. Holmberg, H. Rosdahl, G. Van Hall, M. Jensen-Urstad, and B. Saltin, "Why do arms extract less oxygen than legs during exercise?," American Journal of Physiology-Regulatory, Integrative and Comparative Physiology, vol. 289, no. 5, pp. R1448-R1458, 2005, doi: 10.1152/ajpregu.00824.2004. |
| [11] | C. Zinner et al., "The physiological mechanisms of performance enhancement with sprint interval training differ between the upper and lower extremities in humans," Frontiers in Physiology, vol. 7, 2016, doi: 10.3389/fphys.2016.00426. |
| [12] | J. Helgerud, B. E. Øiestad, E. Wang, and J. Hoff, "Prediction of upper extremity peak oxygen consumption from heart rate during submaximal arm cycling in young and middle-aged adults," European journal of applied physiology, vol. 119, no. 11-12, pp. 2589-2598, 2019, doi: 10.1007/s00421-019-04225-3. |
| [13] | D. S. Miles, M. H. Cox, and J. P. Bomze, "Cardiovascular responses to upper body exercise in normals and cardiac patients," Medicine and Science in Sports and Exercise, vol. 21, no. 5 Suppl, pp. S126-31, 1989. |
| [14] | T. Stöggl, G. Björklund, and H. C. Holmberg, "Biomechanical determinants of oxygen extraction during cross-country skiing," Scandinavian Journal of Medicine & Science in Sports, vol. 23, no. 1, pp. e9-e20, 2013. |
| [15] | E. Dolan, H. O'Connor, A. McGoldrick, G. O'Loughlin, D. Lyons, and G. Warrington, "Nutritional, lifestyle, and weight control practices of professional jockeys," Journal of sports sciences, vol. 29, no. 8, pp. 791-799, 2011, doi: 10.1080/02640414.2011.560173. |
| [16] | G. Wilson, B. Drust, J. P. Morton, and G. L. Close, "Weight-making strategies in professional jockeys: implications for physical and mental health and well-being," Sports medicine, vol. 44, pp. 785-796, 2014. |
| [17] | J. O'Reilly, H. L. Cheng, and E. T.-C. Poon, "New insights in professional horse racing; "in-race" heart rate data, elevated fracture risk, hydration, nutritional and lifestyle analysis of elite professional jockeys," Journal of sports sciences, vol. 35, no. 5, pp. 441-448, 2017, doi: 10.1080/02640414.2016.1171890. |
| [18] | M. Kiely, G. Warrington, A. McGoldrick, and S. Cullen, "Physical preparation strategies of professional jockeys," Journal of strength and conditioning research, vol. 36, no. 11, pp. 3184-3189, 2020, doi: 10.1519/JSC.0000000000003514. |
| [19] | M. M. Keener, G. C. Vice, K. I. Tumlin, and N. R. Heebner, "Workday habits and fatigue of American jockeys," Journal of Occupational and Environmental Medicine, p. 10.1097, 2024. |
| [20] | E. Dolan, N. Crabtree, A. McGoldrick, D. T. Ashley, N. McCaffrey, and G. D. Warrington, "Weight regulation and bone mass: a comparison between professional jockeys, elite amateur boxers, and age, gender and BMI matched controls," J Bone Miner Metab, vol. 30, no. 2, pp. 164-70, Mar 2012, doi: 10.1007/s00774-011-0297-1. |
| [21] | E. Dolan et al., "An altered hormonal profile and elevated rate of bone loss are associated with low bone mass in professional horse-racing jockeys," J Bone Miner Metab, vol. 30, no. 5, pp. 534-42, Sep 2012, doi: 10.1007/s00774-012-0354-4. |
| [22] | G. Warrington et al., "Chronic weight control impacts on physiological function and bone health in elite jockeys," Journal of Sports Sciences, vol. 27, no. 6, pp. 543-550, 2009, doi: 10.1080/02640410802702863. |
| [23] | L. King et al., "Mental health difficulties among professional jockeys: a narrative review," BMJ Open Sport & Exercise Medicine, vol. 7, no. 2, pp. e001078-e001078, 2021, doi: 10.1136/bmjsem-2021-001078. |
| [24] | C. Losty, G. Warrington, A. McGoldrick, C. Murphy, E. Burrows, and S. Cullen, "Mental health and wellbeing of jockeys," Journal of human sport and exercise, vol. 14, no. 1, pp. 147-158, 2019, doi: 10.14198/jhse.2019.141.12. |
| [25] | G. Wilson et al., "Rapid weight-loss impairs simulated riding performance and strength in jockeys: implications for making-weight," Journal of sports sciences, vol. 32, no. 4, pp. 383-391, 2014. |
| [26] | G. Wilson, J. Hill, C. Sale, J. P. Morton, and G. L. Close, "Elite male Flat jockeys display lower bone density and lower resting metabolic rate than their female counterparts: implications for athlete welfare," (in eng), Appl Physiol Nutr Metab, vol. 40, no. 12, pp. 1318-20, Dec 2015, doi: 10.1139/apnm-2015-0354. |
| [27] | G. Wilson, S. A. Sparks, B. Drust, J. P. Morton, and G. L. Close, "Assessment of energy expenditure in elite jockeys during simulated race riding and a working day: implications for making weight," Applied physiology, nutrition, and metabolism, vol. 38, no. 4, pp. 415-420, 2013, doi: 10.1139/apnm-2012-0269. |
| [28] | M. Kiely, G. D. Warrington, A. McGoldrick, J. Pugh, and S. Cullen, "Physiological demands of professional flat and jump horse racing," The Journal of Strength & Conditioning Research, vol. 34, no. 8, pp. 2173-2177, 2020. |
| [29] | M. A. Kiely, G. D. Warrington, A. Mcgoldrick, G. O'loughlin, and S. Cullen, "Physiological demands of daily riding gaits in jockeys," The Journal of sports medicine and physical fitness, vol. 59, no. 3, pp. 394-398, 2018. |
| [30] | S. Cullen, G. OʼLoughlin, A. McGoldrick, B. Smyth, G. May, and G. D. Warrington, "Physiological Demands of Flat Horse Racing Jockeys," Journal of strength and conditioning research, vol. 29, no. 11, pp. 3060-3066, 2015, doi: 10.1519/JSC.0000000000000977. |
| [31] | C. Quintana et al., "Differences in head accelerations and physiological demand between live and simulated professional horse racing," Comparative Exercise Physiology, vol. 15, no. 4, pp. 259-268, 2019. |
| [32] | A. Walker, A. Martin, T. Pfau, E. Sparkes, A. Wilson, and T. Witte, "How realistic is a racehorse simulator?," Journal of biomechanics, vol. 49, no. 14, pp. 3570-3575, 2016. |
| [33] | A. M. Walker, C. Applegate, T. Pfau, E. L. Sparkes, A. M. Wilson, and T. H. Witte, "The kinematics and kinetics of riding a racehorse: A quantitative comparison of a training simulator and real horses," Journal of biomechanics, vol. 49, no. 14, pp. 3368-3374, 2016, doi: 10.1016/j.jbiomech.2016.08.031. |
| [34] | K. Legg, D. Cochrane, E. Gee, P. Macdermid, and C. Rogers, "Physiological demands and muscle activity of jockeys in trial and race riding," Animals, vol. 12, no. 18, p. 2351, 2022. |
| [35] | T. Pfau, A. Spence, S. Starke, M. Ferrari, and A. Wilson, "Modern riding style improves horse racing times," (in eng), Science, vol. 325, no. 5938, p. 289, Jul 2009, doi: 10.1126/science.1174605. |
| [36] | G. Liguori and A. C. o. S. Medicine, ACSM's guidelines for exercise testing and prescription. Lippincott Williams & Wilkins, 2020. |
| [37] | A. Olivier, E. Faugloire, L. Lejeune, S. Biau, and B. Isableu, "Head stability and head-trunk coordination in horseback riders: The contribution of visual information according to expertise," Frontiers in Human Neuroscience, vol. 11, p. 11, 2017, doi: 10.3389/fnhum.2017.00011. |
| [38] | R. Schwesig, K. Sannemüller, R. Kolditz, K. Hottenrott, S. Becker, and H. D. Esperer, "Specific riding styles are associated with specific effects on bodily posture control," Sportverletzung, Sportschaden, vol. 22, no. 2, pp. 93-99, 2008, doi: 10.1055/s-2008-1027394. |
| [39] | C. Fadillioglu, F. Möhler, M. Reuter, and T. Stein, "Changes in key biomechanical parameters according to the expertise level in runners at different running speeds," Bioengineering, vol. 9, no. 11, p. 616, 2022. |
| [40] | J. P. Folland, S. J. Allen, M. I. Black, J. C. Handsaker, and S. E. Forrester, "Running technique is an important component of running economy and performance," Medicine and science in sports and exercise, vol. 49, no. 7, p. 1412, 2017. |
| [41] | T. Paillard, "Relationship Between Sport Expertise and Postural Skills," Frontiers in Psychology, vol. 10, 2019, doi: 10.3389/fpsyg.2019.01428. |
| [42] | J. B. Shea and G. Paull, "Capturing expertise in sports," in The road to excellence: Psychology Press, 2014, pp. 321-335. |
| [43] | C. E. Martin, J. A. Shaver, D. F. Leon, M. E. Thompson, P. S. Reddy, and J. J. Leonard, "Autonomic mechanisms in hemodynamic responses to isometric exercise," The Journal of clinical investigation, vol. 54, no. 1, pp. 104-115, 1974. |
| [44] | J. P. Fisher and M. J. White, "Muscle afferent contributions to the cardiovascular response to isometric exercise," Experimental Physiology, vol. 89, no. 6, pp. 639-646, 2004. |