-
Paper Information
- Paper Submission
-
Journal Information
- About This Journal
- Editorial Board
- Current Issue
- Archive
- Author Guidelines
- Contact Us
International Journal of Sports Science
p-ISSN: 2169-8759 e-ISSN: 2169-8791
2025; 15(1): 1-10
doi:10.5923/j.sports.20251501.01
Received: Jan. 17, 2025; Accepted: Feb. 22, 2025; Published: Feb. 26, 2025

The More Rules and Strategies of Basketball Change, the More Winning Characteristics Remain the Same: An Analysis of NCAA Women’s Competition
 Abstract
 Reference
 Full-Text PDF
 Full-text HTML
Timothy A. Whitesel 1, Hannah M. Varel 2, Natalie G. Sweeney 3, Juli L. Fulks 1
1Athletics Department, Marshall University, Huntington, West Virginia, USA
2Department of Physical Education and Athletics, Transylvania University, Lexington, Kentucky, USA
3Library, University of South Carolina Upstate, Spartanburg, South Carolina, USA
Correspondence to: Timothy A. Whitesel , Athletics Department, Marshall University, Huntington, West Virginia, USA.
| Email: |  |
Copyright © 2025 The Author(s). Published by Scientific & Academic Publishing.
This work is licensed under the Creative Commons Attribution International License (CC BY).
http://creativecommons.org/licenses/by/4.0/

The aim of this study was to quantitatively evaluate game-related characteristics of NCAA women’s basketball games, their recent evolution, and their relationship to winning. We analyzed 30 variables from Division I and Division III games during the 2009-2010 and 2019-2020 seasons. We used planned comparisons to evaluate Divisions within a season as well as between seasons within a Division. To determine if there were characteristics that differentiated wins and losses, we conducted linear discriminant analyses. Characteristics that differed between Divisions were relatively few in the 2009-2010 season (5) but increased nearly 3-fold by the 2019-2020 seasons (14). Changes to game strategies were evident in both Divisions, dominated by an emphasis on three-point shooting, and most pronounced in Division I. A small subset of characteristics, focused around points per possession and the number of defensive rebounds, were consistently useful for differentiating between wins and losses. There appears to be a mismatch between the evolution of game strategy and characteristics important to winning. To maximize the number of games won, it appears important for a team’s strategy to consider how the team’s strengths are best integrated to maximize the number of points per possession and not, necessarily, emphasize three-point shooting.
Keywords: Defensive Rebounding, Discriminant Analysis, Division I, Division III, NCAA, Points Per Possession
Cite this paper: Timothy A. Whitesel , Hannah M. Varel , Natalie G. Sweeney , Juli L. Fulks , The More Rules and Strategies of Basketball Change, the More Winning Characteristics Remain the Same: An Analysis of NCAA Women’s Competition, International Journal of Sports Science, Vol. 15 No. 1, 2025, pp. 1-10. doi: 10.5923/j.sports.20251501.01.
Article Outline
1. Introduction
- Basketball is a multifaceted game. Each game involves the complexity of integrating what can be considered the six, distinct phases of defensive transition, defense, defensive rebounding, offensive transition, offense and offensive rebounding. Each phase has various components, many of which can be characterized statistically [e.g. 1]. For more than 50 years, statistics associated with basketball have been used to help coaches and players, understand individual and team performance [e.g. 2]. Many of these statistics can also be reflective of the success of a team [e.g. 3]. Quantitative analysis of statistics, or analytics, is transforming the game of basketball [4]. Investigations on the relationship between game-related characteristics and winning (or losing) basketball games began over 30 years ago [5]. Initial reports suggested that points per possession, shooting percentage from the field, free throw opportunities, turnovers, and rebounding were the factors most important to winning games and should be the focus of a team’s strategy [5,6]. The number of these types of analyses has increased substantially in the past 20 years and now include both men’s and women’s teams, competitive levels ranging from youth to professional, and games in numerous countries [e.g. 3,7,8]. Despite this proliferation, analyses associated with women’s basketball in the National Collegiate Athletic Association (NCAA; United States of America and Canada) are difficult to find for any period [9]. This absence is particularly noteworthy given that statistics associated with the modern NCAA women’s game are more abundant [e.g. 10,11], and the game is more popular [12], than ever before. Notwithstanding the abundance of statistics, whether and which specific game-related characteristics are associated with winning is not well understood. The game of basketball is evolving rapidly [e.g. 13], which can complicate interpretations from quantitative analyses [14]. This evolution includes the players, whose size, speed and strength as well as their focus on nutrition is greater than ever [15]. It also includes numerous and continuous rule changes, often designed to maximize the attractiveness of the game [16]. Much of the evolution of the game and strategies appears to be directly or indirectly in response to rule changes [17]. The rapid evolution of basketball may generally, and perhaps best, be illustrated by the women’s game [18,19]. This is particularly true when considering changes to the rules governing play in the NCAA. Specifically, 2011-2018 was a period of numerous and substantial rule changes (PNSRC) in NCAA women’s basketball [20]. Some of the more significant changes included disallowing the hand-check and reducing the allowable points of contact when defending players that have their back to the basket; the addition of a restricted area underneath the basket; play occurring over four, 10 minute quarters rather than 2, 20 minutes halves; once there are five team fouls in a period, a player being awarded two free throws after a common foul (rather than a one plus one situation after seven team fouls); the ability for teams to use a timeout and advance the ball when there is less than one minute to play; and moving the three-point line to 632.5 cm (20’9”). Common themes that were, at least in part, the impetus for these changes included player safety, improving the flow of the game to create greater appeal to viewers, and standardizing the game internationally. Although many have speculated [21], a rigorous evaluation of whether and how game strategy and winning characteristics of the NCAA women’s basketball teams have evolved has not been reported.The aim of this study was to assess the recent evolution of strategies and winning characteristics of NCAA women’s basketball teams. We focused on information from what are generally considered two, distinct competitive levels of the NCAA, Division I (D1, nominally the highest level of competition) and III (D3, nominally the third level of competition in the NCAA). These Divisions are characterized by a distinct set of athletes and resources. Although participation in NCAA basketball is more than a simple function of athletic ability [22], all of these athletes are relatively elite. This is exemplified by only 4.5% of girls who play high school basketball participating at any NCAA level [23]. Moreover, of that group, only 31% are selected to play at the D1 level. In addition, D1 athletes receive an average of approximately $20,000 (USD) annually for providing their athletic services to a school [24] whereas D3 schools do not offer athletic scholarships. Finally, D1 programs historically have approximately five times the monetary resources to support and develop their athletes and teams [25] than do D3 programs [26]. We also focused on information from two seasons, 2009-2010 and 2019-2020. These seasons were immediately prior to or following the PNSRC, or period when the game was poised to experience a significant evolution. We asked whether game-related characteristics i) were similar between competitive levels, ii) were similar before and after the PNSRC, and iii) could be used to differentiate winning and losing teams. We also asked whether any differentiating characteristics iv) were similar between competitive levels, v) were similar before and after the PNSRC, and vi) exhibited specific thresholds associated with wins and losses.
2. Methods
2.1. Study Groups
- We evaluated women’s basketball games associated with competition in NCAA, regular season contests. We focused on games played during the 2009-2010 and 2019-2020 seasons. Within these seasons we evaluated teams from two competitive levels, D1 and D3. Thus, our four study groups were i) D1 teams from the 2009-2010 season, ii) D3 teams from the 2009-2010 season, iii) D1 teams from the 2019-2020 season, and iv) D3 teams from the 2019-2020 season.
2.2. Data
- The data used in this investigation was gathered from standard box scores that were readily available on the internet [e.g. 27]. Although box scores may not be 100% accurate [28], we assumed they were the most accurate data that was summarized, available and would not result in a bias to the analysis [1,29] if playing locations were balanced [28]. Thus, for each of the four study groups, we randomly selected a team (focal team) and then game from which to collect data. Preliminary analysis indicated that approximately 75% of games are decided by no more than 25 points and reflective balanced (the norm for competitive) games, while those decided by more extreme margins (e.g. 52 points) are likely unbalanced games [30]. Thus, for the purposes of this investigation, games decided by more than 25 points were excluded from subsequent analysis. In addition, we reasoned that games that were not decided in regulation time or were decided by three points (one possession) or less (close games) did not provide clarity on which was the better team [31,32]. We also excluded close games from subsequent discriminant analyses. For each study group, this process was repeated until we had collected data for a minimum of 100 games that met our criteria for inclusion.
2.3. Statistics and Variables
- Data for each game focused on statistics associated with the team of interest (FOCAL TEAM) and included 36 variables. Variables typically available from standard box scores included the FOCAL TEAM, their OPPONENT, the number of points scored (PPG), field goals attempted (FGA), field goals made (FGM), field goals attempted from outside the three-point line (3FGA), field goals made from outside the three-point line (3FGM), free throws attempted (FTA), free throws made (FTM), offensive rebounds (OREB), defensive rebounds (DREB), personal fouls (PF), assists (ASST) and turnovers (TO). For the purpose of calculating point margin and rebounding percentages, we also collected data on the points scored by the OPPONENT (OPPG) as well as the number of the OPPONENT’s offensive rebounds (OOREB) and defensive rebounds (ODREB). From these variables, we derived 19 additional variables. Many of the additional variables we assessed are common. For the FOCAL TEAM these included: the percent of attempts that were made (3FG%) from outside the three-point line; the number of field goals attempted (2FGA) or made (2FGM) as well as the percent of attempts that were made (2FG%) from inside the three-point line; and the percent of free throw attempts that were made (FT%). Other variables we assessed are intuitive. These included: the final point differential of the game (OUTCOME) which was positive for a win and negative for a loss; the percent of the total points that resulted from free throws (%P1), from 2FGM (%P2), or from 3FGM (%P3); the percent of FGAs taken from inside the three-point line (%2FGA), or outside the three-point line (%3FGA); the percent of FGAs that were missed and resulted in an offensive rebound (OREB%) or defensive rebound (DREB%); the percent of FGMs that were associated with an assist (ASST%); the percent of POSS that resulted in a TO (TO%); points per possession (PPPOSS); and points per field goal attempt (PPFGA). In addition, in a given game, we estimated the number of possessions for a given team and the shot opportunities per possession. For the estimation of possessions, it was necessary to determine the number of possessions that included FTA, the number of FTA for each, and whether the possession already included a FGA. For both seasons and Divisions, we randomly selected 30 different games and one of the teams in each game. For each of these teams, we evaluated all of the possessions that resulted in at least one free throw, enumerated the number of FTA for those possessions, and differentiated each possession by whether they included a FGA. In total, we evaluated more than 200 possessions from each season and each Division (or more than 800 total possessions). In D1 and D3 games from the 2009-2010 season, the number of FTA that corresponded with one, additional possession in a game was 1.669 and 1.656, respectively. In D1 and D3 games from the 2019-2020 season, the number of FTA that corresponded with one, additional possession in a game was 1.851 and 1.816, respectively. For games from the 2009-2010 season the number of possessions (POSS) for D1 (1) and D3 (2) teams, respectively, was calculated as:
 | (1) |
 | (2) |
 | (3) |
 | (4) |
 | (5) |
 | (6) |
 | (7) |
 | (8) |
2.4. Analysis
- To characterize D1 and D3 teams in each season, we developed summary statistics (e.g. mean) for each variable. To evaluate the characteristics of teams from different seasons, we compared variables between the two seasons within a Division. To evaluate the characteristics of teams from different competitive levels, we compared variables between the two Divisions within a season. This resulted in a comparison of each variable, between seasons within a Division as well as within a season but between Divisions, for a total of four, planned comparisons (of the six possible comparisons). To make these comparisons we used a Student’s t-test (two-tailed). Significance was accepted when P < 0.05 which, after a Bonferroni correction for the planned comparisons, was adjusted to P < 0.0125 [35]. To evaluate whether variables from each of these four datasets would allow us to differentiate between teams that won or lost games, we conducted a linear discriminant analysis on each dataset. We used a forward, stepwise selection process with proportional priors to determine if and which variables would enter into a discriminant model. The significance level for both acceptance into and removal from the discriminant model was set at α = 0.05. If the stepwise selection process resulted in a significant set of explanatory variables, we used those to develop discriminant functions associated with winning or losing a game. For each dataset, the majority of the variables did not exhibit a linear relationship with each other and those that were correlated were not consistent between datasets. Although partial multicollinearity between explanatory variables can inflate variation, make it difficult to detect significance, and complicate the interpretation of discriminant analysis [36] it does not negate the appropriateness of the approach or confidence in the conclusions [37]. Furthermore, linear discriminant analysis generally performs well even if the assumption of common covariance matrix among groups and normality are violated [38]. To characterize the performance of each discriminant model we created a confusion matrix from which we calculated the accuracy, precision, sensitivity and F-1 score of each model. The performance of the models was further validated by using the leave-one-out technique [39] with the existing datasets. In addition, we conducted an exercise in which the original data used from the 2019-2020 season was treated as a training dataset to develop the discriminant functions, and then validated those functions against a test dataset that was developed from 20, randomly selected games from the 2019-2020 season (not already included in the training dataset). This validation procedure was applied to each Division and the percent (± 95% CI, Clopper Pearson) of game outcomes that were classified correctly was determined. Finally, we explored whether there was an absolute threshold for a given variable, above or below which you would always expect a win or a loss (non-overlapping). There is no standard metric to quantify the separation of distributions and determine absolute cut points or thresholds [40,41]. However, we evaluated the relationship between the OUTCOME and the distribution of the values for wins and losses of each explanatory variable. Specifically, each explanatory variable had a distribution associated with wins and a distribution associated with losses. We used Dixon’s Q test to determine the values for each distribution (e.g. DREB for wins) at which anything more extreme would represent an outlier (α = 0.01) to the distribution being assessed. We then assessed whether the paired distribution (e.g. DREB for losses) contained any values that were beyond the outlier values. If they did, we considered the outlier value an absolute threshold, above or below which a win or a loss would essentially be certain.
3. Results
- The D1 database from the 2009-2010 season included 130 different games and 174 unique teams. The D1 database from the 2019-2020 season included 123 different games and 167 unique teams. The D3 database from the 2009-2010 season included 129 different games and 186 unique teams. The D3 database from the 2019-2020 season included 150 different games and 200 unique teams.
3.1. Descriptive Statistics
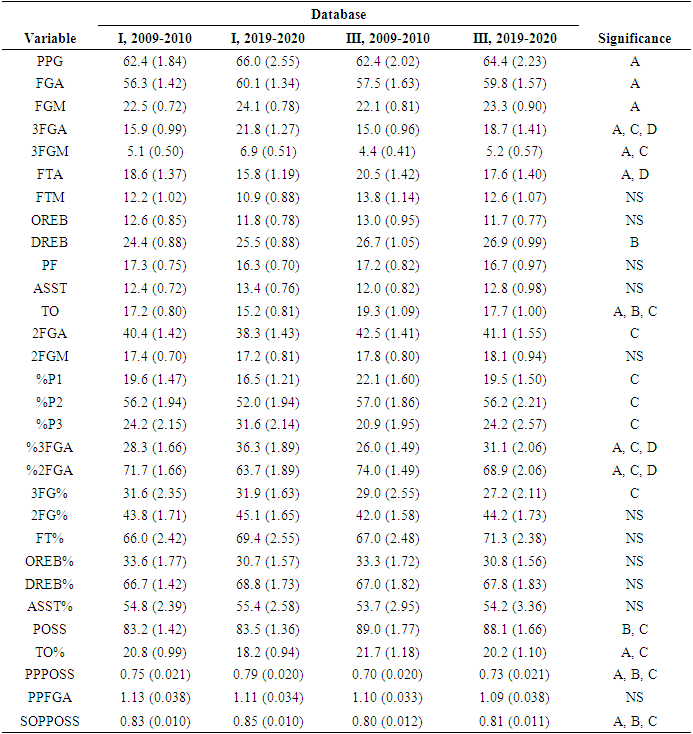
- Of the 36 variables that were considered, three (FOCAL TEAM, OPPONENT, OUTCOME) were used for categorization and three (OPPG, OOREB, ODREB) were opponent variables used for derivation purposes. Planned comparisons were conducted for the remaining 30 variables. Eleven of these variables (FTM, FT%, 2FGM, 2FG%, OREB, OREB%, DREB%, PF, ASST, ASST%, PPFGA) were similar between seasons within a Division as well as within a season between Divisions (Table 1). The other nineteen of these variables exhibited some level of difference. The majority of the variables that exhibited differences (%P1, %P2, %P3, FGA, FGM, 3FGM, 3FG%, 2FGA, PPG, TO%, SOPPOSS) were related to the D1, 2019-2020 season.
3.2. Discriminant Analyses
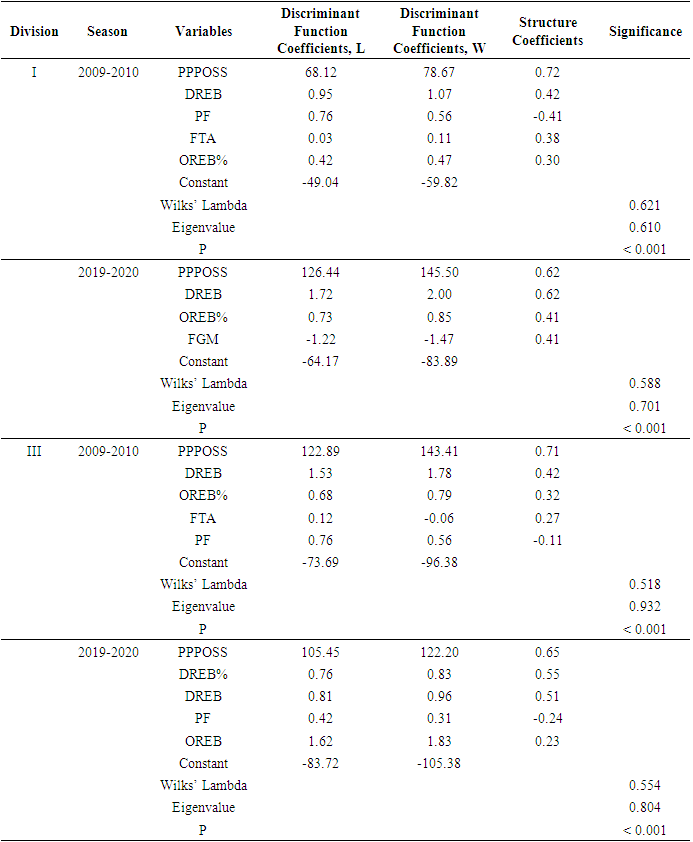
- For each dataset, the stepwise selection process resulted in four or five explanatory variables (Table 2). The variables PPPOSS and DREB were significant explanatory variables in each discriminant model. In some models, explanatory variables also included OREB%, PF, FTA, DREB%, OREB and FGM. The explanatory variable with the greatest influence on each discriminant function (or largest structure coefficient) was either PPPOSS or DREB.
|
3.3. Model Performance
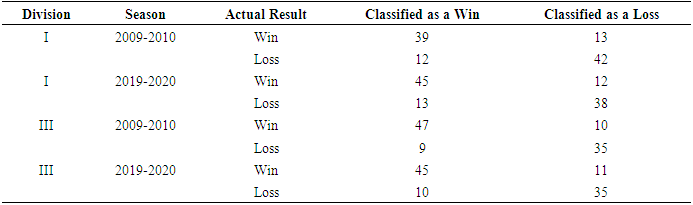
- Based on confusion matrices (Table 3) and cross-validation, each discriminant model performed well. The discriminant model for D1 in the 2009-2010 season had an accuracy of 76.4%, precision of 76.5%, recall of 75.0% and F-1 statistic of 75.7%. The discriminant model for D1 in the 2019-2020 season had an accuracy of 76.9%, precision of 77.6%, recall of 78.9% and F-1 statistic of 78.2%. The discriminant model for D3 in the 2009-2010 season had an accuracy of 81.2%, precision of 82.5%, recall of 83.9% and F-1 statistic of 83.2%. The discriminant model for D3 in the 2019-2020 season had an accuracy of 79.2%, precision of 80.4%, recall of 81.8% and F-1 statistic of 81.1%. Similarly, when models were applied to test datasets, 80.0% (95% CI, 62.1-91.8%) and 85.0% (95% CI, 63.3-93.8%) of the outcomes were classified correctly by the D1 and D3 models, respectively, from the 2019-2020 season.
|
3.4. Absolute Thresholds
- In general, there was substantial overlap in the distributions of each explanatory variable that was associated with the OUTCOME of a game, with no clear absolute threshold (or cut point) differentiating wins and losses. For example, in D1 games during the 2019-2020 season, DREB for teams that lost a given game ranged from 13-36 while for teams that won a given game the range was 15-41 (Figure 1). All teams that had fewer than 15 DREB in a given game lost, but there was only one case. All teams that had more than 36 DREB in a given game won, but there were only four cases. Similarly, PPPOSS for teams that lost a given game ranged from 0.50-0.99 while for teams that won a given game the range was 0.58-1.09. All teams that scored fewer than 0.58 PPOSS in a given game lost, but there were only four cases. All teams that scored more than 0.99 PPPOSS in a given game won, but there were also only four cases. Overall, the four discriminant models resulted in 19 explanatory variables yielding 38 total distributions associated with either wins or losses. Thirty five (92.1%) of those distributions did not have an absolute threshold, and four of these were completely within their paired distribution. Three (7.9%) of those distributions did exhibit an absolute threshold. In D1 games during the 2009-2010 season, > 45 FTA was an absolute threshold for wins. In D3 games during the 2009-2010 season, > 43 FTA was an absolute threshold for wins and < 0.43 PPPOSS was an absolute threshold for losses.
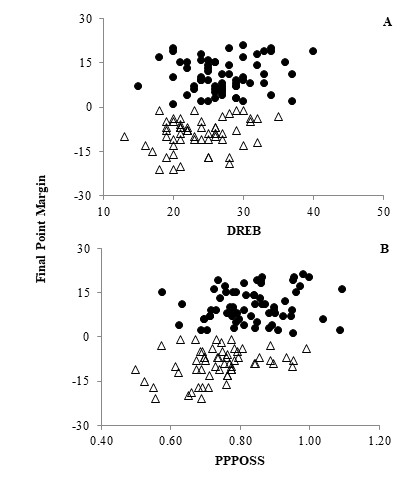 | Figure 1. The relationship between (A) the number of defensive rebounds (DREB) or (B) points per possession (PPPOSS) and the final point margin (OUTCOME) of Division I games during the 2019-2020 season. Wins (solid circles) are reflected by positive final point margins while losses (open diamonds) are reflected by negative final point margins |
4. Discussion
- A primary factor associated with whether a NCAA women’s basketball team won or lost a basketball game was the number of points a team scored during each possession was. This was demonstrated in both Divisions and during both seasons, where PPPOSS was one of the top two variables differentiating winning and losing teams. In addition, structure coefficient values for PPPOSS in discriminatory models ranged from 0.62-0.72, substantially greater than 0.30 threshold often considered meaningful [42]. This finding is consistent with that of Hofer [5] who, in one of the original quantitative analyses of basketball, also found that points per possession was a significant factor differentiating between winning and losing teams in men’s college basketball. In general, however, few analyses have evaluated points per possession directly. Given this, it is instructive to consider the components of a basketball game that influence points per possession. Points per possession is, at least in part, a function of a team’s field goal and free throw percentages (positive relationship) as well as turnover rate (negative relationship). Many studies have reported the significance of both field goal or free throw efficiency and turnover rate to differentiating wins and losses in basketball [e.g. 6,7,31,43]. However, which of the specific characteristics (e.g. 3FG%, TO%) that were significant factors was not consistent in these studies. Furthermore, in our study, many of the components of PPPOSS (e.g. 2FGM, 2FG%, 3FGM, 3FG%) were not significant discriminatory factors. Thus, while it may seem intuitive that scoring more points per possession would be associated with winning, how that is achieved is less clear. There are multiple ways to improve points per possession, which is an integration of numerous variables. The number of defensive rebounds a team accrued was also one of the most significant factors associated with whether a NCAA women’s basketball team won or lost a basketball game. Similar to PPPOSS, DREB was consistently one of the top variables differentiating winning and losing teams. The structure coefficient values for DREB in discriminatory models ranged from 0.42-0.62, again emphasizing their importance. This finding corroborates what many, perhaps most, of the previous analyses have reported. The importance of defensive rebounds has been demonstrated for both men [44] and women [42,45], in multiple countries or leagues [7,46] and across multiple age classes [10,31]. However, not all studies have found defensive rebounds to be useful for discriminating success. For example, Madarame [42] did not find defensive rebounds to be discriminatory for games played in Asian women’s championships. Madarame suggested that turnover rate may have been sufficiently high that it reduced the opportunity for and importance of defensive rebounding. In addition, Ibáñez et al. [3] did not find defensive rebounds to be discriminatory when the criterion was season-long success, rather than an individual game. They found assists were the primary factor and suggested the importance of team play to season-long success. Despite this, it is reasonable to infer that season-long success is related to winning or losing individual games. Thus, while each of these findings are important, they describe somewhat unique circumstances and must be interpreted in the proper context. Given the overall weight of evidence, it seems clear that defensive rebounding is generally of primary importance to winning games. The most significant game-related characteristics associated with winning basketball persisted through time. This notion is supported by our finding that the significance of PPPOSS and DREB was evident during the 2009-2010 season and then again in the 2019-2020 season. While this time span was only 10 years, these seasons bracketed a significant period of rules changes, an opportunity for changes to the game [16], and 14-18 years can represent an era [14]. In addition, this finding was consistent in both levels of competition and is also consistent with studies outside of NCAA women’s basketball. The importance of defensive rebounds to differentiating winning and losing teams has been documented since some of the earliest quantitative analyses [47] and in each subsequent decade [see 43]. Furthermore, although few studies have directly evaluated points per possession, the importance of field goal efficiency, production from free throws and turnover rate (components of points per possession) has also been consistent [e.g. 6,7,30,43] since quantitative analyses began to be reported [47,48,49]. In general, quantitative analyses of women’s basketball are limited [9,42], particularly for the NCAA. As such, a long-term assessments of winning characteristics for NCAA women is difficult to perform. Our work potentially represents a starting point for future assessments. In addition, our evaluation is consistent with what others have reported and furthers the notion that points per possession and the number of defensive rebounds has consistently remain important to winning basketball games. Characteristics important to winning games are best considered in combination. This was evidenced by our limited ability to identify an absolute threshold for any one characteristic that allowed wins and losses to be differentiated. For example, our analysis of D1 games in the 2019-2020 season demonstrated that the characteristics PPPOSS, DREB, OREB%, FGM could be used to differentiate wins from losses. However, there was not an absolute threshold of any characteristic (e.g. DREB > 25) that appeared to correspond with the certainty of a win or a loss. Rather, the model indicated there were varying scenarios that were associated with winning games. A win might be predicted if a team performed slightly better than average in each discriminatory characteristic. Alternatively, a win might be predicted if a team performed exceptionally well in some of these characteristics and average (or at times below average) in others. Hofer [5] also found an overlap in the values of characteristics exhibited by winning and losing teams (e.g. no absolute threshold). Our findings are also consistent with models from various studies [e.g. 7,8,31] which demonstrated there are often multiple characteristics associated with differentiating wins and losses. Reports discussing the interaction of discriminating characteristics are not uncommon. Oliver [6] identified four factors as being central to success in basketball and described how holding one factor constant could influence the interpretation of another factor. In addition, it is important to consider these factors relative to both teams [1]. Cabarkapa et al. [43] reported that field goal percentage alone accounted for 13.6% of variance they observed in wins and losses. However, when they included free throw percentage and evaluated overall shooting efficiency, their model accounted for 23-26% of the variance they observed. Although it is possible for a single characteristic to be a critical discriminating factor [30], it is uncommon for one characteristic to adequately differentiate wins and losses. Game strategies in NCAA women’s basketball evolved rapidly, specifically with an increased emphasis on the three-point shot. This was evident in both Divisions and centered around changes associated with shot selection. In both cases, 3FGA as well as %FGA3 exhibited a 20-37% increase between the 2009-2010 and 2019-2020 seasons. The increases we observed were at the expense of %FGA2 as well as FTA. Given these changes were detectable after as short as a 10 year period helps to illustrate the rapid rate at which they evolved. This is similar to other reports that changes which are significant enough to define eras can occur in as little as 14-18 year periods [14]. Our finding may be reflective of a consistent trend in basketball, and not unexpected. Recent studies have quantified an increase in three-point attempts in Euroleague basketball [50] and an increase in the fraction of three-point attempts in NCAA men’s basketball [51]. The changes we noted are also consistent with various data sources on [e.g. 10] and speculation about [e.g. 21] the NCAA women’s game. However, our work represents one of the first quantitative analyses of this information. It was beyond the scope of this study to identify the specific causes of changes to game strategies. However, it is reasonable to suggest that the recent strategy may be driven to some extent by rule changes [16] and the use of statistics [42], both of which can affect how basketball is played. Whatever the causes, the effectiveness of this evolutionary path may be contrary to analyses suggesting that increases in the fraction of three-point shots can be counter-productive [51] and may not be associated with winning. The level of competition was related to how game strategies evolved in NCAA women’s basketball. Multiple lines of evidence support this claim. In the 2009-2010 season, we observed relatively few differences between D1 and D3 games. When compared to D3 games, games in D1 were slower (lower POSS) and had fewer TOs leading to more SOPPOSS and PPPOSS. However, in the 2019-2020 season, D1 and D3 games exhibited differences in almost half of the variables we evaluated. Furthermore, the number of variables that differed between seasons in D1 games (12) was threefold greater than the number of variables that differed in D3 games (4). In addition to the changes noted previously, D1 games also exhibited an increase in 3FGM, FGA, FGM, SOPPOSS, PPPOSS and PPG as well as decreases in TO and TO% between the 2009-2010 and 2019-2020 seasons. Games in D3 did not exhibit any of these changes. Our findings are consistent with recent reports on evolving strategies in basketball. For example, in Euroleague games, Durmuş and Erdeveciler [50] also documented an increase in three-point field goals that were made and a decrease in two-point attempts. Although a limited number of studies have evaluated multiple competitive levels in the NCAA [e.g. 28], we are not aware of any that have specifically evaluated the relationship between competitive level within a league or system and the evolution of game strategies. Again, it is useful to consider the relationship between components of a basketball game. It is possible that an increased emphasis on three-point shots may be consistent with a reduced need to pass or drive the basketball inside the three-point line, leading to fewer turnovers and a lower turnover rate which, ultimately, may allow for additional field goals to be attempted and made. Since the adoption of the three-point line, Stefani [51] documented a similar trend in NCAA men’s basketball. Although we observed D1 and D3 games to be evolving differently, whether one Division has the better strategy is unclear.
5. Conclusions
- To our knowledge, our work represents one of the first, quantitative analyses of NCAA women’s basketball. We quantified how game strategies evolved over a relatively short period (10 years), perhaps in part as a result of significant changes to the rules governing the game. Despite the change in strategies, the characteristics associated with winning generally remained consistent. Furthermore, these characteristics were similar to those that have been identified numerous times and since quantitative analysis began being applied to basketball. As a result, a mismatch may exist between how strategies are evolving and the characteristics associated with winning. In both Divisions and seasons, none of the characteristics useful for differentiating wins and losses were directly associated with three-point shooting. Also, rather than any single characteristic having a specific threshold associated with winning, it is likely that characteristics are best considered in combination. Thus, while it is undoubtedly important for game strategies to focus on the characteristics associated with winning [8], it may be equally important for strategies to consider the relative strengths of a team and how they best integrate the different phases of basketball to achieve a winning combination of characteristics [52].
ACKNOWLEDGEMENTS
- Although too numerous to list individually, the authors would like to thank the coaches and players of the women’s basketball teams at Lewis and Clark College (2004-2014) and Transylvania University (2014-2024) for inspiring the need for this analysis. We are also grateful to Loren Bewley and Neva Hauser for invaluable help with data collection; Robyn Fralick, and Lindsay Shade for discussions which improved the analysis; Jon Levinson and Connie Perkins for their expertise regarding the history of rule changes; as well as Holly Sheilley for providing the opportunity for this analysis to come to fruition. This study was conceived and completed during a period when each coauthor was professionally affiliated with Transylvania University.
References
| [1] | Kubatko, J., Oliver, D., Pelton, K., and Rosenbaum, D. T., 2007, A starting point for analyzing basketball statistics., J. Quant. Anal. Sports, 3, Article 1. |
| [2] | McGuire F., 1959, Defensive Basketball., J. Prentice Hall, Inc., New Jersey, USA. |
| [3] | Ibáñez, S. J., Sampaio, J., Feu, S., Lorenzo, A., Gómez, M. A., and Ortega, E., 2008, Basketball game-related statistics that discriminate between teams’ season-long success., Euro. J. Sport Sci., 8, 369-372. |
| [4] | Terner, Z., and Franks, A., 2021, Modeling player and team performance in basketball., Ann. Rev. Stat. Appl., 8, 1-23. |
| [5] | Hofer Jr., H. H., “A study of men's college basketball statistics and their relationship to winning and losing,” Dr. Ed. Dissertation, East Texas State Univ, Commerce, Texas, 1990. |
| [6] | Oliver, D., 2004, Basketball on paper: Rules and tools for performance analysis., Brassey's, Inc., Washington, DC, USA. |
| [7] | Leicht, A. S., Gómez, M. A., and Woods, C. T., 2017, Team performance indicators explain outcome during women’s basketball matches at the Olympic Games., Sports, 5, 96. |
| [8] | Lorenzo, A., Gómez, M. A., Ortega, E., Ibáñez, S. J., and Sampaio, J., 2010, Game related statistics which discriminate between winning and losing under-16 male basketball games., J. Sports Sci. Med., 9, 664-668. |
| [9] | WentingWang, R. M., 2014, Predicting winners of NCAA women’s basketball tournament games., Int. J. Sports Sci., 4, 173-180. |
| [10] | HER. (2024) Her hoop stats. [Online] Available: https://herhoopstats.com/stats/ncaa/research/team_single_seasons/?min_season=2024&max_season=2024 &season_type=reg&submit=true&stats_to_show=advanced&critria1=opp_pts_per_100_poss&comp1=ge &threshold1=0 (accessed April 12, 2024). |
| [11] | Medium. (2019) How is NCAA women’s basketball evolving? [Online] Available: https://medium.com/her-hoop-stats/how-is-ncaa-womens-basketball-evolving-e3395a8f8823 (accessed April 11, 2024). |
| [12] | BI. (2024) The popularity of NCAA women’s basketball. [Online] Available: https://www.businessinsider.com/ncaa-college-womens-basketball-tv-ratings-popularity-wnba-caitlin-clark -2024-4. (accessed April 24, 2024). |
| [13] | Fury, S., 2016, Rise and Fire: The Origins, Science, and Evolution of the Jump Shot--and How It Transformed Basketball Forever., : Macmillan, New York, USA. |
| [14] | Rocha da Silva, J. V., and Rodrigues, P. C., 2021, The three Eras of the NBA regular seasons: Historical trend and success factors., J. Sports Anal., 7, 263-275. |
| [15] | Mancha-Triguero, D., Martín-Encinas, N., andIbáñez, S. J., 2020, Evolution of physical fitness in formative female basketball players: A case study., Sports, 8, 97. |
| [16] | Ibañez S. J., García-Rubio, J., Gómez, M. A., and Gonzalez-Espinosa, S., 2018, The impact of rule modifications on elite basketball teams’ performance., J. Human Kin., 64, 181-193. |
| [17] | Nourayi, M., 2019, Strategically driven rule changes in NBA: Causes and consequences., The Sport J., 22, 1-1. |
| [18] | Hult J. S., and M. Trekell, M., 1991, A Century of Women's Basketball. From Frailty to Final Four., AAHPERD Publications Sales, Virginia, USA. |
| [19] | Jiang, R. S., and Lee, P. C., 2016, An Evolution of the Migration of Taiwanese Female Basketball Players: From the ‘American Dream’to the ‘Chinese Dream’., The Intern. J. Hist. Sport, 33, 2253-2270. |
| [20] | NCAA. (2019) NCAA Women’s basketball playing rules history. [Online] Available: http://fs.ncaa.org/Docs/stats/w_basketball_RB/2019/Rules_History.pdf (accessed February 14, 2024). |
| [21] | USA. (2024) Women’s college basketball is faster than it’s ever been. Result: more records falling. [Online] Available: https://www.usatoday.com/story/sports/ncaaw/2024/03/22/womens-ncaa-tournament-basketball-faster-records/73046610007/ (accessed March 5, 2024). |
| [22] | Tompsett, J., and Knoester, C., 2021, The making of a college athlete: High school experiences, socioeconomic advantages, and the likelihood of playing college sports., Sociol. Sport J., 39, 129-140. |
| [23] | NCAA. (2015) Estimated probability of competing in college athletics. [Online] Available: https://www.ncaa.org/sports/2015/3/2/estimated-probability-of-competing-in-college-athletics.aspx (accessed October 23, 2023). |
| [24] | SS. (2022) Scholarship Statistics. [Online] Available: https://scholarshipstats.com/basketball (accessed April 12, 2024). |
| [25] | DIY. (2014) How much colleges spend on D1 women’s basketball. [Online] Available: https://diycollegerankings.com/much-colleges-spend-d1-womens-basketball-programs/7504/#:~:text= There%20are%20342%20D1%20women's,attributable%20to%20intercollegiate%20athletic%20activities. (accessed November 12, 2023). |
| [26] | D. L. Fulks, (2010) NCAA revenues and expenses. [Online] Available: https://files.eric.ed.gov/fulltext/ED521369.pdf (accessed November 12, 2023). |
| [27] | Page, G. L, Fellingham, G. W., and Reese, C. S., 2007, Using Box-Scores to Determine a Position's Contribution to Winning Basketball Games., J. Quant. Anal. Sports, 3, 4. |
| [28] | van Bommel, M., Bornn, L., Chow-White, P., and Gao, C., 2021, Home sweet home: Quantifying home court advantages for NCAA basketball statistics., J. Sports Anal., 7, 25-36. |
| [29] | Osken, C., and Onay, C., 2022, Predicting the winning team in basketball: A novel approach., Heliyon, 8. |
| [30] | Sampaio, J., and Janeira, M., 2003, Statistical analyses of basketball team performance: understanding teams’ wins and losses according to a different index of ball possessions. Int. J. Perf. Anal. Sport, 3, 40-49. |
| [31] | Csataljay G., O’Donoghue, P., Hughes, M., and Dancs, H., 2009, Performance indicators that distinguish winning and losing teams in basketball, Int. J. Perf. Anal. Sport, 9, 60-66. |
| [32] | Gómez M.A., Gasperi, L., and Lupo, C., 2016, Performance analysis of game dynamics during the 4th game quarter of NBA close games., Int. J. Perf. Anal. Sport, 16, 249-263. |
| [33] | Smith, D., and Spear, R. B., 1999, Basketball: Multiple Offense and Defense., Allyn and Bacon, Massachusetts, USA. |
| [34] | Williams, B. K., and Titus, K., 1988, Assessment of sampling stability in ecological applications of discriminant analysis., Ecology, 69, 1275-1285. |
| [35] | Armstrong R. A., Davies, L. N., Dunne, M. C., and Gilmartin, B., 2011, Statistical guidelines for clinical studies of human vision., Ophth. Physiol. Optics, 31, 123-136. |
| [36] | Siegel, A.F., 2016, Practical Business Statistics, 7th ed., Academic Press, Massachusetts, USA. |
| [37] | D. S. Voss, 2005, Multicollinearity., In: Encyclopedia of Social Measurement, K. Kempf-Leonard, Ed., New York, USA: Elsevier, 2005. |
| [38] | Duda, R. O., P. E. Hart, and Stork, D. G., 2001, Pattern Classification., John Wiley & Sons, Inc., New Jersey, USA. |
| [39] | Cawley G.C., and Talbot, N. L., 2003, Efficient leave-one-out cross-validation of kernel fisher discriminant classifiers., Pat. Recog., 36, 2585-2592. |
| [40] | Goodpaster, A. M., and Kennedy, M. A., 2011, Quantification and statistical significance analysis of group separation in NMR-based metabonomics studies., Chemo. Intel. Lab. Syst., 109, 162-170. |
| [41] | Shen, M., and Dai, T., 2021, Statistical methods of screening cut point determination in immunogenicity studies., Bioanalysis, 13, 551-563. |
| [42] | Madarame, H., 2018, Defensive rebounds discriminate winners from losers in European but not in Asian women’s basketball championships., Asian J. Sports Med., 9. |
| [43] | Cabarkapa D., Deane, M. A., Fry, A. C., Jones, G. T., Cabarkapa, D. V., Philipp, N. M., and Yu, D., 2022, Game statistics that discriminate winning and losing at the NBA level of basketball competition., Plos One, 17, e0273427. |
| [44] | Trninić, S., Dizdar, D., and Lukšić, E., 2002, Differences between winning and defeated top quality basketball teams in final tournaments of European club championship., Colleg. Antropol., 26, 521-531. |
| [45] | Gómez, M. A., Lorenzo, A., Barakat, R., Ortega, E., and Palao, J. M., 2008, Differences in game-related statistics of basketball performance by game location for men’s winning and losing teams., Percept. Motor Skill, 106, 43-50. |
| [46] | Mendes, L., and Janeira, M., 2001, Basketball performance-multivariate study in Portuguese professional male basketball teams., Not. Anal. Sport–IV, 103, 111. |
| [47] | Akers, M. D., S. Wolff, S., and Buttross, T., 1991, An empirical examination of the factors affecting the success of NCAA Division I College Basketball teams., The J. Bus. Econ. Studies, 1, 14-21. |
| [48] | Ittenbach, F., Kloos, T., and Etheridge, J. D., 1992, Team performance and national polls: the 1990-91 NCAA Division 1 Basketball season., Percept. Motor Skills, 74, 707-710. |
| [49] | Kozar, B., Vaughn, R. E., Whitfield, K. E., Lord, R. H., and Dye, B., 1994, Importance of free-throws at various stages of basketball games., Percept. Motor Skills, 78, 243-248. |
| [50] | Durmuş T., and Erdeveciler, Ö., 2023, Shot Selection Trends in Euroleague Basketball from 2013 to 2023., Perform. Anal. Sport Exer., 2, 18-24. |
| [51] | Stefani, R., 2023, The Improvement in NCAA Division 1 Basketball Free Throw Accuracy Since 1987, and the Counter-Productive Increased Reliance on Three-Point Shots: Balancing two-point shooting with three-point shooting., Math. Sports, 5. |
| [52] | Sampaio, J., Ibáñez, S. J., and Feu, S., 2004, Discriminative power of basketball game-related statistics by level of competition and sex., Percept. Motor Skills, 99, 1231-1238. |