-
Paper Information
- Paper Submission
-
Journal Information
- About This Journal
- Editorial Board
- Current Issue
- Archive
- Author Guidelines
- Contact Us
International Journal of Sports Science
p-ISSN: 2169-8759 e-ISSN: 2169-8791
2023; 13(1): 14-18
doi:10.5923/j.sports.20231301.03
Received: Feb. 19, 2023; Accepted: Mar. 16, 2023; Published: Mar. 21, 2023

Evaluation of Tactile Array Grip Force Data
 Abstract
 Reference
 Full-Text PDF
 Full-text HTML
Dallas D. Fichtner1, John W. McChesney2, Mark DeBeliso3
1University of Wyoming, Laramie, Wyoming, USA
2Boise State University, Boise, Idaho, USA
3Southern Utah University, Cedar City, Utah, USA
Correspondence to: Mark DeBeliso, Southern Utah University, Cedar City, Utah, USA.
| Email: |  |
Copyright © 2023 The Author(s). Published by Scientific & Academic Publishing.
This work is licensed under the Creative Commons Attribution International License (CC BY).
http://creativecommons.org/licenses/by/4.0/

Data from a grip force measurement system, as previously described, consisting of a tactile array transducer for assessing the grip capability/capacity of the human hand was analyzed. Purpose: The purpose of this study was to 1) establish normative grip and individual finger strength values for the ForceMapTM and 2) compare the total force measurements collected using the ForceMapTM with those collected using the JamarTM. Methods: This was a retrospective analysis of data collected using the ForceMapTM and JamarTM dynamometers. T-tests were used to compare the ForceMapTM and the JamarTM dynamometers’ force measurements, dominant and non-dominant hands, and intergender differences. Correlation testing was also done between the ForceMapTM data and JamarTM data. Correlation testing was done between the subjects’ maximum grip strength forces using both types of machine and their height, weight, and hand size. Results: It was found that the measurements from the ForceMapTM were significantly higher than those from the JamarTM. There was a strong correlation between these two methods except for the with the women’s dominant hand. Normative total force and individual finger pressure measurements were found for men and women. There was no correlation between the body size and hand grip strength. A strong correlation existed between grip contact area and total grip strength measured with the ForceMapTM. Conclusion: This study has shed light on a new tool and method for hand function evaluation that may provide more detailed information and eventually enhance clinical assessment and the rehabilitation process.
Keywords: Grip strength measurement, Grip ForceMapTM, JamarTM, Grip pressure distribution
Cite this paper: Dallas D. Fichtner, John W. McChesney, Mark DeBeliso, Evaluation of Tactile Array Grip Force Data, International Journal of Sports Science, Vol. 13 No. 1, 2023, pp. 14-18. doi: 10.5923/j.sports.20231301.03.
Article Outline
1. Introduction
- To date, parallel bar dynamometry has been the technique of choice for clinical grip strength measurement. The well-known JamarTM (Asimov Engineering Co., Los Angeles, CA) hand-held dynamometer has long been considered the gold standard for assessing grip strength. The vast majority of clinicians think of the JamarTM as being the most accurate, reliable, and valid measurement tool for assessing grip strength [1,2].The JamarTM dynamometer consists of a curved metal bar that is placed with the convex side into the thenar eminence of the hand being tested. In test position, the patient grasps two metal bars of the apparatus in a “U” grip shape. These two bars have adjustment rungs every 12.5mm which allows for use by patients with various hand sizes. These machines typically include an analog dial for indicating forces produced and can either be hydraulic or spring loaded in nature. While this device has become the standard of the industry, the device has shortcomings and new technology serves to better the clinical evaluation of grip strength (Figure 1).
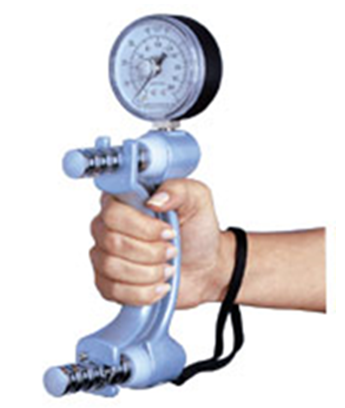 | Figure 1. The JamarTM parallel bar dynamometer |
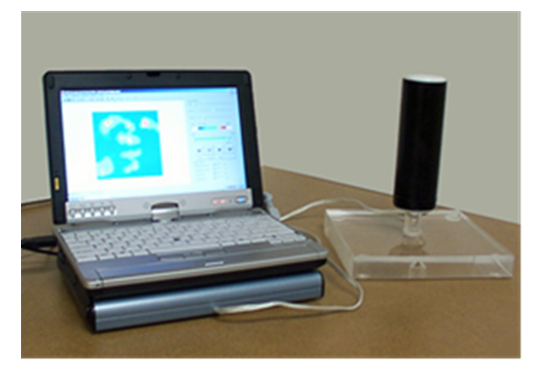 | Figure 2. The ForceMapTM tactile array grip force system |
2. Methods
2.1. Procedures and Instruments
- This was a retrospective analysis of previously collected data which was obtained by MMD Incorporated using the ForceMapTM and JamarTM grip strength dynamometers. MMD Incorporated collected this data using the standard protocol that has been set by the American Society of Hand Therapists for the use of the JamarTM dynamometer where the subject is seated with the shoulder at zero degrees of abduction and flexion, the elbow at 90° of flexion, and the forearm at neutral pronation and supination [4].Unidentifiable subject records were accessed with written permission from MMD Incorporated to allow for analysis of as many subjects as possible. There were 28 adult males and 28 adult females whose data were used for this study. The data analysis was conducted using the ForceMapTM software. This software allows for general grip force in pounds to be assessed as well as forces from specific grip regions and region groups (i.e. individual or grouped fingers). Data that was analyzed for this study was subject age, their maximum grip strength using the JamarTM dynamometer, and their maximum grip strength and individual finger strength using the ForceMapTM. Secondarily, the subjects’ hand size, height, and weight, was correlated with the grip strength data.
2.2. Analysis
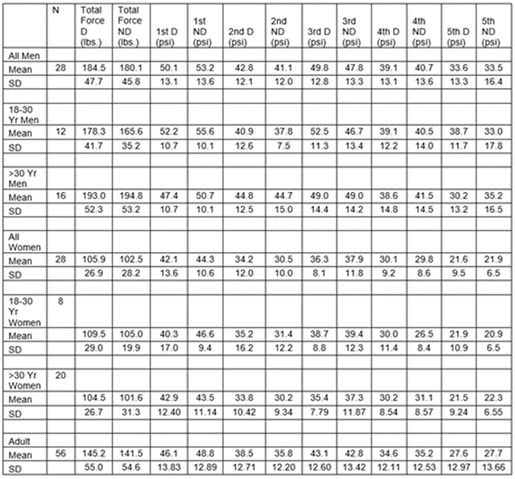
- The Microsoft Excel spreadsheet software was used to analyze the data for this study. Paired, two-tailed t-tests, were used to identify a significant difference between the ForceMapTM dynamometer and the JamarTM dynamometer’s force measurements at both of the subjects’ maximum grip strength trials. Pearson’s R correlation testing was also done between the ForceMapTM data and JamarTM data at both trials of 100% of the subjects’ maximum grip strength in order to see if any relationship is present between the two instruments.Differences between the subjects’ dominant and non-dominant hand for total grip force using the ForceMapTM, total grip force using the JamarTM, and individual finger pressures using the ForceMapTM were also assessed using standardized t-tests, paired two samples for means. This test was also used to observe intergender differences between these same variables.Pearson’s r correlations were used to compare the subjects’ maximum grip strength forces of both their dominant and non-dominant hands using the ForceMapTM with their height and weight. There were also Pearson’s R correlation tests done to look at the relationship between the subjects’ total grip force using the JamarTM and their hand length from the distal wrist flexion crease to the tip of the third finger and between the total grip force using the JamarTM and the hand width, which was the width at the palmar creases. This was done for the right hand only as only scans of the subjects’ right hands were available.Mean total grip forces were also analyzed for all subjects. The mean total forces for all male subjects was calculated as well as those forces for the male subjects aged 18 to 30 years and the male subjects over 30 years old. Similarly, female subjects were analyzed as was the data for female subjects aged 18 to 30 years and those over 30 years old. Across subjects, grip force analysis was completed for the variables of total grip force using the ForceMapTM on the dominant and non-dominant hands, total grip force using the JamarTM on both the dominant and non-dominant hand, and the individual finger pressures, which was the measurement of the cell with the maximum pressure in pounds per square inch (psi). These mean values were then translated into being normative values for each group.
3. Results
- The main goal of this study was to compare total grip force values found using the ForceMapTM and JamarTM dynamometer. When assessing men’s total grip of the dominant hand using a standard two-tailed t-test, it was found that there was a significant difference between the measurements taken from the ForceMapTM and the JamarTM with the average total force measurement found using the ForceMapTM being 184.55 pounds ± 47.32 and the measurement found using the JamarTM being 109.25 pounds ± 23.83, n=28 (Figure 3).
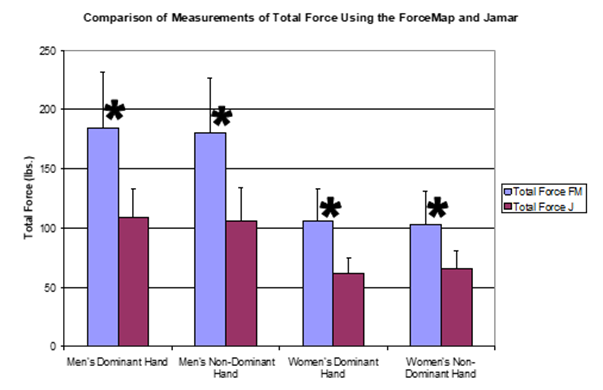 | Figure 3. Comparative measurements in pounds found using ForceMapTM to those found using the JamarTM for the men’s dominant hand, men’s non-dominant hand, women’s dominant hand, and women’s non-dominant hand, p<0.05 |
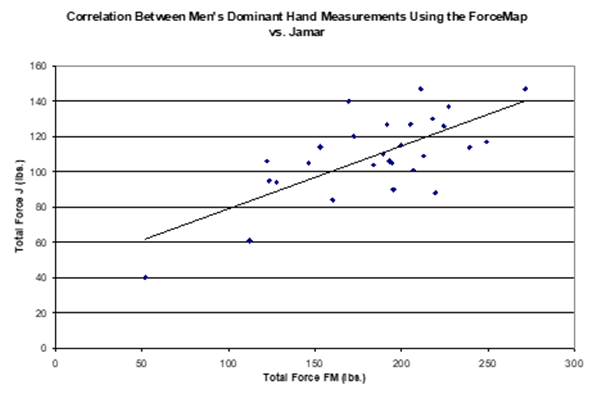 | Figure 4. Correlation between the measurements found using ForceMapTM and those found using the JamarTM for the men’s dominant hand, r=0.709 |
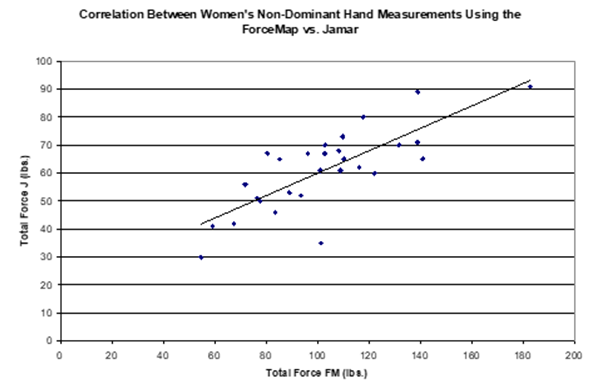 | Figure 5. Correlation between the measurements found using ForceMapTM and those found using the JamarTM for the women’s non-dominant hand, r=0.781 |
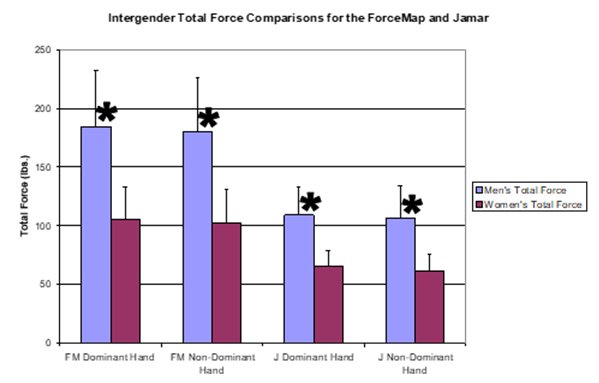 | Figure 6. Comparison of total force measurements between men and women for both the dominant and non-dominant hands using the ForceMapTM and JamarTM, p≤0.05 |
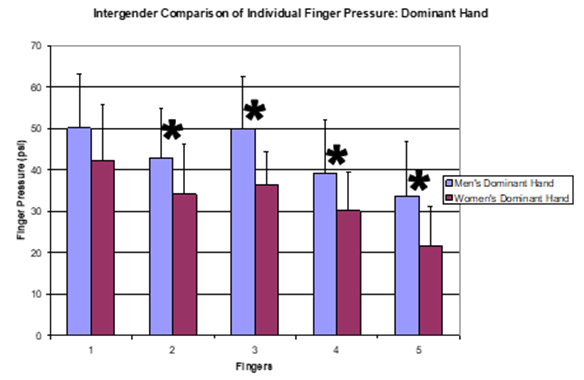 | Figure 7. Comparison of individual finger pressures in maximum pounds per square inch (psi) between men and women on the dominant hand using the ForceMapTM, p≤0.05 |
|
4. Discussion
- It was observed that the ForceMapTM measurements were significantly higher than those recorded when using the JamarTM. It is possible that these differences are due to the fact that the force produced over the entire hand is measured by the ForceMapTM, while the JamarTM is only measuring the squeezing force of the four small fingers. The ForceMapTM also has the capability to measure the force produced by the distal phalanges of all five fingers, where when using the JamarTM, the distal phalanges of the fingers are strictly used to hook the bar of the JamarTM. The thumb is also used very little when using the JamarTM. The back bar of the JamarTM actually rests across the thenar eminence. The thumb is not used to a large degree when squeezing the JamarTM. The fact that the thumb and the distal phalanges are not used to grip the JamarTM suggests that a percentage of the gripping forces produced by the flexor digitorum profundus and the flexor pollicis longus muscles are negated since these muscles have their distal attachments to the distal phalanges. Nevertheless, it is of interest that there was a strong positive correlation shown between the total force measurements taken from the ForceMapTM and those taken from the JamarTM dynamometer. There were also significant differences between the men’s and women’s total force measurements for both hands using both measurement methods. This was anticipated based on results from Mathiowetz and colleagues who showed there to be a difference between the men’s and women’s normative values for total force using the JamarTM dynamometer [5]. Since there is a strong correlation between the total force measurements from the ForceMapTM and JamarTM, one can assume that if there is a significant difference in the measurements retrieved from one of the machines there will be a significant difference in the measurements retrieved from the other. We hypothesize that the difference between the total force measurements observed when using the ForceMapTM and those observed when using the JamarTM results from the addition of the forces being produced by the palm, the thumb, and the distal phalanges of the finger, which are measurable components of the grip when using the ForceMapTM.When observing the correlation between the subjects’ total force produced measured by the JamarTM and the length of the subjects’ right hand, no relationship was found. This was also true for the subjects’ hand width. The ForceMapTM is designed to take force readings over the entire hand or grip area. Since more force values are being recorded, this will increase the total force measured.It appears that individual grasp styles may change when gripping with maximum pressure with age. For example, men of 18 to 30 years of age tended to have a higher grip pressure with their first finger (thumb) than men who were over 30 years of age. The opposite was true in these two age groups when examining data from the second (index) finger. Also, women 18 to 30 years of age gripped with a greater amount of pressure than the women who were over 30 years of age with their second (index) and third (middle) fingers, but the women who were over 30 years old gripped with more pressure than the women who were 18 to 30 years old with their fourth finger (ring finger). These strength differences support the concept of age-related adjustments in motor strategy.More investigation may be of benefit to validate the ForceMapTM as an accurate grip force measurement tool. It may also be interesting to further quantify total force values for each finger in order to see what percentage of the total force is produced by each finger and compare that to the previous studies done by Kinoshita and colleagues as well as Radwin and Oh [6,7].
5. Conclusions
- In conclusion, the JamarTM hand dynamometer has served as a very reliable research and clinical hand evaluation tool for many years and the contributions of which to orthopedics and physical therapy cannot be overstated. This study has shed light on a new tool and method for hand function evaluation that may provide more detailed information and eventually enhance clinical assessment and the rehabilitation process.