-
Paper Information
- Paper Submission
-
Journal Information
- About This Journal
- Editorial Board
- Current Issue
- Archive
- Author Guidelines
- Contact Us
International Journal of Sports Science
p-ISSN: 2169-8759 e-ISSN: 2169-8791
2021; 11(2): 25-30
doi:10.5923/j.sports.20211102.01
Received: Jul. 22, 2021; Accepted: Aug. 2, 2021; Published: Aug. 15, 2021

Sweat Rates and Hydration in CrossFit Athletes
 Abstract
 Reference
 Full-Text PDF
 Full-text HTML
Jorge L. Ceja, Andrew Harveson, Levi Garrett, Ed Garrett
Department of Health Science, California Baptist University, Riverside, California, United States
Correspondence to: Jorge L. Ceja, Department of Health Science, California Baptist University, Riverside, California, United States.
| Email: |  |
Copyright © 2021 The Author(s). Published by Scientific & Academic Publishing.
This work is licensed under the Creative Commons Attribution International License (CC BY).
http://creativecommons.org/licenses/by/4.0/

Given the intense and varied physical demands placed on CrossFit athletes, especially during competition, it is vital that more information be gathered to best inform safe practice. The purpose of this study was to analyze the sweat rates (L/h) and hydration indices (USG) of CrossFit athletes throughout a weekend long mock competition. Ten participants were recruited, eight male (34.5 ± 4.7 y; 81.5 ± 2.12 kg) and two female (31.5 ± 4.8 y; 65.45 ± 2.3 kg). All participants were pre-registered for a local competition that was canceled due to the COVID-19 pandemic. In its place, a mock competition took place over two days, with a total of five workouts (WODs) completed. Body weight was obtained before and after each WOD. USG was assessed on both days of the competition prior to starting any physical activity and after the completion of the last workout. Mean sweat rate was 1.59 ± 0.34 L/h, averaging a body mass loss of 2.025 ± 0.439 percent per hour of training. Pre-competition USG indices indicated that six athletes arrived with significant dehydration (USG 1.021-1.030) and one athlete with serious dehydration (USG >1.030). Post-competition four athletes remained well-hydrated (USG <1.010) while six athletes remained minimally to significantly dehydrated (USG 1.01-1.03). Hydration indices indicate that CrossFit athletes are likely to begin and end competition in a dehydrated state, which can negatively impact performance. Given the observed rate of body weight lost per hour, CrossFit athletes should seek to adhere to hydration protocols for performance and health.
Keywords: Fluid loss, Urine Specific Gravity, Dehydration, Performance, Competition
Cite this paper: Jorge L. Ceja, Andrew Harveson, Levi Garrett, Ed Garrett, Sweat Rates and Hydration in CrossFit Athletes, International Journal of Sports Science, Vol. 11 No. 2, 2021, pp. 25-30. doi: 10.5923/j.sports.20211102.01.
Article Outline
1. Introduction
- CrossFit is a fairly new sport, established in 2000, but has become internationally known after the first CrossFit games in 2007. Since then, it has experienced steady growth and popularity around the globe. CrossFit varies in intensity and duration and incorporates aspects of multiple sports into its workouts. A typical workout of the day (WOD) can include endurance exercises (running, biking, swimming, rowing, etc.) resistance training (body weight, gymnastics, Olympic weightlifting, powerlifting, etc.) mixed in a variety of ways. Despite its rapid growth, very little research has been done to evaluate methods of maintaining or improving athlete health and performance throughout training or competitions within CrossFit. Specifically, very little is known about fluid loss and hydration strategies during CrossFit competitions, which can have a duration of 2-4 days. Water serves many important purposes in the human body, such as regulation of body temperature, tissue and cell lubricant, and is needed for metabolic reactions involved in energy production [13]. According to Sawka and Noakes [20], dehydration is considered a decrease of 2% of body weight in fluids as a result of physical activity and has been shown to have a negative effect on exercise performance by augmenting perception of effort, increasing cardiovascular strain, altering central nervous system functions and inducing hyperthermia. Moreover, a state of reduced total body water appears to negatively affect common physiological demands also found in CrossFit WODs: muscular strength, power, and high-intensity muscular endurance [10]. Hypohydration also modifies the endocrine and metabolic responses to resistance exercise by increasing catabolic hormonal response and potentially decreasing anabolism [11].Since dehydration is known to decrease central nervous system functions [20], performing a large volume of high intensity, high skill exercises such as those incorporated in CrossFit in a dehydrated state could significantly reduce performance or cause injury to athletes. According to Cronin et al. [5], during a regular CrossFit workout, sweat rates for men are 1.663 ± 0.478 L/h and for women 0.886 ± 0.274 L/h, which is less than 1% of total body weight for both male and female participants. While the amount of sweat lost in one workout does not reach the threshold of dehydration, athletes can perform up to three different workouts in one day for up to 4 days during a typical CrossFit competition, drastically increasing their chances of dehydration. Anecdotally, a CrossFit athlete in Brazil reportedly lost 6% of body weight after a 3-day competition, corroborating potential concerns about the health of these athletes during competition. A CrossFit competition will test all of the physiological systems that can be utilized during physical activity, such as cardiovascular and muscular endurance, muscular strength, and power output. Most of the physiological systems utilized during exercise are negatively affected by dehydration, jeopardizing an athlete’s performance. Dehydration during prolonged strenuous aerobic exercise, affects performance by increasing core temperature, reducing blood plasma volume leading to an increase in heart rate and a reduction in stroke volume. This changes in the systemic blood flow, reduce Oxygen delivery and consequently suppressing the aerobic metabolism [21]. Dehydration also affects the maximum oxygen consumption in the body (VO2 max), when compared to an euhydrated state, increasing the possibility of premature muscle fatigue and respiratory exhaustion [1]. The anaerobic system also appears to be affected by dehydration, but it is still unclear how the neuromuscular function and muscle contraction is impaired by dehydration. A recent study by Pallares et.al. [17], examined the effects that severe dehydration has on muscle contraction velocity, strength and power output. Researchers tested 163 competitive Olympic combat sport athletes and concluded that severe hypohydration (1081–1500 mOsm · kg H2O−1) in elite combat athletes, affected the neuromuscular bench press muscle contraction velocity by 7.3 ± 2.6% and jumping power by 2.8 ± 3.9%. Researchers also concluded that neuromuscular performance impairments can be reverse within a few hours after fluid replacement. A small reduction in muscle contraction and power output during a competition can be the difference between winning or losing, reinforcing the importance of water in the body. As such, there is a need to add to the body of knowledge on the hydration status of CrossFit athletes during competition, which to this point has not yet been studied.
2. Methods
2.1. Participants
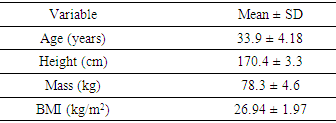
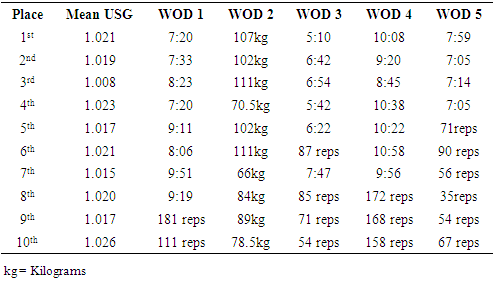
- For the present study 10 participants were recruited by the principal investigator using convenience sampling from a local CrossFit affiliate. All participants were registered for a local CrossFit competition prior to its cancellation due to COVID-19. Participants included eight male (34.5 ± 4.7 y; 81.5 ± 2.12 kg) and two female (31.5 ± 4.8 y; 65.45 ± 2.3 kg) CrossFit athletes that had all been training for more than one year. From those participants, seven athletes were in the Elite category and three athletes were in the Masters category (40-44 years of age). Descriptive characteristics are included in Table 1. This study did not jeopardize the performance of the athletes, as it was not an invasive study, and athletes were able to maintain their normal training/warm-up routines. California Baptist University’s Institutional Review Board approved all research procedures and local CrossFit affiliate owners granted permission and allowed a mock competition for data collection. A detailed description of the WODs are described in Table 2.
|
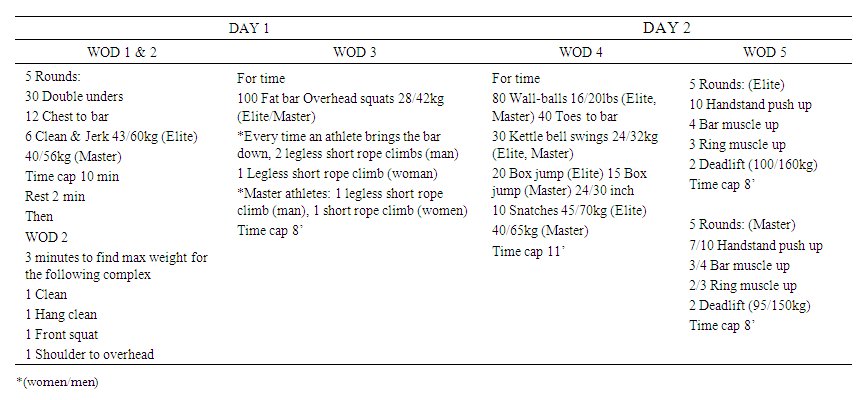 | Table 2. Detailed Description of the WODs Performed by the Athletes During the Mock Competition |
2.2. Protocol
- This study utilized a pre-experimental, one-group pretest-posttest design. This method allowed the researcher to understand any significant changes from the beginning to the end of the study, and to analyze if CrossFit athletes are properly replenishing fluid throughout the competition. The independent variable was participating in a two-day CrossFit mock competition, and the dependent variables were hydration status and sweat rate. The scheduled competition for data collection was a qualifier for Brazil’s largest CrossFit championship that features the best athletes in the country called Torneio CrossFit Brasil (TCB). During this qualifier participants from all over the country compete during a full weekend (Saturday and Sunday), to qualify for the largest CrossFit competition in Brazil (TCB). For this qualifier there were 5 total workouts, 3 performed in day 1, with WOD 1 & 2 being together and number 3 a few hours later, and workouts 4 and 5 on Sunday. The workouts are completed by heats and due to a large number of athletes, heats can be a few hours apart, allowing time for athletes to rest, eat, and rehydrate. In the mock competition for this research, athletes were given 2.5-hour break in between workouts, to mimic a real competition scenario. The WODs for each age group were designed by the organizers of the event.The data collection method for this research was performed as a field experiment. Urine samples and body weight measurements were collected to analyze hydration status and sweat rates. For this research, body weight changes were used to analyze fluid loss and consequently sweat rates throughout the competition. Assessment of USG indicated the hydration levels of each participant. Fluid intake during each workout was assessed for all participants using a digital kitchen scale (model Casita FS-400) by measuring the amount of water the athletes took into the workout and the difference after they finished the workout. Athletes were encouraged to avoid pouring water on their bodies as it would affect the water intake measurements. Food and fluid intake were not recorded in between workouts. Body weight in this research was obtained before and after each workout, and prior to ingestion of post-exercise food or drink. Male participants were weighed with compression shorts only and female participants were weighed with shorts and sports bra. For the body weight measurements after exercise, participants were asked to towel-dry prior to weigh-in. A digital weight scale (model newfeel 100; Decathlon) was placed near the workout floor to allow quick transitions between weighing-in- workout and vice-versa. The time each athlete took to complete the workout was also collected. Average temperature and humidity during the competition were also collected to provide information on the type of climate in which athletes were competing but were not used as variables. USG was assessed on both days of the competition prior to starting any physical activity and after the completion of the last workout using the RPT-20 ATC manual refractometer with graduated intervals of 0.010 units and a scale ranging from 1.000 to 1.050. Participants received an empty container with their name and ID number to collect urine and were accompanied by either the principal investigator or a female volunteer (CrossFit coach) to a private bathroom. Participants were discreetly observed voiding urine to ensure accuracy and avoid tampered samples. USG was analyzed by the principal investigator. The results were compared to the National Athletic Trainers Association’s indices of hydration status Table (3). Data was collected in a non-air-conditioned facility, with an average inside temperature of 22°C (71.6°F) and average humidity of 65%.
2.3. Statistical Analysis
- Differences in USG before and after competition for both days were compared using paired sample t-tests to determine any significant differences between pretest and posttest values with a confidence level of 95% [12]. Descriptive statistics were used to organize and interpret data using means, standard deviations and standard error of the means. The software that was used to analyze the data (weight, times, and USG) was Microsoft Excel, (Version 16.4). Also, the following formulas were used to calculate the net body fluid loss and sweat rates (L/h); Equation 1: WBSL (L) = [Body MassPRE-EX – (Body MassPOST-EX – Fluid IntakeEX + Urine OutputEX)]Equation 2: WBSR (L/h) = WBSL/ Exercise Duration Where EX is during exercise, PRE-EX is pre-exercise, POST-EX is post-exercise, WBSL is whole-body sweat loss, and WBSR is whole-body sweating rate (2).
3. Results
3.1. Sweat Rates
- Participants did not consume any fluids during the workouts, primarily due to the nature of the mock competition, which included high intensities and short duration workouts. None of the participants lost more than 1% of body weight during a single workout, or throughout the competition, with an absolute sweat loss of 0.247 ± 0.088 L. Mean sweat rate was 1.59 ± 0.34 L/h, averaging a body mass percentage loss of 2.025 ± 0.439% per hour of training.
3.2. Hydration Status and USG Indices
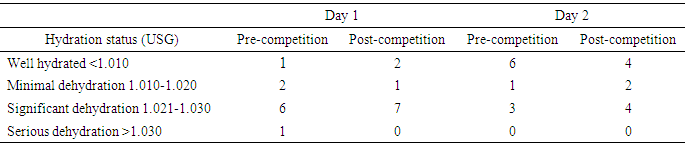
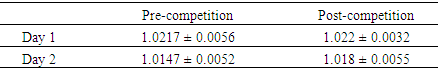
- On day one, the pre-competition hydration indices indicated that six athletes arrived at the competition with significant dehydration (USG 1.021-1.030) and one athlete with serious dehydration (USG >1.030). After the last workout, seven athletes finished the competition significantly dehydrated (USG 1.021-1.030). On day two, six athletes arrived at the competition well hydrated (USG <1.010) and only three athletes were significantly dehydrated (USG 1.021-1.030). Post-competition four athletes remained well-hydrated (USG <1.010) and four athletes were significantly dehydrated. Results are presented in Table 3, and changes in hydration indices are presented in Figure 1.
|
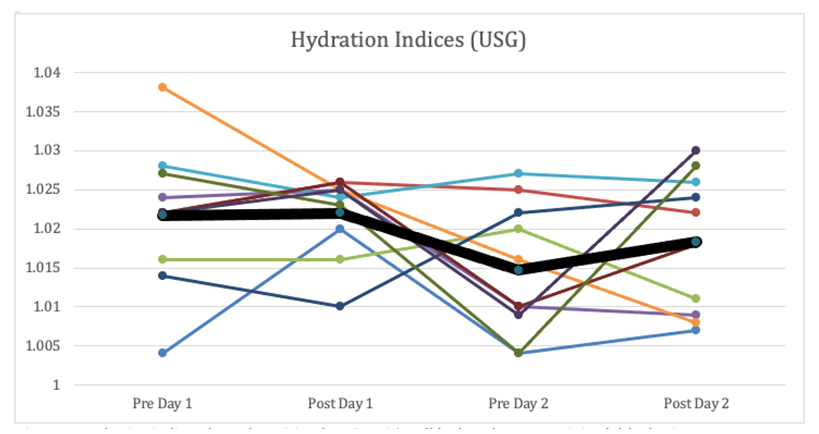 | Figure 1. Hydration indices shown by USG values (x-axis) well hydrated <1.010, minimal dehydration 1.010-1.020, significant dehydration 1.021-1.030, and serious dehydration >1.030. Black line indicates the mean USG of all participants (n=10) |
|
|
4. Conclusions
- The purpose of this study was to examine sweat rates and hydration status before and after competition. Previous research indicates that athletes neglect the amount of fluid needed to be properly hydrated and a high percentage of them arrive to sport events in some state of dehydration [16,7,22]. With this in mind, the authors hypothesized that CrossFit athletes would arrive on both days to the competition in a state of dehydration and would not replenish enough fluid in between competition days. In accordance with the primary research hypothesis, the majority of participants (n = 6) arrived on day one with significant dehydration, mean USG (1.0217 ± 0.0056). According to NATA, a significant dehydration denotes a body weight change of -3 to -5%, which has been shown to increase rate of perceived exertion and decrease time to exhaustion (3), two variables that can have a significant impact on performance when working at high intensities. However, contrary to what was expected, day two (pre-competition) only three participants arrived with a significant dehydration and USG indices improved from 1.0217 ± 0.0056 on day 1 to 1.0147 ± 0,0052 on day 2, a significant change (p=0.039). These results indicate that CrossFit athletes may have better hydration behaviors to replenish fluids in multiple day events. Interestingly, 20% of participants increased hydration levels between workouts on the first day. While food and fluid intake were not tracked between workouts, the authors believe that such findings are likely explained by non-regulatory fluid ingestion. This type of fluid ingestion is not meant to quench thirst but as components of everyday living. Foods and beverages like pre-workout and post-workout recovery drinks consumed during the rest period between competition heats contribute to the higher fluid intake [18]. There is evidence that athletes who participate in a series of events over multiple days do not replenish the fluid lost during previous days [4,7]. For this reason, authors expected participants to arrive on day two with equal or worse hydration indices. Unanticipated, the hydration indices improved significantly (p = 0.039), with 60% of participants arriving well hydrated (USG <1.010) and only 30% with significant dehydration (USG 1.021-1.030). There is no clear explanation as to why these subjects became more hydrated on day two, aside from non-regulatory fluid ingestion. The researchers believe that the mock competition may have also influenced participants to consciously or subconsciously ingest more fluid in between days. Throughout day two, however, athletes did become more dehydrated, with 40% finishing day two with a significant dehydration compared to 70% on day one. A study from Chapelle et al. [4] hypothesized that athletes do not comprehend the purpose of the rest period and underestimate the importance of hydration in between event days to maximize performance and prepare for future efforts. Athletes who begin an event significantly dehydrated can expect higher core temperatures and reduced plasma volume, leading to an increase in heart rate and reduction in stroke volume. Such effects reduce aerobic performance and aerobic work capacity by reducing the oxygen delivery to the working muscles [22] and significantly affect performance of multi-repetition, multi-set exercises [10] typically found in CrossFit workouts. In the current study the sweat rates during competition were 1.59 ± 0.35 L/h, which is slightly higher than the 1.316 ± 0.539 L/h rate seen in CrossFit classes [5]. However, the difference in sweat rates can likely be attributed to a large percentage (60%) of participants in the Cronin et al. [5] study training in an air-conditioned facility, and the differences in workout intensities. There is evidence that sweat rates are greater in games/competitions than during practice/training [15], which is likely explained by the correlation between sweat rates and exercise intensity. Maximal exercise intensity seen in competition leads to greater sweat rates compared to moderate or low intensity exercise [9]. Sweat rates from the present study are similar to what have been demonstrated in other high-intensity sports. Cross Country runners have exhibited a daily mean sweat rate of 1.77 ± 0.4 L/h, soccer players’ sweat rates during games have been shown to range from 1.2 L/h to 1.67L/h, and basketball players competing indoors have exhibited 1.6 L/h fluid loss [8]. Given that sweat rates during competition can reach 2% body weight loss per hour, which negatively impacts performance [3], some hydration strategies are recommended to prepare for lengthier WODs. Given the findings of this study, the primary focus would be on pre-competition hydration, athletes should drink 5-7mL/kg per body weight at least 4 h before exercise [20]. During lengthier WODs is recommended that athletes match the fluid intake with fluid loss [3], thus, a fluid intake of 300ml for every 15 min may be ideal given the sweat rates. The primary limitation to this study came in the form of a global pandemic, which was obviously unexpected and limited the ability to recruit the necessary participants to power such a study and generalize findings to a broader population. However, some of the results from the data collected in the mock competition provide a glance at hydration status of CrossFit athletes and can be built upon with future research. Specifically, more research is needed in a true competition scenario to determine how such pressures influence hydration status and performance. Also, further research should look to collect sweat loss data from the warm-up period, together with observation and collection of food and fluid intake in between workouts. Future research should also examine hydration relative to gender differences, as the current study could not find any notable statistical differences from the data due to the low number of participants. The results from this study reiterate that CrossFit athletes do not drink enough water and therefore arrive to mock competitive events in a state of dehydration, which is likely to impair performance. However, one of the most interesting findings of the study was the improvement in pre-competition hydration markers from day one to day two. The sweat rates from the current research are higher, but not significantly different from previous research about this population. It is the hope of the authors that such results will inform the practice of coaches and athletes alike to create hydration strategies that could improve CrossFit performance and athlete health.