-
Paper Information
- Paper Submission
-
Journal Information
- About This Journal
- Editorial Board
- Current Issue
- Archive
- Author Guidelines
- Contact Us
International Journal of Sports Science
p-ISSN: 2169-8759 e-ISSN: 2169-8791
2021; 11(1): 6-17
doi:10.5923/j.sports.20211101.02
Received: Mar. 18, 2021; Accepted: Mar. 31, 2021; Published: Apr. 25, 2021

Protein Amount, Quality and Distribution in Active Older Adults and Its Effects on Outcomes of Fat Free Mass, Skeletal Muscle Strength and Power
 Abstract
 Reference
 Full-Text PDF
 Full-text HTML
Zoya Huschtscha1, Judi Porter1, 2, Alexandra Parr1, Ricardo J. S. Costa1
1Monash University, Department of Nutrition Dietetics & Food, Level 1, 264 Ferntree Gully Road, Notting Hill, Victoria, Australia
2Deakin University, Institute for Physical Activity and Nutrition (IPAN), School of Exercise and Nutrition Sciences, Geelong, Australia
Correspondence to: Ricardo J. S. Costa, Monash University, Department of Nutrition Dietetics & Food, Level 1, 264 Ferntree Gully Road, Notting Hill, Victoria, Australia.
| Email: |  |
Copyright © 2021 The Author(s). Published by Scientific & Academic Publishing.
This work is licensed under the Creative Commons Attribution International License (CC BY).
http://creativecommons.org/licenses/by/4.0/

This study aimed to investigate the associations of habitual protein intake in a cohort of active older adults including: daily relative protein intake, distribution of protein intake across main meals, and number of meals providing ≥0.4 g/kg body mass (BM) on outcomes of fat free mass (FFM), leg power, leg strength, and handgrip strength (HGS). This was a cross-sectional study (2018-2020) where data were obtained and analysed from n= 53 active older adults (≥50 yrs; ≥90 min/week of self-reported physical activity). Daily absolute (g) and relative protein (g/kgBM/day) intake, absolute and relative protein intake per meal, the number of meals that provided 0.4 g/kgBM, and the protein intake distribution were calculated for each participant through a 3-day food diary assessment and analysis. Appendicular muscle mass index (ALM/ht2; dual x-ray absorptiometry), leg strength (1-repetition maximum using leg press), leg power (force plate countermovement jump) and HGS (dynamometer) were assessed. An independent t-test was used to test statistical significance between groups based on protein intake. Pearson’s correlation determined differences between protein intakes with lean muscle mass and strength outcomes. Results:Daily protein intake was (mean ± SD) 1.4 ± 0.4 g/kg BM/day, with the coefficient of variation of main meals calculated at 0.46 (0.41-0.51), and the average number of meals that provided ≥0.4g/kgBM was 1.1 ± 0.8 meals. There was a moderate but significant positive correlation between number of meals per day providing ≥0.4g/kgBM, and number and leg press (r= .301,p< .05), significant for males (r= .591, p= .029), but not females (r=.262, p= .196). There was also a small significant association between the number of total protein and dairy serves per day and leg strength ((r= .290, p= .035; r= .372, p= .006, respectively). No significant correlations were observed for outcomes of HGS or FFM and any of the dietary protein measures. Conclusion: In a cohort of active older adults who achieve greater protein intakes than the current recommendations, a minimum of 1 meal containing ≥0.4 g/kg BM of protein and higher intakes of dairy based foods may be required to achieve favourable outcomes in leg strength.
Keywords: Sarcopenia, Protein intake, Muscle strength, Muscle power
Cite this paper: Zoya Huschtscha, Judi Porter, Alexandra Parr, Ricardo J. S. Costa, Protein Amount, Quality and Distribution in Active Older Adults and Its Effects on Outcomes of Fat Free Mass, Skeletal Muscle Strength and Power, International Journal of Sports Science, Vol. 11 No. 1, 2021, pp. 6-17. doi: 10.5923/j.sports.20211101.02.
Article Outline
1. Introduction
- Sarcopenia is categorised as a age-related progressive decline in skeletal muscle mass (SMM), strength, and function [1]. SMM is directly influenced by the balance between the rates of muscle protein synthesis (MPS) and muscle protein breakdown (MPB), collectively known as muscle protein turnover [2]. Achieving a positive protein balance, where MPS exceeds MPB, is a crucial component of skeletal muscle repair and remodeling in response to anabolic stimuli, as well as in accruing SMM to maintain strength and physical function [3]. Older adults (≥65 yrs) have been observed to have a blunted capacity to respond to anabolic stimuli compared to younger individuals, known as ‘anabolic resistance’ [4]. Declines in skeletal muscle mass, and strength have been observed to commence as early as the 5th decade of life at which early signs of sarcopenia can begin to be noticeable [5]. Anabolic resistance in the ageing population can be overcome by lifestyle factors such as physical activity and increasing dietary protein. These two factors have been the focus of numerous intervention studies in intervention and management of age related sarcopenia [6,7]. However, the majority of the recent research that has been conducted on frail and institutionalised older adults, and it is uncertain whether these changes commonly associated with ageing reflect the true physiology of ageing muscle or are more a picture of disuse atrophy or inadequate protein intake and other medical considerations (i.e., disease associated) [8]. Interestingly, active older adults that exercise either competitively or recreationally, still show signs of a progressive loss of SMM, skeletal muscle strength and physical performances in speed and power events [9]. Multiple aspects of protein intake have been shown to have promising relevance in the ageing population. These include, total daily protein amount, intake of protein per meal, distribution of protein along the day and protein quality [4,6]. The majority of research has been conducted in acute laboratory settings and to date there is a lack of evidence in clinical studies to support this contention. Therefore, active older adults who do not have the confounding variable of sedentary behaviour typically seen in sarcopenia research may provide an indication of the importance of these aspects of protein intake and their association with outcomes of SMM and function. Numerous longitudinal and cross-sectional studies in older adults have shown that protein intakes (1.0-1.2 g/kg body mass (BM)/day) higher than the current guidelines (0.8 g/kg BM/day) have positive associations with SMM, physical function and skeletal muscle strength [10]. However, there have also been conflicting results with other studies that have found no association with higher protein intakes and these outcomes [11, 12]. The PROT-AGE study group have suggested that higher amounts of daily protein intakes (e.,g ≥1.2 g/kg BM/day) would be required for older adults that are considered physically active in order to maintain a positive protein balance [13]. Whereas, a cross-sectional study by ten Haaf et al. [14] found in a cohort of physically active (mean ± SD: 85 ± 53 metabolic equivalents (MET)/week) older (70 ± 4 yrs)) adults that over 50% of participants did not meet the protein requirements of 1.2 g/kg BM/day. This may indicate that active older adults may be at an increased risk of muscle decline and skeletal muscle strength due to the increased requirements for amino acid (AA) utilisation coupled with the progressive degeneration of SMM associated with ageing [4,15]. In a meta-analysis by Morton et al. [16], minimal effects of protein intakes up to 1.6 g/kg BM/day on outcomes of fat free mass (FFM) in healthy community dwelling older adults were reported. However, there has yet to be any studies that compared the habitual total protein intake amount on outcomes of SMM, skeletal muscle strength, and physical performance in a cohort of active older adults. In recent studies, there has been a move towards protein intake per meal, as there is a clear saturable dose-dependent response of AA availability and MPS, which indicate that once MPS has been maximally stimulated there is no further augmentation with higher amounts of protein [17]. This limit has been observed to be 0.4 g/kg BM/meal [17] or 25-35 g (~10 g essential AA) of protein for older adults [18-20]. This recommendation poses problems for many older adults whose dietary protein is distributed inequitably across meals, with the majority of protein intake at the evening meal [20]. Furthermore, typical Western [12] diets in older adults have insufficient protein at breakfast and lunch to elicit a significant MPS response during this time period [21]. To express the evenness of protein distribution throughout the day, many studies have used a coefficient of variation (CV), where a lower value indicates a more consistent protein distribution [22]. For example, a study by ten Haaf et al. [14] categorised participants according to protein distribution; Even (CV < 0.43); intermediate (CV = 0.43-0.62), and uneven (CV > 0.62). The main findings of this study found that an even spread of protein throughout the day (CV < 0.43) was associated with higher gait speed, compared to the intermediate group only, but there were no associations between other performance markers (i.e., chair stand and HGS). Regular intake of protein throughout the day increases the opportunities to maximally stimulate MPS [22,23]. This accumulation of MPS stimulation throughout the day is likely to lead to long term positive protein balance and subsequently leading to a net positive protein balance which may facilitate adaptations in SMM, skeletal muscle strength, and performance outcomes in active older adults [22,23]. Therefore, the literature suggests that not only total protein amount, but ‘per meal’ amount and frequency of protein intake, may be associated with skeletal muscle mass and strength in ageing adults. Studies conflict in regards to the degree of influence from protein distribution and the number of meals providing adequate protein, especially when this is due to the infrequent use of relative protein intake and absolute protein intake, which cause a major hindrance to comparison [15,18,22]. This one-size-fits-all approach for absolute protein intake does not account for differences in body size, and particularly the differences often observed in lean muscle mass and size between biological sexes in active older adults [24]. Therefore, assessing the relative protein intakes across meals is proposed to be more feasible to assess the differences in habitual protein intake comparing biological sex due to the differences in body mass. Lastly, the quality of the protein sources that active older adults habitually consume should be taken into consideration. Protein quality is determined by the essential AA profile, digestibility, and AA bioavailability, which dictate the anabolic potential of the dietary protein source [25,26]. Animal based protein (e.g., dairy, lean meats) are considered better quality proteins due to their higher bioavailability and increased ability to increase MPS compared to plant based proteins [27]. For example, Lord et al. [28] observed in healthy older women (55-75 yrs) that protein intake from animal sources was on the only independent predictor of SMM, explaining 19% of its variance. Similarly, a higher dairy consumption (≥2.2 servings per day) was associated with a significantly greater lean muscle mass, HGS strength and physical performance in a cross-sectional study of healthy older women (70- 85 yrs) [29]. Furthermore, a 3-year longitudinal study in healthy community dwellers found that there was a significant association between total protein and animal protein and changes in lean muscle (mean (SE): 8.76 (3.00) and 8.82 (3.01)) and appendicular lean muscle (ALM (5.31 (1.64) and 5.26 (1.65), respectively)) ( p < .01) [11]. However, there are limited studies in active older adults and determining if their dietary protein quality may be associated with any outcomes related to sarcopenia. With the previous discussion point in mind, the purpose of the present study was to explore protein intake patterns including: daily protein intake, evenness of protein intake across the three main meals, number of protein meals containing ≥0.4 g/kg BM/meal, and protein quality and assess associations with outcomes of fat-free mass (FFM), skeletal muscle strength and power in a cohort of active older adults. We hypothesised that these aspects of protein intake would be positively associated with greater FFM, skeletal muscle strength, and skeletal muscle power.
2. Methods
2.1. Study Population
- Active middle-aged and older males (n= 36; mean ± SD: age 59.1 ± 6.7 yrs, BM 80.2 ± 13.8 kg, height 1.77 ± 0.07 m), and females (n= 18; mean ± SD: age 58.3 ± 7.1 yrs, BM 64.0 ± 11.2 kg, height 1.61 ± 0.06 m) volunteered to participate in the study. Participants were eligible if they were ≥50 yrs, trained for recreational fitness and/or sports competitions at least ≥3 occasions/week, for more than 90 min/week, had no functional limitations, were free from chronic disease, were not taking medications that could interfere with SMM (e.g., corticosteroids, testosterone replacement, or anabolic drugs), were not currently undergoing immunosuppressive therapy or hormone replacement therapy, and did not currently undergo any structured weight training program. All participants were initially screened for eligibility based on the study criteria (Figure 1). After participants were deemed eligible all participants gave written informed consent. The study protocol obtained approval from the local ethics committee (Project number 12812). Data were collected during the period of September 2018 to January 2020. See Figure 1 for participant flow.
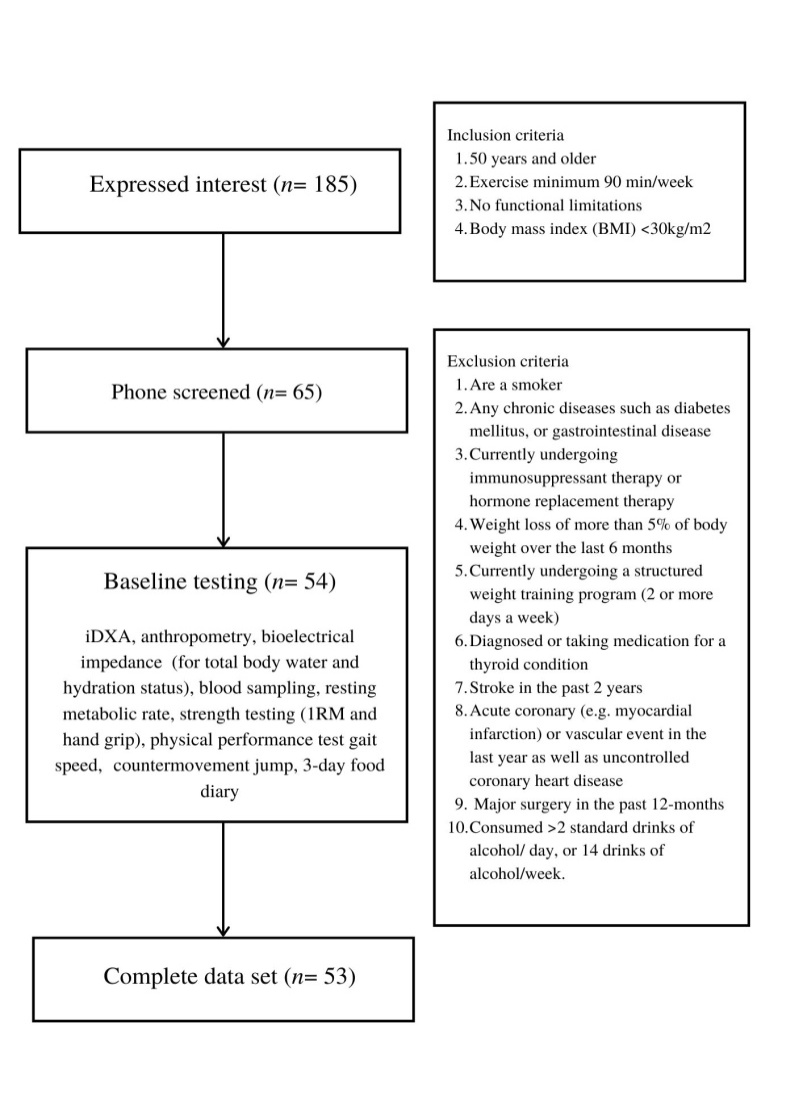 | Figure 1. Flow diagram for the identifications, screening, eligibility and participant completion |
2.2. Physical Activity
- Participants filled out a physical activity readiness questionnaire (PAR-Q), which they self-reported their level of activity including exercise volume (e.g.,
2.3. Dietary Assessment
- Participants were instructed to complete a 3-day food diary prior to their initial visit. They were required to record all the foods and fluids on each main meal (breakfast, lunch and dinner) and any additional snacks (e.g., morning tea, afternoon tea, supper) ingested on 2 weekdays (Monday- Friday) and one day on the weekend (Saturday/Sunday) that most reflected their usual intake. Participants were required to specify the food and beverage quantities (e.g., g, ml, litres, portions) and qualities (e.g., cooking method, brands of foods-beverages, types of foods-beverages). These diaries were analysed by an Accredited Practising Dietitian using FoodWorks v10.0 nutritional analysis software (Xyris Software, Brisbane, Australia, 2019) based on Australian food composition tables from Australian Food Composition Database (AFCD) 2019. The average values for the 3 days for total energy, macronutrients and calcium intake were obtained and then dietary protein intake distributed across breakfast, lunch, dinner, and snacks was determined. Data were analysed for outliers using boxplot (SPSS statistics software, Version 25.0, IBM Corp, Armonk, NY). Identified outliers were removed prior to comparative data analysis procedures. Protein intake per meal and per day was expressed as absolute (g/day, g/meal) and relative to body mass (g/kg BM/day and g/kg BM/meal). Daily protein intake was compared to 0.8 g/kg BM/day and 1.2 g/kg BM/day. The protein sources that contributed to the participants’ intake were also quantified based on the Australian Guide to Healthy Eating [30]. Protein intake was separated by animal based and plant based sources. Animal based proteins included 65 g beef, 80 g chicken, 100 g (edible portion) of eggs, 65 g processed meats (e.g., salami, ham), 100 g seafood. Plant based protein sources included; 30 g nuts and/or seeds, 170 g tofu, beans or legumes [30,31]. Dairy foods included 250ml cow’s milk, 40g hard yellow cheese, 120g soft white cheeses (e.g., ricotta) and 200g yoghurt. Dairy alternatives included beverages that included the equivalent calcium content to 250ml of bovine dairy milk (300mg calcium) [30,31].
2.4. Anthropometry and Body Composition
- For measurements of outcome variables, participants were required to attend the laboratory for the period between 7.00am to 9.00am in a fasted and euhydrated state (plasma osmolality: 296 ± 5.6 mOsmol/kg; 53.3 ± 6.4% TBW; Seca 515 MBCA, Seca Group, Hamburg, Germany), and after avoiding strenuous exercise for a 24 h period. Height was assessed using a fixed stadiometer (stadiometer; Holtain, Crosswell, Crymych, UK) and BM was measured (Seca 515 MBCA, Seca Group, Hamburg, Germany) to the nearest 0.1 kg. FFM was obtained by a trained radiographer using a dual-energy X-ray absorptiometry (iDXA, Prodigy, GE Lunar, Madison, WI; with analysis software 14.10). Appendicular lean mass (ALM) was determined by adding the total arm and trunk lean mass and then it was adjusted for height (ALM/height2). Relative fat mass (%), and absolute fat-free mass (kg) were also obtained from the iDXA. To comply with ethical procedures, prior to commencing the strength, power, and performance measures, participants were provided with a standardised breakfast (1.4 MJ, 15.3 g protein, 51.7 g carbohydrates, 6.8 g fat). Physical assessment measures commenced approximately 30 min thereafter.
2.5. Leg Strength, Skeletal Muscle Power and Handgrip Strength
- Leg strength was measured assessed by performing a 1 repetition maximal strength (1-RM) using a 90° Leg press machine (Hammer strength; LifeFitness, Sydney, Australia) using previously described procedures [34]. Testing began after a familiarisation trial, proper lifting technique was demonstrated, then participants were familiarised with each resistance machine by performing 8-10 repetitions of a light load (~50% of predicted 1-RM). After successful completion of a further five to six repetitions at a heavier weight selected by the instructor, the workload was increased incrementally until only one repetition with correct technique could be completed. Participants were given 3-5 min rest in-between attempts [33]. The value indicative of 1-RM was the highest load that could be raised in one single repetitions using correct technique for leg press. A Force plate (400s+ Performance Force plate; Fitness Technology, Adelaide, Australia) was used to measure relative muscle power (W/kg) during a countermovement jump test (CMJ). Participants were asked to start in a fully erect standing position in the middle of the force plate, then instructed to dip to a self-selected depth and “jump for maximal height”. Hands were kept on the hips to minimize any influence of arm swing [34]. Participants were asked to perform three attempts of a CMJ with 1 min rest between jumps. The Force plate was interfaced with computer software (Ballistic Measurement System; Fitness Technology, Adelaide, Australia), where the mean of three jumps were further analysed. HGS was measured using a digital hand dynamometer (Jamar® Plus+ Digital hand dynamometer; Sammons Preston, Bolingbrook, IL, USA). HGS was measured in a standing position with the participants elbow by their side and flexed to a 90° angle and a neutral wrist position. Participants were asked to apply the maximum grip strength three times with both left and right hands, HGS was defined as the highest value for their dominant hand [35]. Based on the European Working Group of sarcopenia 2 (EWGOS2) clinical diagnosis 6% (n= 3) had low HGS and were considered to have probable sarcopenia [1].
2.6. Statistical Analysis
- Data in text and tables are presented as either mean ± SD (descriptive experimental data) or mean and 95% confidence interval (CI) (primary and secondary variables), where indicated. All statistical analyses were performed using IBM SPSS statistics software (Version 25.0, IBM Corp, Armonk, NY). Prior to analysis, assumptions of normality in the data were made using Shapiro-Wilk test and visualisations of normality plots. Variables with singular points were examined using an independent t-tests, or non-parametric Mann-Whitney U test. Significance was accepted at p≤ .05. To test associations between protein intake and CV of protein, and number of meals containing ≥0.4 g/kgBM with outcomes of strength, muscle and power a Pearson’s correlation was used. Significance was accepted at p≤ .05. Additionally, Cohen’s d was applied to determine the magnitude of effect size for significance differences, with d ≥ .20 for small, d≥ .50 for medium, and d≥ .80 for large effect size.
3. Results
3.1. Participant Characteristics
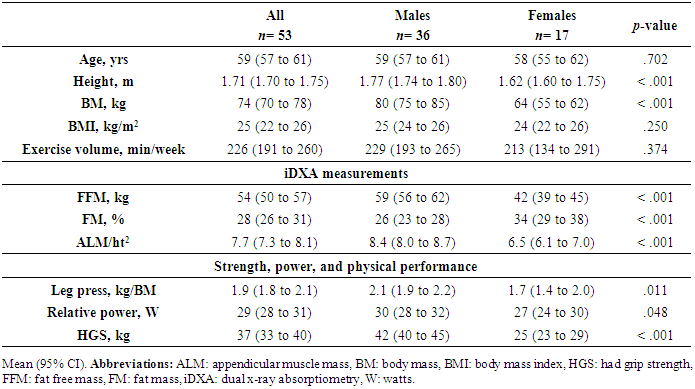
- Table 1 presents the participant characteristics. Of the 54 participants included in the data collection, 53 were included in the analysis, due to an incomplete food diary (Figure 1). Participants were 86% Caucasian, 10% Asian, and 4% south-east Asian. Participants were from a variety of sporting backgrounds including endurance runners and race walkers (61%), cyclists (9%), aerobic gym goers (16%), or a combination of multiple activities (14%).
|
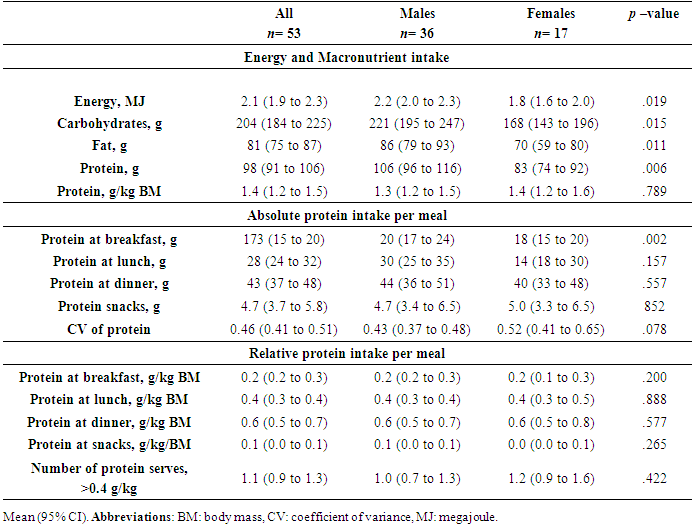
3.2. Macronutrients and Total Protein Intake
- Average daily energy and macronutrients are presented in Table 2. All participants reported 3 main meals, 2 participants (1 male and 1 female) did not consume snacks. Total energy, carbohydrates, fat and relative protein intake (g/kg BM) in males were significantly higher than in females (Table 2). Over the 3-day measurement period 81% of males and 100% of females, had ≥0.8 g/kg BM/day of protein intakes (Figure 2). Relative protein intake was on average 1.3 (1.2 to 1.5) g/kg BM/day for males and 1.4 ± 0.1 g/kg BM/day for females. However, only 60% of females and 72% of males met the threshold for protein based on 1.2 g/kg BM/day (Figure 2).
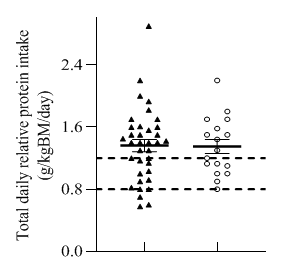 | Figure 2. Total daily relative protein intake for ▲ males O females. Scatter plots display individual means. Dashed lines indicates recommended daily allowances for dietary protein allowance of 0.8 g/kg BM/day and 1.2 g/kg BM/day |
3.3. Protein Distribution
- Based on absolute protein intake per meal, males had significantly higher intakes of protein at breakfast, but not at any other meal (p= .002, d= .950) (Table 2). There were no significant differences between groups based on relative protein intake. The mean number of daily meals providing at least 0.4 g/kg BM ranged from 0 to 2.8, while 4.1% of men and no women consumed two or more meals per day providing at least 0.4 g/kg BM of protein on each of the seven days. Meal-specific relative protein intakes are presented in Figure 2. The CV for the whole cohort was 0.46 (0.41 to 0.51). The CV was higher in the females compared to the males, although not statistically significant (p= .422). Protein intake at breakfast, lunch, dinner, and snacks contributed 0.26, 0.38, 0.56 and 0.058 g/kg BM/meal for males and 0.19, 0.57, 0.86, 0.073 g/kg BM/meal for females (Table 2). On a meal-basis the proposed threshold for maximal MPS (0.40 g/kg BM) was met for the majority males (85%), and females (89%) at dinner only (Table 2, Figure 2). Figure 3 indicates within group differences of protein at different meals and snacks. There was a significant differences in protein intake for both groups with lunch ≥ breakfast, and dinner ≥ lunch and breakfast. Snacks were not consumed as a single meal; therefore is it not possible to determine whether dietary protein MPS thresholds were met for individual snacks.
|
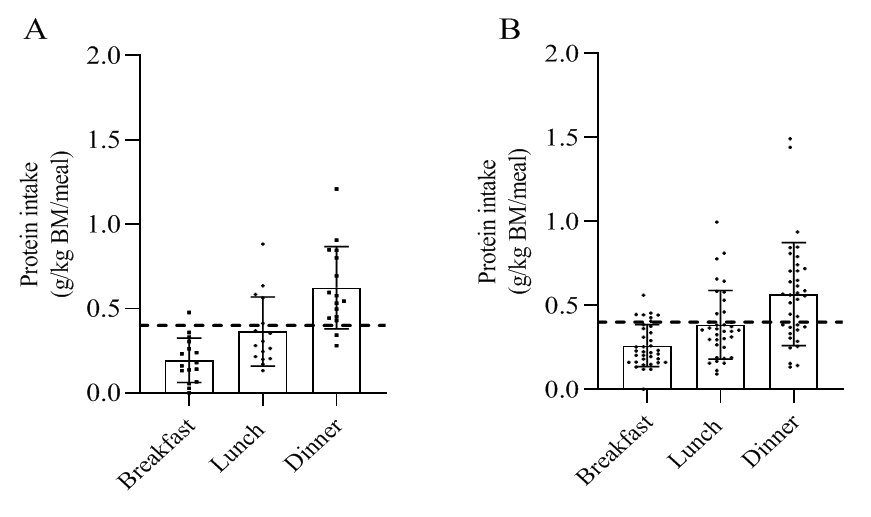 | Figure 3. Meal protein distribution intakes in females (A) and males (B). Dashed line represents threshold protein intake of 0.4 g/kg BM/ meal, suggested for maximal stimulation of MPS in older adults |
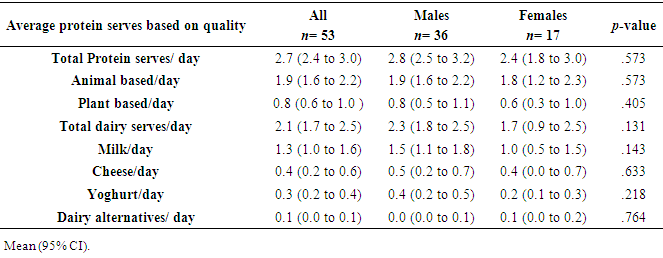
3.4. Protein Quality
- The types of protein foods that were consumed based on a 3-day food diaries are presented on Table 3. There were no differences between groups in relation to protein serves or the source of protein. Both groups received the majority of their protein serves from animal based sources (1.9 vs. 1.8 serves) for males and females, respectively. Both groups had similar dairy serves intakes with the majority of their dairy source deriving from milk (60-65%).
3.5. Associations between Aspects of Protein Intake and Skeletal Muscle Mass and Strength
- The association between aspects of protein intake and the correlations between outcomes of ALM/ht2, leg strength, muscle power and HGS are presented in Table 4. The number of daily meals providing ≥0.4 g/kg BM of protein had a small inverse association with ALM/ht2 (r=-.383, p= .005) across the whole cohort, and in males (r= -.385, p= .020). There was a significant positive association between number of meals providing >0.4 g/kg BM/day) and 1-RM leg strength was reduced when the cohort was pooled with females (r= .301, p= .029) strength in males (p< .001). There were no significant correlations for women in any of the outcomes. However, when the data were pooled there was a small negative correlation between HGS and number of meals with >0.4 g/kg of protein per meal (r= -.322, p= .019). No other significant correlations were found.
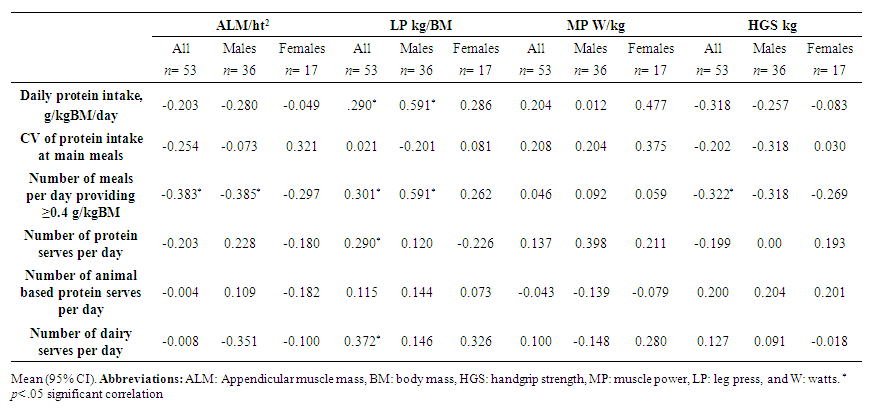 | Table 4. Correlations between mean daily intake of protein, mean coefficient of variants of protein across main meals, mean number of meals providing at least 0.4 g/kg BM protein, protein quality and skeletal muscle mass, leg strength, relative leg power, and hand grip strength in active older adults and subgroups of males and females |
4. Discussion
- This cross-sectional study aimed to explore protein intake patterns including: daily protein amount, distribution of protein intake across main meals, number of meals containing ≥0.4 g/kg BM/meal of protein, protein quality, and associations with outcomes of FFM, skeletal muscle strength and power in a cohort of active older adults and explored the sources of dietary proteins. In support of the hypothesis, the results of this study observed a positive association between number of meals/day providing ≥0.4 g/kg BM and 1-RM leg press. When stratified based by biological sex this positive association was only significant for males and not females. Furthermore, there was a significant positive association with total protein serves and dairy milk protein serves and 1-RM leg strength. Contrary to the initial hypothesis, the remaining outcomes showed an inverse association between dietary protein patterns and outcomes of ALM/ht2 and HGS, but no significant association with skeletal muscle power. Overall, these findings suggest that the number of high protein meals and the quality of the protein may further improve outcomes of skeletal muscle leg strength in active older adults that already consume high amounts of protein (≥1.4 g/kg BM/day).The current study observed no significant positive association between relative total daily protein intake with outcomes of ALM/ht2, leg strength, leg power, or HGS. Similarly, Gingrich et al. [12] observed in a cohort of healthy community dwellers (75-85 yrs) no associations between total daily protein intake (mean ± SD: 0.97 ± 0.28 g/kg BM/day) and outcomes of skeletal muscle index, leg power, leg muscle strength, or HGS. Another study of older (81 ± 6 yrs) community dwellers found no association between higher total daily protein intakes (≥1.0 g/kg BM/day) and outcomes of HGS, physical function (Short Physical Performance Battery (SPPB)), and quality of life [36]. Moreover, Houston et al. [11] found no cross-sectional association in ALM in older community dwellers (70-79 yrs) consuming 0.8 or 1.2 g/kg BM/day of protein. In contrast, the Women’s Health Initiative (WHI) [10] compared the total daily protein intake of menopausal women (50-79 yrs) with outcomes of strength (i.e., HGS). The findings of the WHI study observed that women with higher total daily protein intakes (1.19 g/kg BM/day) had a small, but significantly higher HGS (24.7 kg vs 21.1 kg, p< .036) compared to those that reported lower intakes of protein (<0.9 g/kg BM/day) [10]. Additionally, a systematic review and meta-analysis found that very high (1.5 g/kg BM/day) and high (1.3 g/kg BM/day) protein intakes were associated with a small but significant effect (95%CI: 0.67, 0.56 to 0.82) on outcomes of knee extensor strength, walking speed and SPPB, when compared to low protein intakes (<0.8 g/kg BM/day) [37]. The absence within the current study of a positive effect of a higher total daily protein intake on these parameters might be explained by the fact that average relative protein (1.4 ± 0.43 g/kg BM/day) intake was higher than the proposed alternative protein intake for active older adults (1.2 g/kg BM/day), and was met by the majority of females and males in the current cohort (60% and 72%, respectively); this is much higher than previous reports of protein intakes in active older adults [14]. Additionally, our sample population was healthy and active, and a low portion of the sample size (6%) had low HGS [1]. Comparing these findings to the systematic review that reported lower HGS (24.3 kg), and older population (~74 yrs). These findings may suggest that associating protein intakes with outcomes of SMM, strength, and performance may only be relevant for older (> 70 yrs) populations with lower functional parameters. There was an uneven distribution of protein observed in this study with smaller amounts of protein reported at breakfast (17.7 ± 9.3 g) compared to lunch (28.1 ± 19.8 g) and dinner (42.7 ± 19.8 g). These observations are consistent with previously reported studies in protein intake in older adults (72-88 yrs) which have observed a skewed intake with the majority of daily protein consumed towards the evening mealtime [38,39]. The degree of protein distribution based on the coefficient of variation (CV) for protein intake among the main meals, from this study showed that males had a slightly more balanced distribution (0.43 ± 0.16) compared to females (0.52 ± 0.23), however there was no significant differences between groups (p= .078). Additionally, there was no significant correlation between the balance of protein at main meals and any of the outcomes of muscle mass or function. Similarly, Gingrich et al. [12] did not observe any statistical significant association between protein CV and outcomes of muscle mass, strength and power. The Gingrich et al. [12] study had a similar cohort to the present study (i.e., more homogenous and ‘healthier’ study group) and reported a CV that was similar for males (0.51 ± 0.19) and females (0.55 ± 0.17). In contrast, Bollwein et al. [21] categorised participants into non-frail, pre-frail and frail and aimed to determine whether protein distribution was associated with frailty. Their main findings were based on protein skewness, showing that the participants categorised as ‘frail’ had a significantly higher CV (0.76 (0.18-1.33)) compared to the pre-frail (0.76 (0.07-1.29)) and non-frail (0.68 (0.15-1.24)) indicating a more skewed protein intake in the frail group. This was despite no significant difference comparing total daily protein intake across groups (~1.1 g/kg BM/day). The rationale for the per-meal recommendations are largely based on acute studies that investigate the maximal saturation of AA per meal on outcomes of MPS [15,17]. These studies have indicated that the MPS response is dose-dependent and protein intakes above this saturation point are irrelevant as MPS does not increase with larger protein doses (e.g. >45 g/meal) [17]. Therefore, the provision of a protein dose that will elicit MPS to the maximum degree over the day may directly impact skeletal muscle mass and function. However, the results from this study do not support this notion and it may be only relevant for adults that are considered frail and as observed in the study by Bollwein et al [21]. Considering the participants in this study and Gringrich et al [12]. were considered healthy and active, the physical activity alone may be sufficient to elicit a MPS and mitigate the age-related anabolic resistance. Therefore, active older adults that are consuming adequate amounts of total daily protein may offset the negative consequences of skewed protein distribution, as seen in the current literature. The number of daily meals providing ≥0.4 g/kg BM of protein had a small inverse association with ALM/ht2 in males and across the whole cohort for HGS. Indicating the more meals providing ≥0.4 g/kg the lower the HGS and ALM/ht2. Considering that this cohort were considered healthy and free from functional decline, with a low proportion (6%) to have low HGS [39] it is likely that these measurements (HGS and ALM/ht2) may not represent true physiological change in an active older population. Therefore, HGS and ALM/ht2 may not be sensitive enough to detect any clinical relevance in relation to skeletal muscle strength and FFM in an active ageing cohort, therefore it is likely that the inverse relationship within this cohort does not hold any practical significance in this cohort. Whereas, direct measures of leg strength may be more practically significant. In this study there was a small positive association with number of meals providing the proposed amount to maximally stimulate MPS and 1-RM leg press for the whole cohort and when stratified based on biological sex, only men had a significant association. The average number of meals providing the amount of protein (e.g., 0.4g/kg BM) to maximally stimulate MPS was 1.1 (95% CI:0.86 to 1.3) with the evening meal reaching this threshold for the majority of participants (69%), whereas lunch was met by 28% and breakfast by 13%. There have been observational studies that have reported a positive association of protein intake per meal and greater outcomes of leg muscle mass [15] and physical function [41]. Of these, an observational study [15] found that in a cohort of older adults (50-85 yrs) consuming 1 or 2 meals with ≥30 g (~0.38 g/kg BM) of protein was associated with higher peak knee strength (383 and 434 Newtons (N)) and leg lean mass (15.2 and 16.6 kg) compared to those consuming zero meals (377 N and 15.0 kg) containing ≥30 g of protein [15]. Whereas, Gaytán Gonález et al. [40] observed that older adults (≥60 yrs) consuming ≥2 meals/day containing ≥30 g of protein had a lower risk of disability compared to those that consumed 0-1 meals. Contrastingly, Gringrich et al. [12] did not find any statistical significant differences with those consuming ≥0.4 g/kg BM of protein and outcomes on FFM, skeletal muscle strength, and skeletal muscle power. Another cross-sectional study of healthy older adults (68.7 ± 6.3 yrs) found no differences in outcomes of appendicular lean mass when comparing those eating at least one meal containing ≥25 g of protein and those who had none [41]. Although there are mixed results, studies that found a positive association between number of meals and relative muscle outcomes had cohorts that were consuming less total daily protein than the recommended amount (i.e. <0.8 g/kg BM). Additionally, it is difficult to compare the results across studies as they differ in study design (e.g., longitudinal vs cross-sectional), outcomes (frailty, grip strength), age and physical health (frail, community-dwelling compared to trained older adults in this study) of the participants. The results of this study suggest that active older adults consuming adequate amounts of daily protein (including 1 meal/day of ≥0.4 g/kg BM) results in favourable outcomes in leg strength for males, but not females. However, considering the low compliance rate (37%) of meals reaching ≥0.4 g/kg BM it is uncertain whether if there was a comparator group with higher compliance if this association would differ. A larger sample size would overcome this limitation in future research.Although there have been numerous cross-sectional and observational studies reporting mixed findings of the association between dietary protein patterns related to outcomes of SMM and physical performance, this is the first study to assess the relationship of these outcomes in a cohort of active older adults. The threshold of 0.4 g/kg BM/meal derives from acute studies that measure the maximum amount of protein required to reach the threshold for MPS, using high quality single type protein sources (i.e., whey protein isolate) in healthy older men (~71 yrs) [17]. Considering that this study measured real-life examples of meals that contain different types of protein in mixed meals that may have altered the AA absorption kinetics. For example carbohydrate co-ingestion has been shown to delay protein digestion and absorption [42]. Furthermore, co-ingestion of certain vitamins and micronutrients have been shown attenuate or impair MPS [43, 44]. It is likely that differences in meal composition effects the absorption kinetics of protein, possibly effecting long term FFM, skeletal muscle strength, and skeletal muscle power outcomes. Therefore, higher amounts of protein in mixed meals may be required to elicit the same response in a mixed meal compared to the suggested amount derived from single protein studies.When considering the protein quality of the habitually consumed meals, there was no significant differences between males and females. Both groups received the majority of their protein sources from animal based proteins (70%). Whereas there was no significant differences between the dairy serves with the majority of the dairy sources deriving from milk (60%) followed by cheeses (20%). Furthermore, there was a small but significant association between the total number of protein serves and the number of dairy serves per day and leg strength, but no associations observed with number of animal protein serves. Similar findings have been observed, where there was a significant associations between higher dairy serve consumption (≥2.2 servings per day) and significantly greater FFM, HGS and physical performance in a cohort of healthy older women (70- 89 yrs) [29]. Furthermore, intervention studies within our laboratory have shown that a high-protein dairy milk beverage with progressive resistance training (PRT) program, lead to significantly greater adaptations in maximal strength, that were greater than PRT alone, after 12-weeks in a cohort of active older adults [45]. The components of dairy based foods that lead to the maintenance and improvement of strength and function are still unknown. Dairy based foods contain high levels of the branched-chained amino acids (BCAAs), leucine. Leucine acts as a substrate for MPS and also directly acts as a key anabolic signal for the activation of the mammalian target of rapamycin complex 1 (mTORC1) and other protein phosphorylation involved in skeletal muscle anabolic responses [46]. In addition, dairy milk foods contain other bioactive components (e.g., calcium, whey, casein, vitamin A, E) that may act synergistically with protein to improve outcomes of skeletal muscle mass [47]. Nonetheless, the participants within this study did not achieve the Australian Dietary Guidelines for milk, yoghurt, cheese and or/ alternatives for their age groups (2.5 to 3.5 serves for men, and 4 serves for women), therefore adding additional dairy products to habitual diet may be a promising strategy to improve protein intake in active older adults. The current study included the use of a 3-day food diary to infer daily dietary intake patterns. While these are acknowledged to be potential limitations due to the nature of using self-reported measures, based on the reported intake of the same cohort in a intervention study from this study group [45] it was observed that the energy and protein intakes of the 3-day food diaries did not change in the control groups over the course of a 12-week trial. For example, average relative protein intakes were reported to be 1.6 g/kg BM/day at baseline and 6-weeks and 1.4 g/kg BM/day at 12-weeks without any significant differences. Therefore, considering that the 3-day food diary was used and was consistently shown to be similar over 12-weeks it is likely to reflect their true food intake in the current study. Lastly, it is acknowledged that this current study included a relatively small sample size. However, we believe that findings may provide initial preliminary data to help contextualise future intervention trials and identifies methodological gaps in sarcopenic research in active older adults.
5. Conclusions
- This study showed that total protein intake, CV of protein intake, and daily number of meals containing ≥0.4 g/kg BM of protein and protein quality may provide an explanation for variations in outcomes related to FFM, strength and power in a cohort of active older adults. Total protein intake may not be strongly correlated to these outcomes in individuals who already meet and exceed the adequate amount of total protein required for active older adults (>1.2 g/kg BM/day). However, higher protein intakes may offset any negative associations commonly observed from skewed protein intakes. Further comparisons indicate that a minimum of 1 meal containing ≥0.4 g/kg BM of protein and a higher consumption of dairy intake may be required to result in favourable outcomes in leg strength.
ACKNOWLEDGEMENTS
- Ricardo Costa (RC) was the chief investigator and Zoya Huschtscha (ZH) was the primary investigator of the research project and contributed towards the original research idea. ZH, RC and Judi Porter contributed towards development of the experimental design. ZH, RC, and Alexandra Parr contributed towards various aspects of data collection, and sample collection and analysis. ZH and RC contributed towards the analysis of the raw data. ZH was responsible for the initial manuscript draft. All authors contributed to reviewing and revising the manuscript. All authors read and approved the final manuscript. Firstly, the authors would like to thank all the participants that volunteers to take part in this study. The author would also like to thank industry collaborators Greg Holden and Katrina Strazdins for their support and industry input along the course of the Monash University Graduate Research Industry Partnership- Food and Dairy program.
Disclosure
- Research funding was provided by Lion Dairy and Drinks, Australia, as part of Monash University Graduate Research Industry Partnership- Food and Dairy program. he funder was not involved in the development of the experimental protocol, data collection, analysis or interpretation of results. No restrictions were placed on the reporting of findings.
References
| [1] | Cruz-Jentoft AJ, Bahat G, Bauer J, Boirie Y, Bruyère O, Cederholm T, et al. Sarcopenia: revised European consensus on definition and diagnosis. Age and ageing. 2019; 48(1): 16-31. |
| [2] | Murphy C, Roche H. Nutrition and physical activity countermeasures for sarcopenia: Time to get personal? Nutrition Bulletin. 2018; 43(4): 374-87. |
| [3] | Burd NA, Gorissen SH, van Loon LJ. Anabolic resistance of muscle protein synthesis with aging. Exerc Sport Sci Rev. 2013; 41(3): 169-73. |
| [4] | Morton RW, Traylor DA, Weijs PJ, Phillips SM. Defining anabolic resistance: implications for delivery of clinical care nutrition. Curr Opin Crit Care 2018; 24(2): 124-30. |
| [5] | Faulkner, J.A.; Larkin, L.M.; Claflin, D.R.; Brooks, S.V. Age-related changes in the structure and function of skeletal muscles. Clin Exp Pharmacol Physiol. 2007; 34 (11): 1091–1096. |
| [6] | Breen L, Phillips SM. Skeletal muscle protein metabolism in the elderly: Interventions to counteract the'anabolic resistance'of ageing. Nutr Metab. 2011; 8(1): 68. |
| [7] | Morton RW, McGlory C, Phillips SM. Nutritional interventions to augment resistance training-induced skeletal muscle hypertrophy. Front Physiol. 2015;6: 245. |
| [8] | Phu S, Boersma D, Duque G. Exercise and Sarcopenia. J Clin Densitom. 2015; 18(4): 488-92. |
| [9] | Faulkner JA, Davis CS, Mendias CL, Brooks SV. The aging of elite male athletes: age-related changes in performance and skeletal muscle structure and function. Clin J Sport Med. 2008; 18(6): 501. |
| [10] | Beasley JM, Wertheim BC, LaCroix AZ, Prentice RL, Neuhouser ML, Tinker LF, et al. Biomarker-calibrated protein intake and physical function in the Women's Health Initiative. J Am Geriatr Soc. 2013; 61(11): 1863-71. |
| [11] | Houston DK, Nicklas BJ, Ding J, Harris TB, Tylavsky FA, Newman AB, et al. Dietary protein intake is associated with lean mass change in older, community-dwelling adults: the Health, Aging, and Body Composition (Health ABC) Study. Am J Clin Nutr. 2008; 87(1):150-5. |
| [12] | Gingrich A, Spiegel A, Kob R, Schoene D, Skurk T, Hauner H, et al. Amount, Distribution, and Quality of Protein Intake Are Not Associated with Muscle Mass, Strength, and Power in Healthy Older Adults without Functional Limitations-An enable Study. Nutrients. 2017; 9(12):1358. |
| [13] | Bauer J, Biolo G, Cederholm T, Cesari M, Cruz-Jentoft AJ, Morley JE, et al. Evidence-based recommendations for optimal dietary protein intake in older people: a position paper from the PROT-AGE Study Group J Am Med Dir Assoc. 2013; 14(8): 542-59. |
| [14] | Ten Haaf DS, De Regt MF, Visser M, Witteman BJ, De Vries JH, Eijsvogels TM, Hopman MT. Insufficient protein intake is highly prevalent among physically active elderly. J Nutr Health Aging. 2018; 22(9):1112-4. |
| [15] | Loenneke JP, Loprinzi PD, Murphy CH, Phillips SM. Per meal dose and frequency of protein consumption is associated with lean mass and muscle performance. Clin Nutr. 2016; 35(6): 1506-1511. |
| [16] | Morton, R. W., Murphy, K. T., McKellar, S. R., Schoenfeld, B. J., Henselmans, M., Helms, E., ... & Phillips, S. M. (2018). A systematic review, meta-analysis and meta-regression of the effect of protein supplementation on resistance training-induced gains in muscle mass and strength in healthy adults. Br J Sports Med (2018); 52(6): 376-384. |
| [17] | Moore DR, Churchward-Venne TA, Witard O, Breen L, Burd NA, Tipton KD, Phillips SM. Protein ingestion to stimulate myofibrillar protein synthesis requires greater relative protein intakes in healthy older versus younger men. J Gerontol A Biol Sci Med Sci. 2015;70(1):57-62. |
| [18] | Murphy C, Oikawa S, Phillips S. Dietary protein to maintain muscle mass in aging: a case for per-meal protein recommendations. J Frailty Aging. 2016; 5(1):49-58. |
| [19] | Symons TB, Sheffield-Moore M, Wolfe RR, Paddon-Jones D. A moderate serving of high-quality protein maximally stimulates skeletal muscle protein synthesis in young and elderly subjects. J Am Diet Assoc. 2009; 109(9):1582-6. |
| [20] | Cardon-Thomas DK, Riviere T, Tieges Z, Greig CA. Dietary Protein in Older Adults: Adequate Daily Intake but Potential for Improved Distribution. Nutrients. 2017; 9(3): 184. |
| [21] | Bollwein J, Diekmann R, Kaiser MJ, Bauer JM, Uter W, Sieber CC, et al. Distribution but not amount of protein intake is associated with frailty: a cross-sectional investigation in the region of Nürnberg. Nutr J. 2013; 12(1): 109. |
| [22] | Schoenfeld BJ, Aragon AA. How much protein can the body use in a single meal for muscle-building? Implications for daily protein distribution. J Int Soc Sports Nutr. 2018; 27 (15): 10. |
| [23] | Cermak NM, Res PT, de Groot LC, Saris WH, van Loon LJ. Protein supplementation augments the adaptive response of skeletal muscle to resistance-type exercise training: a meta-analysis. Am J Clin Nutr. 2012; 96(6): 1454-64. |
| [24] | Moore DR. Maximizing Post-exercise Anabolism: The Case for Relative Protein Intakes. Front Nutr. 2019; 10(6): 147. |
| [25] | Paddon-Jones D, Sheffield-Moore M, Katsanos CS, Zhang XJ, Wolfe RR. Differential stimulation of muscle protein synthesis in elderly humans following isocaloric ingestion of amino acids or whey protein. Exp Gerontol. 2006; 41(2): 215-9. |
| [26] | Tipton KD, Gurkin BE, Matin S, Wolfe RR. Nonessential amino acids are not necessary to stimulate net muscle protein synthesis in healthy volunteers. J Nutr Biochem. 1999; 10(2): 89-95. |
| [27] | van Vliet S, Burd NA, van Loon LJ. The Skeletal Muscle Anabolic Response to Plant- versus Animal-Based Protein Consumption. J Nutr. 2015; 145(9): 1981-91. |
| [28] | Lord C, Chaput JP, Aubertin-Leheudre M, Labonté M, Dionne IJ. Dietary animal protein intake: association with muscle mass index in older women. J Nutr Health Aging. 2007; 11(5): 383-7. |
| [29] | Radavelli-Bagatini S, Zhu K, Lewis JR, Dhaliwal SS, Prince RL. Association of dairy intake with body composition and physical function in older community-dwelling women. J Acad Nutr Diet. 2013; 113(12), 1669-1674. |
| [30] | National Health and Medical Research Council. Australian Dietary guidelines- providing the scientific evidence for healthier Australian Diets (2013). https://nhrmc.gov.au/about-us/publications/australian-dietary-guidelines [Accessed October 2020]. |
| [31] | National Medical Research council. A modelling system to inform the revision of the australuan guide to healthy eating (2011). https://www.eatforhealth.gov.au/sites/default/files/files/public_consultation/ n55a_dietary_guidelines_food_modelling_111216.pdf [Accessed October 2020]. |
| [32] | Waller M, Piper T, Miller J. National Strength and Conditioning Association: Strength and conditioning professional standards and guidelines. Strength and Conditioning Journal. 2009; 31(5): 14-20. |
| [33] | de Salles BF, Simao R, Miranda F, da Silva Novaes J, Lemos A, Willardson JM. Rest interval between sets in strength training. Sports Med. 2009; 39(9): 765-77. |
| [34] | Rittweger J, Schiessl H, Felsenberg D, Runge M. Reproducibility of the jumping mechanography as a test of mechanical power output in physically competent adult and elderly subjects. J Am Geriatr Soc. 2004; 52(1):128-31. |
| [35] | Roberts HC, Denison HJ, Martin HJ, Patel HP, Syddall H, Cooper C, et al. A review of the measurement of grip strength in clinical and epidemiological studies: towards a standardised approach. Age and ageing. 2011; 40(4): 423-9. |
| [36] | Ten Haaf DSM, van Dongen EJI, Nuijten MAH, Eijsvogels TMH, de Groot LCPGM, Hopman MTE. Protein Intake and Distribution in Relation to Physical Functioning and Quality of Life in Community-Dwelling Elderly People: Acknowledging the Role of Physical Activity. Nutrients. 2018 Apr 19; 10(4): 506. |
| [37] | Coelho-Júnior HJ, Milano-Teixeira L, Rodrigues B, Bacurau R, Marzetti E, Uchida M. Relative protein intake and physical function in older adults: A systematic review and meta-analysis of observational studies. Nutrients. 2018; 10(9):1330. |
| [38] | Tieland M, Borgonjen-Van den Berg KJ, van Loon LJ, de Groot LC. Dietary protein intake in community-dwelling, frail, and institutionalized elderly people: scope for improvement. Eur J Nutr. 2012; 51(2): 173-9. |
| [39] | Smeuninx B, Greig CA, Breen L. Amount, Source and Pattern of Dietary Protein Intake Across the Adult Lifespan: A Cross-Sectional Study. Front Nutr. 2020; 16(7): 25. |
| [40] | Gaytán-González A, Ocampo-Alfaro MJ, Torres-Naranjo F, Arroniz-Rivera M, González-Mendoza RG, Gil-Barreiro M, López-Taylor JR. The Consumption of Two or Three Meals per Day with Adequate Protein Content Is Associated with Lower Risk of Physical Disability in Mexican Adults Aged 60 Years and Older. Geriatrics. 2020 6;5(1):1. |
| [41] | Valenzuela RE, Ponce JA, Morales-Figueroa GG, Muro KA, Carreón VR, Alemán-Mateo H. Insufficient amounts and inadequate distribution of dietary protein intake in apparently healthy older adults in a developing country: implications for dietary strategies to prevent sarcopenia. Clin Interv Aging. 2013; 8: 1143-8. |
| [42] | Gorissen SH, Burd NA, Hamer HM, Gijsen AP, Groen BB, van Loon LJ. Carbohydrate coingestion delays dietary protein digestion and absorption but does not modulate postprandial muscle protein accretion. J Clin Endocrinol Metab. 2014; 99(6): 2250-8. |
| [43] | van Vliet S, Shy EL, Abou Sawan S, Beals JW, West DW, Skinner SK, Ulanov AV, Li Z, Paluska SA, Parsons CM, Moore DR, Burd NA. Consumption of whole eggs promotes greater stimulation of postexercise muscle protein synthesis than consumption of isonitrogenous amounts of egg whites in young men. Am J Clin Nutr. 2017; 106(6): 1401-1412. |
| [44] | Bjørnsen T, Salvesen S, Berntsen S, Hetlelid KJ, Stea TH, Lohne-Seiler H, Rohde G, Haraldstad K, Raastad T, Køpp U, Haugeberg G, Mansoor MA, Bastani NE, Blomhoff R, Stølevik SB, Seynnes OR, Paulsen G. Vitamin C and E supplementation blunts increases in total lean body mass in elderly men after strength training. Scand J Med Sci Sports. 2016; 26(7): 755-6. |
| [45] | Huschtscha Z, Parr A, Porter J, Costa RJ. The Effects of a high-protein dairy milk beverage with or without progressive resistance training on fat-free mass, skeletal muscle strength and power, and functional performance in healthy active older adults: a 12-week randomized controlled trial. Front Nutr. 2021; 8:644865. |
| [46] | Burd NA, Gorissen SH, van Loon LJ. Anabolic resistance of muscle protein synthesis with aging. Exerc Sport Sci Rev. 2013; 41(3): 169-73. |
| [47] | Granic A, Hurst C, Dismore L, Aspray T, Stevenson E, Witham MD, Sayer AA, Robinson S. Milk for Skeletal Muscle Health and Sarcopenia in Older Adults: A Narrative Review. Clin Interv Aging. 2020; 20(15): 695-714. |