-
Paper Information
- Paper Submission
-
Journal Information
- About This Journal
- Editorial Board
- Current Issue
- Archive
- Author Guidelines
- Contact Us
International Journal of Sports Science
p-ISSN: 2169-8759 e-ISSN: 2169-8791
2020; 10(2): 38-42
doi:10.5923/j.sports.20201002.02

The Relationship Between Back Squat Strength and Sprint Times Among Male NCAA Track Athletes
 Abstract
 Reference
 Full-Text PDF
 Full-text HTML
Ryan Conan, Mark DeBeliso
Department of Kinesiology and Outdoor Recreation, Southern Utah University, Cedar City, USA
Correspondence to: Mark DeBeliso, Department of Kinesiology and Outdoor Recreation, Southern Utah University, Cedar City, USA.
| Email: |  |
Copyright © 2020 The Author(s). Published by Scientific & Academic Publishing.
This work is licensed under the Creative Commons Attribution International License (CC BY).
http://creativecommons.org/licenses/by/4.0/

Prior research indicates that lower body strength and body mass are associated with athletic performance including sprint speed [1,2]. The direct association between lower body strength and track competition sprint performance has not been well documented. Hence, the purpose of this study was to determine if there was a meaningful relationship between relative strength in the back squat (BSQ) and 60-100m competition sprint times among male college sprinters. The participants were male NCAA Division 1 track sprinters 18-21 years of age (n = 16). Data collected from each athlete included 1-RM BSQ (kg), Body mass (kg), 60m, and 100m sprint times. BSQ, BSQ/Body Mass, and allometrically scaled BSQ/(Body Mass**0.67) scores were then compared to the 60m and 100m sprint times using the Pearson correlation coefficients (r). Results demonstrated moderate to high negative relationships between 60m sprint times and BSQ metrics ranging from r= -0.55 to -0.62 (p<0.05). The relationships between 100m sprint times and BSQ metrics ranged from low negative r=-0.32 (non-significant p>0.05) to moderate negative r=-0.57 (significant p<0.05). Within the parameters of this study, 60m sprint times are meaningfully associated with relative lower body strength, while relative lower body strength is less of a factor in regards to the 100m sprint times.
Keywords: Relative strength, Collegiate, Allometric
Cite this paper: Ryan Conan, Mark DeBeliso, The Relationship Between Back Squat Strength and Sprint Times Among Male NCAA Track Athletes, International Journal of Sports Science, Vol. 10 No. 2, 2020, pp. 38-42. doi: 10.5923/j.sports.20201002.02.
Article Outline
1. Introduction
- Track and field sprinters are some of the best athletes in the world. Even at the collegiate level there are athletes who rank among some of the best internationally. During the 2018 indoor NCAA track and field championship two world records were broken by college aged sprinters in the men’s 400m sprint and the men’s 4x400m relay. To be able to compete at such a high level requires a high level of commitment and training as well as a mix of good genetic traits [3]. To be a successful sprinter one must be able to generate a great amount of force to overcome inertia and propel oneself down the track. The greater the explosive force created during the start of the race allows the athlete to reach top speeds quicker and have a higher maximal velocity [4].Resistance training (RT) is essential for most sports to improve athletic performance [1]. It is especially true for track and field sprinters who wish to be at the top of their game. Being able to generate force to be able to overcome inertia and propel oneself down the track at a sufficiently rapid rate requires an athlete to be strong as well as have a low body weight. These factors have been linked to fast sprint times in short distances and improvement in acceleration performance [1]. An athlete needs a favorable combination of genetic, cultural, physiological, and socio-economic factors in order to succeed and compete at the highest levels of the sport [3]. Many of these factors may be out of the control of the athlete, but there are a select few, such as training and effort, over which the athlete does have control. An athlete does not have any control over how tall they are or what genes they inherit, but they can control and influence how strong they are through RT as well as body composition through diet and exercise.As a sprinter runs forward they produce a force driving into the ground and as a result the ground produces an equal force that propels the runner both vertically and horizontally [5]. This force is known as the ground reaction force. Newton’s third law states that to every action there is an equal and opposite reaction. It can be logically deduced that as an athlete generates a greater force upon the ground then they will receive a greater force propelling them upward and outward. The evidence of this can be seen by the research of Coh et al. [4] as they observed faster sprinters generated more force and rate of force production out of the blocks than slower sprinters. It has been observed in this instance [4] and others [6,7] that the more force that can be applied out of the blocks the greater the rate of acceleration will be. This is so because of the principle of impulse.As a sprinter is pushing off of the blocks they are applying force [4]. “Force impulse is determined by the duration of the applied force, the magnitude of the applied force, and the rate of force development” [4]. As an athlete is able to produce greater force with a quicker rate of force development, the greater the impulse is that is generated and the faster the athlete will be propelled down the track. This impulse leads to an increased SL and SR which would result in an increase in maximal speed. It has been observed by others as well that there is a significant correlation between GRF, impulse and sprinting velocity [8,9].Because force generation plays such a large role in acceleration it is paramount to be able to produce a substantial amount force to adequately move down the track at high sprint velocities. Therefore, muscle mass is very important to the acceleration phase. It is during this phase that an athlete is fighting to overcome inertia and increase their stride length [3]. In multiple cases it has been reported that maximal strength, from the squat and power clean exercises, has been significantly correlated with sprint performance [10]. Being able to produce force is an important part of being able to accelerate successfully during a sprint race. The most important muscles to sprinting include: gluteus maximus, tibialis anterior, soleus, gastrocnemius, rectus femoris, biceps femoris, and vastus lateralis [11]. It is important to develop these muscles, and exercises such as the back squat (BSQ) target these groups to help increase muscle mass and the muscles force generating capacity. Some have indicated that increased muscle mass means increased power which produces a greater GRF when sprinting [12]. Also, greater muscular strength allows an athlete to potentiate earlier and to a greater extent [13].However, with increased muscle mass there is a commensurate amount of inertia that has to be overcome by the sprinter. Hence, increased muscle mass in the absence of an improved strength to body mass ratio will not likely lead to improved acceleration and sprint performance, a concept that prior researchers have failed to report [3]. This notion is supported by the following. Absolute strength is the maximal force that a muscle can generate regardless of muscle mass or body weight [14]. There are conflicting view points on whether absolute strength correlates with maximal speed during sprinting. Some researchers have found there to be significant correlation regarding absolute strength and sprint performance [10], while others say it is inconclusive or there is no significant correlation [2,15,16].While there are conflicting views on the basis of absolute strength and sprint performance, when it comes to relative strength there seems to be more concurrence among scholars [13,17,18]. Relative strength is the ratio of the strength of the muscles being used to the body mass of the individual. This strength to mass ratio directly reflects an athlete’s ability to accelerate his or her body [14]. Elite sprinters have increased muscle mass to be able to produce incredible amounts of force while their body composition is at a complementary level. Among world class sprinters there is a low variability in body mass index, for men 23.7±1.5 and for women 20.4±1.4 [12]. This is probably due to the fact that as an athlete gets heavier then the energy cost of accelerating the increased mass increases as well (and as noted above). Therefore, it appears reasonable to assume that both lower body strength and body weight (or mass) play critical roles when it comes to sprint performance. The purpose of this study was to attempt to determine the extent to which lower body strength, body mass, and sprint performance relate among accomplished male college age sprinters. Specifically, competitive sprint times in the 60m and 100m sprint were compared with 1RM (one repetition maximum) absolute BSQ strength, relative BSQ strength, and allometrically scaled BSQ strength.
2. Methods
2.1. Participants
- This study involved male college sprinters between the ages of 18-22 years. The data gathered consisted of in-season sprint times, BSQ 1-RM, and BM (body mass) of NCAA Division I collegiate track and field sprinters from across the nation. The data was gathered via voluntary request from track and field coaches at differing universities without athlete identifiers. The University IRB considered the study as an exempt protocol as data was not previously collected for the purpose of research and was provided to the researcher void of athlete identifiers (IRB approval #12-102018d).
2.2. Procedures
- Data requests were sent via E-mail to NCAA Division I track coaches and strength and conditioning coaches across the nation. The data collected included athlete’s age, year in school, body weight, BSQ 1-RM, 60m and 100m sprint times for the 2018 collegiate track and field season. Sprint results were screened to disqualify all wind aided times greater than +4.0 m/s that might skew the data. All received data was then gathered, categorized and organized into an MS excel spreadsheet for subsequent statistical analysis.
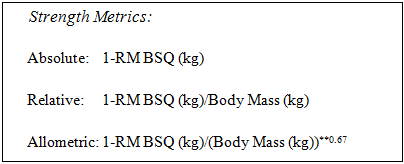
2.3. BSQ Absolute, Relative and Allometric
- The 1-RM BSQ has been considered as a strong indicator of lower body strength and therefore the main assessor of strength in this study [10]. It has also been found in prior research that relative strength (1-RM BSQ/Body Mass) is a better indicator of athletic ability pertaining to running than absolute strength [18]. Allometric scaling is a method of normalizing physical performance measures such as strength relative to body size [18].The absolute 1-RM BSQ was assessed and recorded in kilograms (kg). The 1-RM BSQ was then normalized to body mass and was considered as relative strength. Finally, the 1-RM BSQ was allometrically scaled as previously described.
2.4. Statistical Analysis
- Pearson correlation coefficients (PCC or r) were employed to examine the relationship between the 1-RM BSQ, 1-RM BSQ normalized to body mass, and 1-RM BSQ allometrically scaled with 60 and 100 meter competitive sprint times. The significance for the study was set at α≤0.05. Data management and statistical analysis were carried out in a MS Excel 2016 spreadsheet.
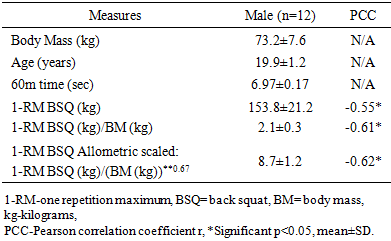
3. Results
- The results are based on 16 athletes where 12 were included in the 60m sprint results and 11 were included in the 100m sprint results.Table 1.1 provides the body mass, age, 60m sprint times, 1-RM BSQ, 1-RM BSQ/Body mass, and allometrically scaled 1-RM BSQ for those who competed in the 60m sprints (n=12). Likewise, Table 1.1 provides the PCCs between the 60m sprint times and the metrics of the 1-RM BSQ.
|
|
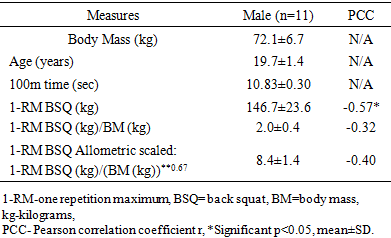
4. Discussion
- The purpose of this study was to determine the relationship between lower body strength, body mass and sprint performance in male collegiate sprinters. Specifically, NCAA track competition recorded 60m and 100m sprint times were compared with 1-RM BSQ metrics (absolute, relative, and allometrically scaled). Given the high degree of correlation with relative strength and athletic performance [2,10,11], it was hypothesized that individuals with a stronger relative strength would run lower (faster) times in the 60m and 100m sprint. Data collected from the current study partially supported this hypothesis.The PCCs between the 60m sprint times and BSQ metrics were: r = -0.55 for the 1-RM BSQ, r= -0.61 for the 1-RM BSQ/BM, and r = -0.62 for the 1-RM BSQ allometrically scaled. According to Miller [20], these correlations range from moderate to high; noting that the negative sign indicates that higher BSQ strength is associated with lower (faster) 60m sprint times. However, the data only suggested that there was a moderate correlation between 1-RM BSQ and the 100m sprint. The PCCs between the 100m sprint times and BSQ metrics were r= -0.57 for the 1-RM BSQ, r= -0.32 for the 1-RM BSQ/BM, and r= -0.40 for the BSQ allometrically scaled. In summary, it would appear that relative and allometrically scaled BSQ strength was more strongly associated with 60m sprint than 100m sprint times. The difference between the 60m and 100m association with metrics of BSQ strength is likely due to the length of the race and the acceleration phase. It can be argued that the acceleration phase of the shorter sprints is the most important phase, as it is crucial to race development. At the beginning of the sprint, the ability to produce a large amount of concentric force/power to generate a high velocity is extremely important [21]. It has been demonstrated that an athlete develops 80-90% of their maximal speed during the acceleration phase of the race [11]. During the acceleration phase the duration of contact time is relatively longer than later in the race, therefore the most important motor ability is power/strength of contractility [11]. In the later phases ground contact is shorter and the importance shifts from strength/power to elastic energy [11]. The acceleration phase typically lasts 20-40m [23]. The acceleration phase of the 60m sprint takes up 30-60% of the entire race, while the acceleration phase of the 100m sprint takes up only 20-40% of the entire race. It would appear that the acceleration phase of the 60m sprint is more important when compared to performance in the 100m sprint as it takes up a larger portion of the race.The current data, along with previous studies, reported an increase in sprint speed with an increase in lower body strength [10]. That relation seems to be enhanced when lower body strength is scaled to body mass [13,18]. Lower body strength is paramount in generating force in athletes; therefore, increasing strength should help an athlete to generate more force [24,25]. It has been found that sprinters who typically produce faster times showed greater force development out of the blocks than the slower sprinters [3,4] as well as decreased ground contact time and greater stride length [26]. It has also been reported that during the acceleration phase of the 100m sprint, athletes with stronger lower extremities produced a stronger impulse during the propulsive phase resulting in a longer stride [23]. With regards to relative strength, Wisloff et al. [10] observed a strong correlation between 10-meter sprint time and 1-RM relative BSQ with soccer players. While other researchers also found a significant correlation between short sprint times and 1-RM relative BSQ strength [18]. The results of the aforementioned studies [3,4,10,13,18,19,25,26] supports the notion that lower body absolute and relative strength play a significant role in the ability to sprint.The data collected in this study is supported by prior research among athletes regarding lower body strength and sprint speed over short distances [13,14,19]. While most of the studies regarding lower body strength and sprint speed agree that there is a correlation between the two, there is a dearth research involving male college and elite sprinters. One study involving Div. 1 female sprinters found that lower body strength was the greatest indicator for sprint speed (r=0.92) [22]. However, the aforementioned study used data (i.e. sprint times) from a non-competitive setting. A strength of the current study is that the sprint times gathered were from actual NCAA sanctioned competitions. Hence, allowing for a more generalized and realistic application of the study results. The results from the current study align with the notion that improving absolute lower body strength may result in faster sprinting speed. However, it appears that improving relative lower body strength would provide for even greater improvements in sprinting speed. This knowledge could be used as a mechanism for athletes who are looking to gain sprint speed by focusing on increasing lower body strength while also managing relative body mass. The model provided by Suchomel et al. [13] indicates that as long as relative lower body strength increases there will be a similar increase in muscle potentiation, muscle recruitment, and faster sprint times. As such, an increase in relative lower body strength would seem to be effective in lowering sprint times.The practical application of this model would be to focus on resistance training (RT) programs that will increase lower body strength while monitoring body weight and making necessary adjustments to dietary intake until the athlete is at a safe and optimal lower body strength to BM ratio [13] while continuing all other effective sprint training strategies. The current study is limited by the relatively small sample size. With larger similar data sets, future research could find more precise correlations between relative strength and sprint times. The current study is also limited on the basis of sport specificity. Due to the sport specific training required to be a successful sprinter, the results of the current study are not necessarily applicable to other populations. Specifically, simply increasing relative lower body strength alone may not yield significant differences in sprint speed among untrained individuals or young athletes. Another limitation is the presumption that the athletes in the current study were injury free at the time of running their track event as well as when they recorded their 1-RM BSQ. In retrospect such information may have bolstered the results presented. Future research could focus on developing RT programs that will increase relative lower body strength and determine if it produces faster sprint times among junior and high school sprinters.
5. Conclusions
- Within the parameters of this study, it is concluded:• Absolute lower body strength is moderately associated to 60m and 100m sprint times, • Lower body relative and allometrically scaled strength is highly associated with 60m sprint times, and• Given the high relationship between lower body relative and allometrically scaled strength and 60m sprint times, a focus on developing lower body strength and moderating body mass in college sprinters would appear to be beneficial to increase sprint performance.