-
Paper Information
- Paper Submission
-
Journal Information
- About This Journal
- Editorial Board
- Current Issue
- Archive
- Author Guidelines
- Contact Us
International Journal of Sports Science
p-ISSN: 2169-8759 e-ISSN: 2169-8791
2020; 10(2): 31-37
doi:10.5923/j.sports.20201002.01

Ultrasound Derived Muscle Cross-Sectional Area and Echo Intensity is Unable to Detect Differences Among Acute Aerobic Exercise Bouts with Varying Duration and Intensity
 Abstract
 Reference
 Full-Text PDF
 Full-text HTML
Eric J. Sobolewski, Andrew B. Hall, Gabrielle C. Rodriguez, Morgan O. Richard
Health Science Department, Furman University, 3300 Poinsett Highway, Greenville, SC, USA
Correspondence to: Eric J. Sobolewski, Health Science Department, Furman University, 3300 Poinsett Highway, Greenville, SC, USA.
| Email: |  |
Copyright © 2020 The Author(s). Published by Scientific & Academic Publishing.
This work is licensed under the Creative Commons Attribution International License (CC BY).
http://creativecommons.org/licenses/by/4.0/

Research is currently utilizing ultrasound (US) imaging to evaluate acute muscle damage from exercise. Common derived US measurements to evaluate muscle damage are: image grey scale, commonly known as echo intensity (EI), and cross sectional area (CSA). Due to limited literature, it is unclear how and to what degree extended aerobic exercise effects EI and CSA. This study evaluated if CSA and EI could differentiate between duration and intensity of exercise. Twenty aerobically trained (12+ hrs per week) subjects, sixteen males and four females (age: 23 ± 8.3, height 181 ± 9.1 cm, mass 76 ± 12.5 kg) voluntarily underwent the following four bouts: a VO2 max test, 20, 40 and 60 minutes of cycling. Prior to and following exercise US images where taken of the right rectus femoris and vastus lateralis muscles, subsequent analyses of EI and CSA were performed. Significant (P<0.01) increase overall muscle EI was found between pre and post for all exercise conditions, but CSA only increase in the max and 20 minute conditions. Further EI and CSA could not differentiate between exercise conditions. Ultrasound imaging is not sensitive enough to determine different levels of exercise or fatigue, and any acute changes can be attributed to acute muscle swelling.
Keywords: Muscle quality, Muscle Damage, Cycling
Cite this paper: Eric J. Sobolewski, Andrew B. Hall, Gabrielle C. Rodriguez, Morgan O. Richard, Ultrasound Derived Muscle Cross-Sectional Area and Echo Intensity is Unable to Detect Differences Among Acute Aerobic Exercise Bouts with Varying Duration and Intensity, International Journal of Sports Science, Vol. 10 No. 2, 2020, pp. 31-37. doi: 10.5923/j.sports.20201002.01.
Article Outline
1. Introduction
- With the recent advancement of technology making Ultrasound (US) imaging more affordable and portable, studies have begun to utilize this technology to analyse muscles’ size and quality. Muscle size using ultrasound has been compared to CT scans [1] and has shown to be both reliable and a valid measurement for measuring cross-sectional area (CSA) in muscle. One application of US imaging is examining echo intensity (EI) to determine muscle quality [2]. EI is based on a grey scale with 0 being a pure black pixel and 255 being a pure white pixel [3]. It is generally accepted that the darker the pixels of the muscle (low echogenicity) the better the quality is, as low frequency beams penetrate further into soft tissue rather than reflect connective and adipose tissue (high echogenicity) [4]. EI values have been correlated with fibrous tissue [3,5], intramuscular adiposity [2,6], glycogen stores [7,8] and an increase in water content [9].EI and CSA measurements are now being used to measures acute muscle swelling [10,11] as markers of muscle damage. Stock et al [12] showed that muscle thickness increased after a concentric workout but did not alter EI. Damas et al. [11] observed changes in vastus lateralis CSA and EI following three and six weeks of training and contributed their results to muscle damage. EI is commonly used as a marker of muscle damage as it has shown to increase with both concentric [13] and eccentric [14] exercises as well as plyometric training [15]. The majority of the research evaluating EI as a marker of muscle damage is following resistance exercises, yet EI has not shown to change with endurance type exercise [14]. With minimal research, investigating the possible changes in EI following aerobic training very little is known of the effect of aerobic exercise on EI. Currently there are only two manuscripts that have evaluated EI and aerobic activity [7,8]. Hill et al. [7] demonstrated that EI increased with 90 minutes of moderate to high intensity cycling which also strongly correlated to glycogen depletion in muscle. Nieman et al [8] also showed the relationship between EI and glycogen content as the changes in EI were highly correlated with changes in muscle glycogen content after a 75 km cycling time trial. They concluded that EI may be a valid non-invasive way to measure changes in glycogen content and may discriminate how much glycogen depleted during exercise. If EI can detect muscle glycogen stores then exercising at different intensities and durations would deplete glycogen at different rates resulting in difference in EI. Further, if EI and CSA are used as markers of muscle damage, their magnitude would changes based on the intensity and duration of exercise [16]. Therefore, the purpose of this study was to evaluate changes in CSA and EI between different duration and intensity of aerobic exercise.
2. Methods
2.1. Participants
- Twenty Participants: sixteen males and four females (Mean ± SD: age: 23 ± 8.3, height 181 ± 9.1 cm, mass 76 ± 12.5 kg,) volunteered for this study. Participants were self-reported aerobically trained (12 or more hours per week) and were familiar with long bouts of training on a bike. Prior to any testing participants read and signed an informed consent and a health history questionnaire. All participants were free of any neurological disease or musculoskeletal injuries and could voluntarily withdraw at any time. This study was approved by the Institutional Review Board for protection of human subjects according to the Declaration of Helsinki. (FUIRB #: 10818).
2.2. Procedures
- Each participant visited the lab on four separate occasions separated by at least 48 hours. Day one consisted of a ramped VO2 max protocol on a Lode cycle ergometer (Lode Excalibur Sport B.V. Groningen, Netherlands) starting at 50 watts and increase 25 watts per minute until volitional fatigue was met. Participants’ oxygen consumption, ventilations and heart rate were measured with a metabolic cart (Cosemed Quark CPET Rome, Italy) and a heart rate strap (Polar Electro Oy, Kempele, Finland). Max wattage was recorded and used for initial starting intensity for the following three exercise days of 20, 40, and 60-minute bouts. Prior to testing each participants blood glucose was measured and had an ultrasound assessment performed. Following exercise each participant had their blood lactate and glucose measured and the ultrasound assessment performed again. Each exercise day was performed in a random order from subject-to-subject, and all exercises were performed with the same equipment and protocol. Participants were asked to maintain normal activities of daily living throughout the study, but we asked to refrain working out 24 hours prior to testing.
2.3. Experimental Protocol
- 20-Minute Interval: Participants performed two-minute intervals at 95% of their max workload followed by 2 minutes of easy pedalling at 50 watts. This was repeated for 20 minutes for five rounds of high intensity intervals. VO2, ventilation and heart rate were recorded during the full exercise bout. 40-Minute Continuous: Participants performed 40 minutes of continuous cycling starting out at 85% of max workload. Wattage was adjusted as subjects fatigued so that they could continue the exercise session. VO2, ventilation and HR were recorded for 5-minute intervals from 15-20 minutes and 35-40 minutes. 60-Minutes Continuous: Participants performed 60 minutes of continuous cycling starting out at 75% of max workload. Wattage was adjusted as subjects fatigued so that they could continue the exercise session. VO2, ventilation and HR were recorded for five minute intervals from 25-30 minutes and 55-60 minutes.
2.4. Blood Lactate and Glucose
- Immediately following each exercise protocol blood lactate and glucose were measured via a finger prick. Blood lactate was analysed using Lactate Plus Nova Biomedical (Waltham MA, USA) and reported as mmols and blood glucose was analyzed with Accu-Chek Aviva Roche Diagnostics (Mannheim, Germany) and reported as mg/dl. Blood glucose levels were measured prior to exercise as well.
2.5. Ultrasound Assessment
- Ultrasonography images were taken with a portable B-mode imaging device (GE Logiq e BT12, GE Healthcare, Milwaukee, WI, USA) and a multi-frequency linear-array probe (12 L-RS, 5–13 MHz, 38.4-mm field of view, GE Healthcare, Milwaukee, WI, USA). The panoramic function was used to obtain images of the right rectus femoris (RF) and vastus lateralis (VL) in the transverse plane. The images were taken at 1/2 of the distance between the anterior superior iliac spine and the superior border of the patella. A high-density foam pad was secured around the right thigh with an adjustable Velcro strap to ensure probe movement in the transverse plane. Ultrasound settings (Frequency: 10 MHz, Gain: 45 dB, Dynamic Range: 72) were kept consistent across participants. To ensure optimal image clarity, scanning depth was individualized for each participant (3.5–6.0 cm). A generous amount of water-soluble transmission gel (Aquasonic 100 ultrasound transmission gel, Parker Laboratories, Inc., Fairfield, NJ, USA) was applied to the skin such that it immersed the probe surface during testing to enhance acoustic coupling. Consistent with the work of Young et al. [2], three images were taken for each participant, and the mean values have been reported herein. Skin was marked so that following the exercise protocol so the foam pad could easily be place back on the leg and measurements taken at the exact same spot. The ultrasound images were digitized and examined with ImageJ software (version 1.46, National Institutes of Health, Bethesda, MD, USA). The polygon function was used to outline the border of the RF and VL, and cross-sectional area (CSA) was measured and echo intensity (EI) was assessed by a computer-aided gray-scale analysis using the histogram function. The echo intensity values were determined as the corresponding index of muscle quality ranging between 0 and 255 A.U. (black = zero, white = 255).
 | Figure 1. An example rectus femoris (RF) (left: small dots) and vastus lateralis (VL) (right: large dashes) images and their associated analyses. The lines correspond to the border of the muscle. The corresponding gray-scale histogram have been provided under each muscle and the area measurements are in the middle |
2.6. Statistical Analysis
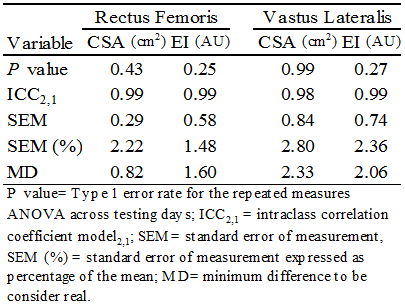
- Differences in pre and post-test values for CSA and EI of the RF and VL muscles were converted into change scores, and repeated measures ANOVAs were used to analyze the differences between each exercise condition. If a main effect (P≤ 0.05) was detected, a post hoc Bonferroni test was used. Paired sample t-tests were performed to examine pre and post-test differences across all variables (CSA, EI and Blood Glucose) within each exercise condition. All statistical analyses were performed using Statistical Package for Social Science (IBM SPSS Statistics for Windows, Version 23.0. Armonk, NY).Test–retest reliability for RF and VL CSA and EI were evaluated using model “2,1” to determine the intraclass correlation coefficients (ICCs), standard error of measurement (SEM), and minimum difference (MD) values. In addition, SEM values are also expressed as a percentage of the mean. Test– retest reliability data were analyzed using a custom-written software program (Microsoft Excel, Microsoft Corporation, Redmond, WA, USA). Systematic variability for each variable across testing days was examined using separate one-way repeated-measures ANOVAs. [17] Alpha levels were set a priori at P ≤ 0.05 to determine statistical significance.
3. Results
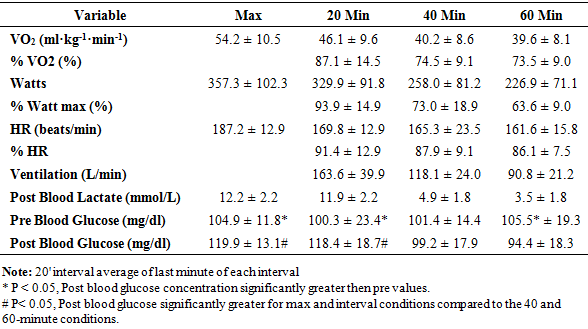
- For plasma glucose, pre values were significantly (P<0.13) greater than the post values for every exercise condition except the 40-minute condition. There was no significant (P=0.59) difference in pre values for plasma glucose, yet plasma glucose was significantly (P<0.01) increased following the max and 20-minute interval conditions compared to the 40 and 60-minute conditions. (Table 1)
|
|
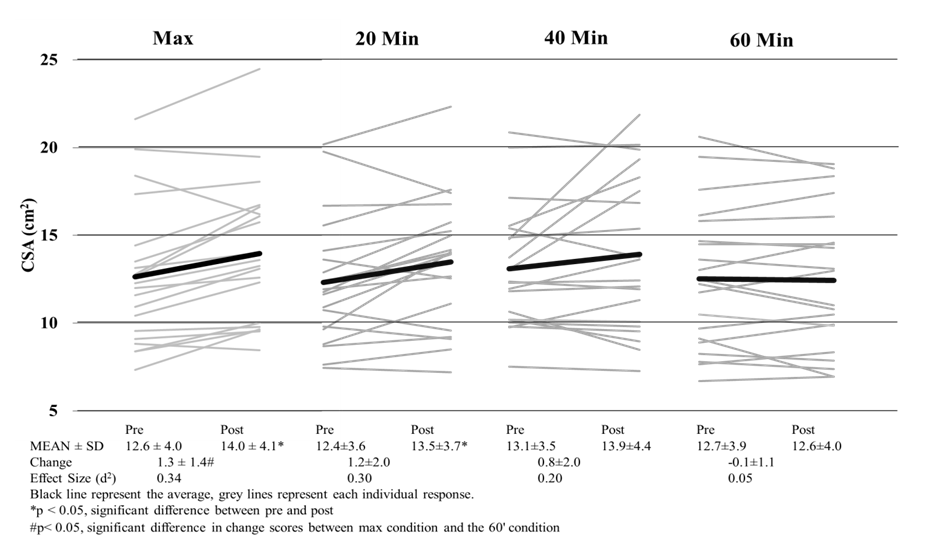 | Figure 2. Cross-Sectional Area of the Rectus Femoris Pre and Post Exercise |
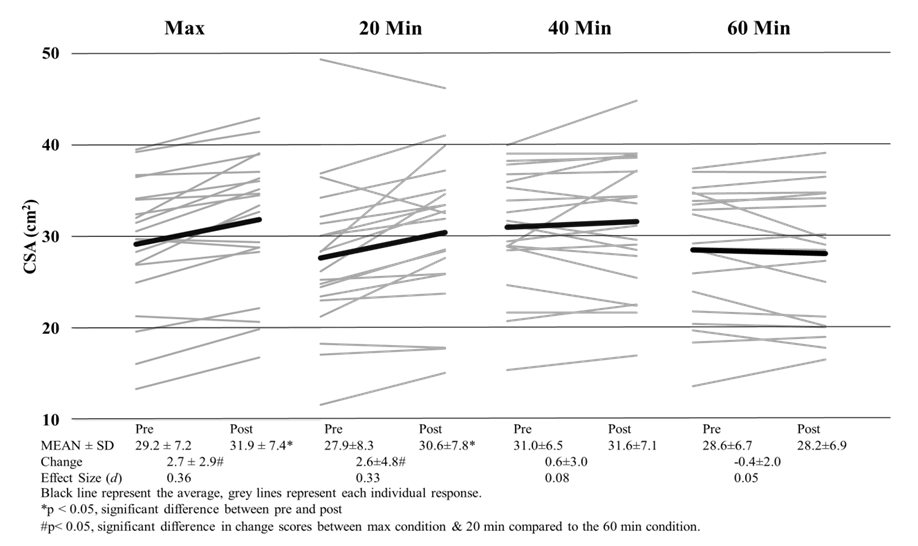 | Figure 3. Cross Sectional Area of the Rectus Vastus Lateralis Pre and Post Exercise |
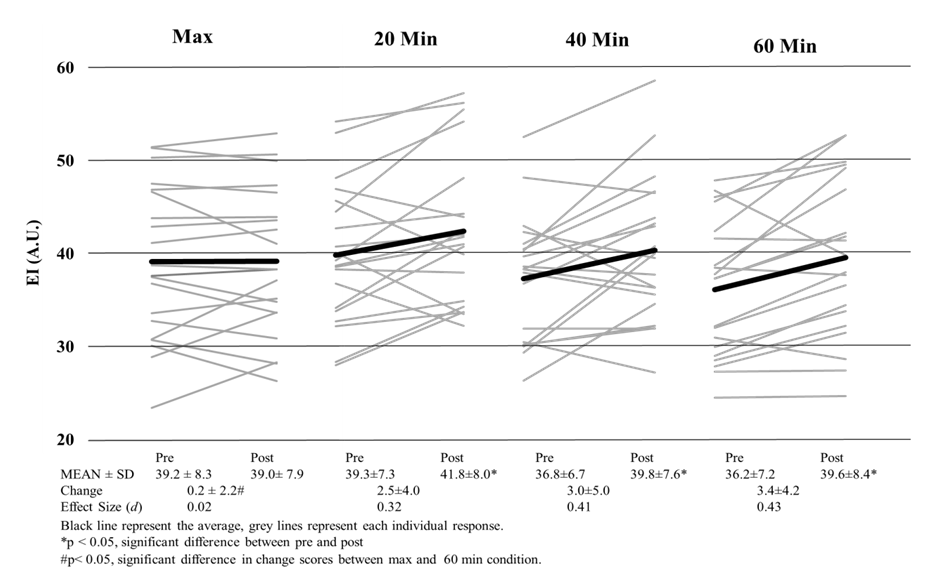 | Figure 4. Echo Intensity of the Rectus Femoris Pre and Post Exercise |
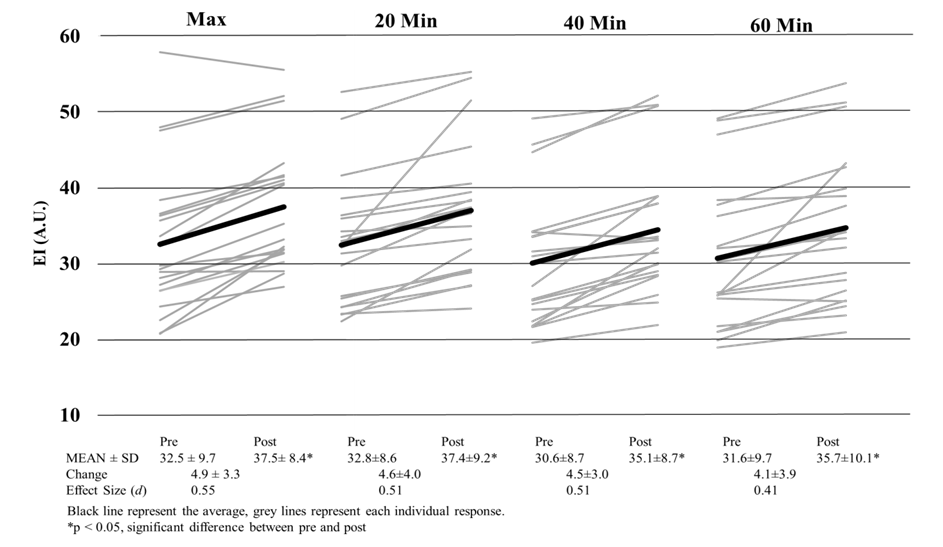 | Figure 5. Echo Intensity of the Vastus Lateralis Pre and Post Exercise |
4. Discussion
- This is the first study to evaluate whether US imaging can differentiate between exercise intensity and durations, and our data suggests that US imaging is not sensitive enough to detect these differences. Our study did show that CSA and EI are affected by cycling exercise as measurable increases in CSA and EI were observed. In all conditions, EI was significantly higher post exercise than it was prior to exercise. It has been speculated that changes in EI may be a result of the depletion of glycogen [7], yet the magnitude of EI changes were no different between a short, high intense bout and a long duration of cycling exercise. If glycogen were truly being depleted, then change scores would have been greater for the 60-minutes than either of the max or 20-minute interval sessions. Even with varying difference in exercise protocols, (duration and intensity) previous studies have shown depletion in glycogen stores from as little as 10-minutes of sprint intervals [18] and 60 minutes of cycling at ~84% VO2 [19]. Even though muscle glycogen was not directly measured, a change in blood glucose levels were observed. An increase in blood glucose for the max and interval conditions indicates a release of glycogen from stores and a decrease in the 60-minute condition indicates glucose uptake by muscle [20]. So even though even though Hill & Millan [7] have reported high correlations (r=0.81) with EI and muscle glycogen biopsies, we did not see appropriate changes in EI following known protocols that illicit muscle glycogen depletion. Our results confirm recent research [21] that determined EI has no relation to glycogen stores at all. Given the amount of literature on glycogen store depletion during exercise, US imaging is not able to differentiate the quantity depleted during exercise.Changes in EI observed in this study may be attributed more too acute muscle swelling than glycogen depletion. Acute muscle swelling is associated with an increase in plasma enzyme levels [22], edema [11] and buildup of metabolites as a result of exercise [23]. Our results demonstrated that the increase in EI corresponded with an increase in CSA of the muscle, further indicating that the muscle itself is larger because of muscle swelling, thus altering EI. This was clearly seen in both the max and 20-minute interval conditions as these conditions produced significant changes in CSA and EI. Both of these conditions were highly anaerobic in nature and produced the highest levels of lactate, heart rate, ventilation rate and VO2 consumption, which are all indicative of high intensity exercise (Table 1). In contrary, the 40 and 60-minute conditions elicited a change in EI but not a change in CSA. One explanation for this is osmosis equilibrium during exercise, where water/fluids enter the muscle cells thus changing EI, but ultimately is balanced by metabolites leaving the cell resulting in no change in CSA. The mechanisms that lead to acute changes in EI are not fully understood and can only be speculated. In longer duration bouts such as 40+ minutes of exercise, the mechanisms that lead to changes in EI may not be the same as the changes observed from the higher intensity bouts. These discrepancies are were first seen with signal intensity differences in MRI imaging [23] between leg extension and cycling exercises, with cycling increasing signal intensity in more muscles and in a greater strength then leg extensions. Further research has shown that not all exercise types illicit the same EI responses; as concentric [24] and eccentric [13] workouts increase CSA but not EI immediately following exercise. Only after 24 hours do researcher see changes in EI with resistance training [13]. Our results demonstrate that EI and CSA are affected by aerobic cycling. Higher intensity bouts lead to increase in EI and CSA, however longer duration bouts only affects EI. Further investigation is needed to determine the mechanisms that lead to increases in CSA and EI following aerobic exercise, as we speculate there may be a different mechanism that lead one or both changing.
4.1. Practical Applications
- Ultrasound technology is a popular research tool, yet the scope and practice of using ultrasound imaging to differentiate intensities of exercise, muscle damage and glycogen depletions is not validated by research. EI has been correlated to muscle damage [11], intermuscular fat [2], connective tissue [3], and glycogen stores [8], however there is no conclusive evidence to what causes changes in EI and CSA following different bouts of exercise of any type. Therefore, for clinicians and researchers who use US imaging to determine recovery, return to play or muscle damage US imaging is only able to determine if exercise has occurred, it is not sensitive enough to determine at what intensity or duration the exercise was performed.
5. Conclusions
- The current study observed increases in CSA and EI muscle following different bouts of aerobic exercise, however EI was not able to identify the different exercise protocols. The authors conclude that US imaging is a not viable tool to gauge exercise intensity and different types of exercise illict different changes in CSA and EI. This was the first study to demonstrate that aerobic exercise alters CSA and EI after a single bout of exercise.