-
Paper Information
- Paper Submission
-
Journal Information
- About This Journal
- Editorial Board
- Current Issue
- Archive
- Author Guidelines
- Contact Us
International Journal of Sports Science
p-ISSN: 2169-8759 e-ISSN: 2169-8791
2018; 8(2): 43-49
doi:10.5923/j.sports.20180802.01

Comparative Analysis of the Performance of the Winning Teams of the Handball World Championship: Senior and Junior Levels
 Abstract
 Reference
 Full-Text PDF
 Full-text HTML
Willian Ferrari 1, 2, Vasco Vaz 1, Tiago Sousa 1, Micael Couceiro 1, 3, Gonçalo Dias 1
1Faculdade de Ciências do Desporto e Educação Física (FCDEF.UC/CIDAF), University of Coimbra, Portugal
2Doctor in the Program Capes, Brazil
3Ingeniarius, Ltd., Portugal
Correspondence to: Willian Ferrari , Faculdade de Ciências do Desporto e Educação Física (FCDEF.UC/CIDAF), University of Coimbra, Portugal.
| Email: |  |
This work is licensed under the Creative Commons Attribution International License (CC BY).
http://creativecommons.org/licenses/by/4.0/

This study aimed to perform a comparative analysis of the offensive behaviour and determinate a standard playing model for the National Team of France that won the World Championship of Handball in 2015, in both junior and senior categories. Results indicated a more significant number of Type I and Type II actions and a standard match equivalent level of performance between the two teams. This study showed that both teams have the levels of offensive actions, tendencies and game patterns very similar. However, the senior team has a more effective performance to end offensive actions.
Keywords: Handball, Interaction, Performance
Cite this paper: Willian Ferrari , Vasco Vaz , Tiago Sousa , Micael Couceiro , Gonçalo Dias , Comparative Analysis of the Performance of the Winning Teams of the Handball World Championship: Senior and Junior Levels, International Journal of Sports Science, Vol. 8 No. 2, 2018, pp. 43-49. doi: 10.5923/j.sports.20180802.01.
1. Introduction
- In team sports, in the broad sense, situations, routines, strategies and tactics occur, whose knowledge and understanding are essential to describe, interpret and analyze the collective behaviour [1], which is why coaches and researchers use the observation of players and teams to examine and study the game, in order to increase the process of sports preparation [2-4].Handball is endowed with high variability and unpredictability actions, where two teams act as nonlinear dynamical systems [5]. On this matter, it emerges the need to understand how players’ performance can contribute to attaining a higher scientific knowledge of the technical actions of this collective sport [6, 7].Performance analysis in handball includes the process of the match itself, contemplating objective indicators, like ball possession and the final result of an action (e.g., win or lose the match) [8, 9]. At this stage, it is equally important to consider the offensive and defensive efficiency and intra and inter-team actions that precede the goal [10, 11].From this perspective, is not simple to investigate the countless possibilities of actions and interactions that can emerge during a handball match. On this basis, patterns of complex individual performance emerge, that significantly change over space and time [9, 12].Thus, the analysis of the performance in handball requires, in its conceptual approach, a paradigm change, where the behaviours and actions of players in handball are determined by tactical action [7], thus allowing a better understanding of the performance in collective sports [2, 13, 14].During a handball match, the structure and dynamics of interactions may be considerably different depending on the characteristics and profile of the teams and players [15]. Also, some studies have deepened the performance indicators and trends that include measures of performance (actions of the players, such as passing and shooting) and product measurements the final result of the game, victory or defeat. [16, 17].Therefore, focusing on product measures (win or lose), Ferrari, Vaz [18] identified the game parameters that differentiate winning teams from losing teams. This study indicated significant differences between winning and losing teams, especially the goals that emerged in a positioned attack, but also the total number of shots and goals within the 7 meters’ penalty. For his part, studies, such as Gruić, Vuleta [16], Ohnjec, Vuleta [17], presented performance indicators obtained in professional teams that participated in the World Handball Championship 2003, in particular female [17] and male [16], through the analysis of the number of goals and assists verified throughout the competition, evidencing significant differences in the performance of men and women. In another perspective, authors, such as Fonseca [19], Leitão [20], Moreira and Tavares [21], indicated that most professional handball teams adopted the positional attack method. Sáez Blázquez, Roldán Romero [22], with the intent to verify statistically significant differences between winning and losing teams from Copa del Rey 2008, indicated that one of the factors influencing the winning team's success was the counter-attack goals. Also, Ferrari, Vaz [18], after analysing the EHF Champions League 2011/2012, found that the positional attack method was further explored by the winning teams. Sáez Blázquez, García Rubio [23] also found significant differences in the performance indicators between winning and losing teams at youth level. These authors concluded that this was more evident when both teams had a higher number of 6-meter goals scored. In parallel, Foreti, Rogulj [24], when analysing the men's World Championship Handball 2009, concluded that, on average, teams scored 2.7 goals from the 7 meters’. Bilge (2012), which analysed the Olympic Games (2004-2008), World Championships (2005-2007-2009) and European Handball Championships (2004-2006-2008-2010), obtained a more significant number of action per team (57.5 actions). Finally, Visnapuu [25] conducted a qualitative analysis of U18 teams participating in the European Tournament of Handball 2006, where concluded that the tactical strategies of senior teams and youth levels were very similar.Given state of the art, this study aimed to perform a comparative analysis of the offensive behaviour and determine the standard set for both junior and senior National Team of France participating in the Handball World Championship 2015. Thus, we analysis different types of actions performed by players for interpreting the performance behaviours of professional Handball teams.
2. Methodology
- Initially, the games of the winning teams were selected in the Men's World Handball Championship (Qatar 2015) and the Men's World Handball Championship (Brazil 2015). In a second phase, three games from the senior and junior teams in the final stages of the competition were analysed. The French Handball Federation made available the videos of the games.The variables analyzed in this study covered the types of actions performed by players. In that sense, a technical adaptation system already applied in Soccer [26] on collective actions, types: Type I) complete collective action (start, progression and finalization); Type II) incomplete collective actions (start, progression and loss of ball without finalization); and Type III) collective actions originated in a certain game situation (e.g., foul in favor), with short-term finalization of possibility. The analysis carried out by Falkowski and Enríquez [27] considered the total number of actions, the duration of these actions (time actions) and the total number of goals during the offensive phase, on the positioned attack, quick attack and counter-attack. Crosswise, goals have been analysed occurring at 6 meters, 6-9 meters, 9 meters and 7 meters from the goal, the interactions established between players; the average passes made, the fouls suffered by players, the turnovers and the assists.Likewise, this work adopts these variables like the ones that may be more representative of the matches. VideoObserver® was the instrument used for collecting all these variables. The statistical analysis was made with IBM SPSS. Additionally, Microsoft EXCEL was used to determine the tendency in the number of existing actions throughout the matches. In this sense, a linear function
 was adopted Mendes, Fuentes [28], defining thus a representative tendency of the number of actions of the observed games.The slope of the line, defined as
  , indicate whether this was an increasing or decreasing tendency, or if it was constant, thus allowing to analyse the performance of the respective teams and players over the three matches. In other words, with this tendency analysis one can observe an increased performance (m > 0), a decreased performance (m < 0), or a consistent performance over the three matches (m = 0).
3. Results
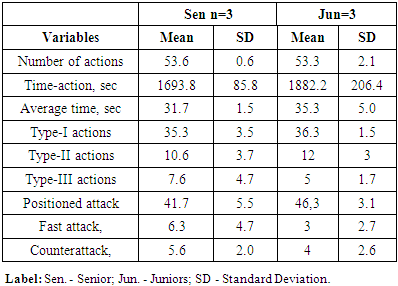
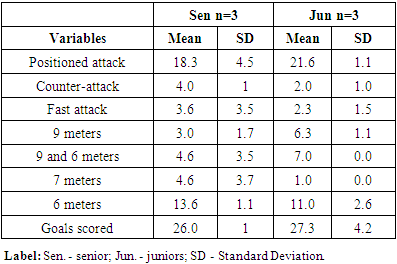
- The data were subdivided into 9 categories, as can be observed in Table 1, which is the descriptive statistics of the game actions.
|
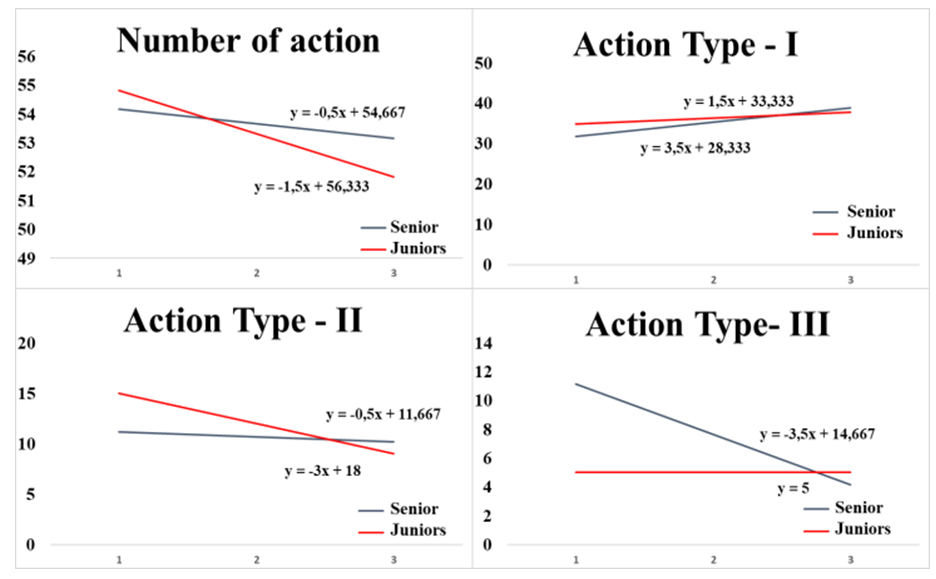 | Figure 1. Actions game of the two levels of performance and tendency lines |
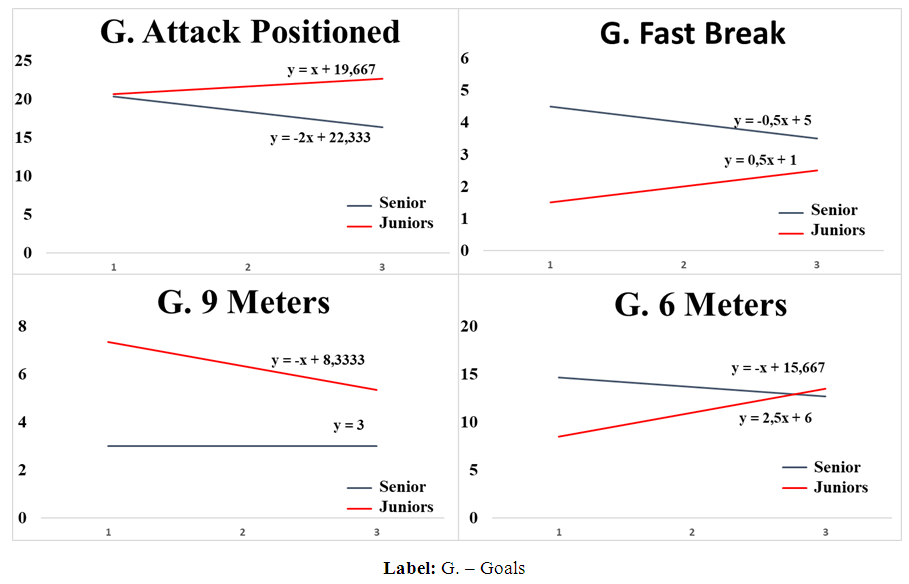 | Figure 2. Shows the goals scored at positional attack and the main tendency lines of performance |
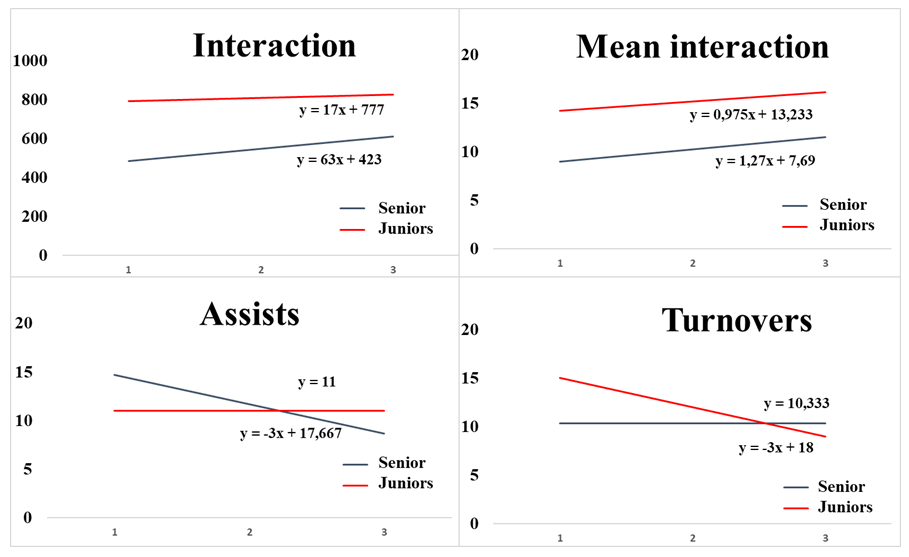 | Figure 3. Shows the main lines of tendencies resulting from the interactions established between players |
|
|
4. Discussion
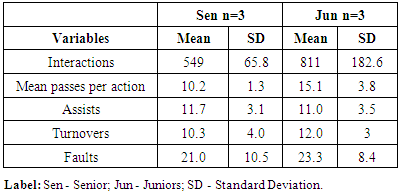
- This study aimed to perform a comparative analysis of the offensive behaviour and determinate a standard playing model for the National Team of France that won the World Championship of Handball in 2015, in both junior and senior levels. When we compared the data from our study with Gruić, Vuleta [16], Ohnjec, Vuleta [17], that presented performance indicators obtained in professional teams that participated in the World Championship of Handball 2003, we verified that these values are far higher than obtained in our study. In the studies of [16, 17] the winning teams scored 31.8 goals on average, while in our study the winning teams scored 26 goals (seniors) and 27.3 goals (juniors). This discrepancy on the results presented above can be explained by the fact that the same authors conducted their studies with a sample that encompassed all the World Cup games, where there was a significant difference in technical and tactical quality between winning and losing teams. The same applies to the number of assists made, where. Gruić, Vuleta [16] obtained 12 assists per game. In our study, the values obtained were 11.3 for seniors and 11 for juniors.On the other hand, our study reveals that the senior level had an average of 4 goals, while at junior level demonstrated two goals on counter-attacks. These values are different when compared to those presented to the winning teams by Gruić, Vuleta [16, 17], where the male winning teams scored an average of 5.9 goals.The results of this study are in the same line of those obtained by [19-21], Meletakos, Vagenas [29] which concluded that positional attack game method is the style of play most used by professional handball teams. Sáez Blázquez, Roldán Romero [22], analysing differences in performance between winning and losing teams throughout the Copa del Rey 2008, reported that one of the factors that contribute for the victory of a team are the goals scored on the counter-attack.The French senior team scored on average four goals in fast attack, while the junior team scored, on average, two goals on the counter-attack. Also, Ferrari, Vaz [18], analysing the games of the EHF Champions League 2011/2012, concluded that positional attack method of play was the most exploited method of winning teams. Moreover, Sáez Blázquez, García Rubio [23] revealed significant differences in performance indicators between winning and losing teams at youth level. These authors concluded that coaches should plan their strategies to finalise as close as possible to the goal. This factor is most evident when both teams have a more significant number of goals scored from the 6 meters’, while compared to positions more distant from the goal. Also, the results of this study show that the winning teams obtained their victories by a short goal difference. These data cannot be dissociated from the fact that we analysed games of the first knockout round, semi-final and final, where are the eight best teams from the tournament [23]. This study also showed that the analysed teams had on average very similar actions per game (e.g., 53.6 seniors and 53.3, juniors). Regarding the Type III actions, the data obtained in this study indicated that the senior team scored on average 4.6 from the 7 meters, which represents a higher value than what was presented by Foreti, Rogulj [24), 2.7 goals from the 7 meters, when analysing the men's World Championship in 2009.Furthermore, this study allows speculating that the use of collective tactical means may have a direct relationship with the completion of offensive sequences ended with or without a shot, being evident that this finalisation is supported mainly by individual initiatives Mortágua [30]. In that sense, Bilge [31], analysed the Olympic Games (2004-2008), World Championship (2005-2007-2009) and European Championship (2004-2006-2008-2010), and obtained a higher number of actions per team (57.5 actions). However, in this study, the senior team, who obtained 53.6 actions, presented a steep decline in performance compared to previous years. Gutiérrez A. [32], made a distinction between winning and losing teams of the Spanish League 2008-2009 and concluded that the winning teams scored on average 15.1 goals from the 6 meters and 3.3 goals from the 7 meters. Accordingly, with our study, the French teams scored on average 13.6 goals from the 6 meters and 4.6 from the 7 meters. Finally, Visnapuu [25] conducted a qualitative analysis of U18 teams participating in the European tournament of handball. He concluded that tactical strategies of both senior and youth teams were very similar. Accordingly, to this study, fast attack is little used by youth teams. Our study also corroborated this conclusion. The average of fast attacks, of the junior team, was 2.3.
5. Conclusions
- It is concluded that in the number and type of game actions both levels were equivalent, thereby obtaining average performance and tendency lines similar in Type I and Type II actions. In this case, we can speculate how type III actions differ due to a higher level of faster decision-making capacity and more effective decisions from the senior players’ in comparison with to the junior players’, as well as a greater competitive experience and a better technical and tactical understanding of the actions. Winning teams should have a specialist player to execute the 7 meters penalty in order to increase the probability of scoring and consequently winning the match. In relation, the goals scored by teams show a behavioural discrepancy between the groups. For the interactions established between players, the results showed proximity indicators. Although the average data is superior in numbers of actions for the junior team, the two levels showed similar ascending tendency line of performance during the competition. However, the average and standard deviation of the obtained data did not always exhibit a uniform size of these tendency lines, with a notable disparity between levels. Finally, in the same line of thought, this study showed that both teams have the levels of offensive actions, tendencies and game patterns very similar, however, the senior team has a more effective performanceto end offensive actions.