-
Paper Information
- Paper Submission
-
Journal Information
- About This Journal
- Editorial Board
- Current Issue
- Archive
- Author Guidelines
- Contact Us
International Journal of Sports Science
p-ISSN: 2169-8759 e-ISSN: 2169-8791
2017; 7(6): 233-238
doi:10.5923/j.sports.20170706.05

The Reliability of the Standing Long Jump in NCAA Track and Field Athletes
 Abstract
 Reference
 Full-Text PDF
 Full-text HTML
Corrina Reid, Marcus Dolan, Mark DeBeliso
Department of Kinesiology and Outdoor Recreation, Southern Utah University, Cedar City, UT, USA
Correspondence to: Marcus Dolan, Department of Kinesiology and Outdoor Recreation, Southern Utah University, Cedar City, UT, USA.
| Email: |  |
Copyright © 2017 Scientific & Academic Publishing. All Rights Reserved.
This work is licensed under the Creative Commons Attribution International License (CC BY).
http://creativecommons.org/licenses/by/4.0/

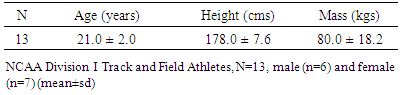
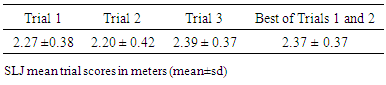
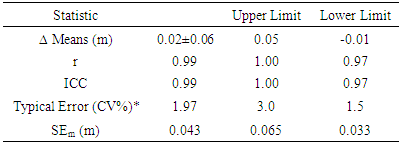
Many athletes require lower body power for their various sports, such as track and field athletes. When determining this particular attribute in track and field athletes, it is vital that the reliability of the test is determined for the particular athletic group so that coaches can monitor the training state of the athletes. PURPOSE: The purpose of this study was to determine the reliability of the standing long jump (SLJ) in NCAA track and field athletes. METHODS: Thirteen NCAA Division I track and field athletes (male n=6 and female n=7) (age: 21.0±2.0yrs, height: 178.0±7.6cm, mass: 80.0±18.2kg) participated in three trials of the SLJ. After completing a dynamic warm-up, the trials of the SLJ were executed. The athletes stayed warmed-up in between the trials, walking and jogging to keep moving, as is the nature of athletics. In completing the SLJ trials, the athletes performed a standard countermovement SLJ, and distance was measured from the starting line to where the rear heel was upon landing. In order to determine the reliability of the SLJ, the best of Trials 1 and 2, were compared to Trial 3 with: Pearson (PCC) and Intraclass Correlation Coefficients (ICC), SEm, ∆ Means, and CV%. RESULTS: The best of trial 1 and trial 2 SLJ scores were: 2.37±0.37m, while trial 3 scores were: 2.39±0.37m. The interclass reliability coefficient was r=0.99 (UL:1.00, LL:0.97). The intraclass reliability coefficient was ICC=0.99 (UL:1.00, LL:0.97). The Standard Error of Measurement (SEm) =0.04m (UL:0.07, LL:0.03). The ∆ Means= 0.02±0.06m (UL:0.05, LL:-0.01). The typical error CV% =1.97 (UL:3.0, LL:1.5). CONCLUSION: Within the parameters of this study, it was found that the SLJ is a highly reliable field test of horizontal muscular power for collegiate track and field athletes.
Keywords: Standing Long Jump, Reliability, Horizontal muscular power
Cite this paper: Corrina Reid, Marcus Dolan, Mark DeBeliso, The Reliability of the Standing Long Jump in NCAA Track and Field Athletes, International Journal of Sports Science, Vol. 7 No. 6, 2017, pp. 233-238. doi: 10.5923/j.sports.20170706.05.
Article Outline
1. Introduction
- Athletes rely heavily on lower body muscular power output as a vital attribute for competition, and is one of the main focuses of a strength and power training program for athletes [1]. Athletic performance is highly influenced by muscular power, and it is presumed that athletic performance in competition will improve as the lower body power increases. It is important to understand which testing methods are reliable for evaluating lower body power in order to develop a plan for the athlete’s strength and conditioning program. Only when accurately assessed physical characteristics are attained is a coach able to alter strength and conditioning program variables in order to optimize the training of an athlete.Validity and reliability are the two primary aspects when considering how to accurately assess (test or measure) a physical attribute such as lower body power. The reliability of a test needs to be examined and established prior to using the test for purpose of assessing a physical attribute. For specific athletic groups, it is more beneficial to use sport-specific tests to get a more realistic view for the application in that particular sport. It is further necessary to identify how many trials of a test are necessary for a reliable assessment so that the coaches can use time effectively and be confident that the assessed physical characteristics are reflective of the training state of the athletes.A common test for assessing lower body power output is the standing long jump (SLJ) test [1, 5, 9, 13]. The popularity of the SLJ is due to the fact that the SLJ is fairly easy to administer, can be used in various situations, and is relatively cost free. Horizontally testing the athlete’s SLJ can be done relatively anywhere with some type of measuring tape or yard stick and some chalk, whereas vertically testing an athlete’s jump could require a few hundred dollars’ worth of equipment [2]. Further, recent discussions regarding force vector training [10] suggest that the SLJ is a more specific assessment of axial anteroposterior loading than the vertical jump.Recent research findings regarding the reliability of the SLJ suggest that only three trials are needed for a reliable assessment to be achieved [2]. Given the recent concerns regarding reproducibility of research results [4], our research team concluded that it would be important to re-examine the results of the Ah Sue et al. [2] study and we view this study as a continuation of that work. The purpose of this study was to determine the reliability of the SLJ in NCAA track and field athletes.
2. Methods
2.1. Participants
- Volunteer NCAA Division I male and female track and field athletes from Utah Valley University participated in this study. Only those male and female athletes who participated in the shot put, and the decathlon for males and heptathlon for females were allowed the opportunity of participating as a volunteer for this study. All participants were free from injury during the time of the study, and ranged in age from 18-25 years. Every coach who was in some way associated with these track and field athletes granted permission before the athletes were asked to participate in this study. An Institutional Review Board approved the engagement of using human subjects in the research before the study was conducted. Each athlete also read and signed a written informed consent form that was presented to them before being allowed to participate in the study.
2.2. Instruments and Apparatus
- This study was conducted at the campus of Utah Valley University. The dynamic warm-ups and subsequent SLJ tests trials were done at the Hal Wing Track and Field Stadium. A measuring tape, blue masking tape to set up long jump marks, and a measuring stick were the pieces of equipment used in conducting this study.
2.3. Procedures
- The first session of the study was to orient the participants and record each participant’s age, height, and weight. The proper techniques for performing the SLJ were taught and reviewed, so each participant understood clearly what the procedures for this study would be. With that said, all of the athlete participants were familiar with the SLJ exercise.After this session of orientation for the participants, each athlete was then assembled to participate in the collection of the SLJ trials. The participants started with a dynamic warmup (WU) which consisted of nineteen exercises as previously used by Dolan et al [12] and described below.This dynamic WU was used for each participant and was in a fixed order for all, consisting of the following warmup activities: 5-minute moderate intensity stationary bike, 20 meter A-Skips, 20 meter lunges, 20 meter high knee bum kickers, 20 meter knee hugs, 20 meter B-skips, 20 meter side lunges (alternating left and right sides), 20 meter skips with arm swings, 20 meter glute walks, 20 meter leg sweeps (a hamstring warmup), 20 meter reverse lunges, 20 meter walking quad and hamstring stretch, 20 meter straight leg bounding, 5 regular pushups, 5 wide pushups, 5 narrow pushups, 10 leg swings (10 isolating hamstring/ground and 10 isolating adductors and glutes), 10 medium arm circles and 10 large arm circles.Following this dynamic WU an 8 minute period of rest was allotted to the participants. After this brief rest period, the participants then completed three trials of SLJs separated by 3-minute rest intervals. The SLJs were conducted as previously described (Figure 1) [2].
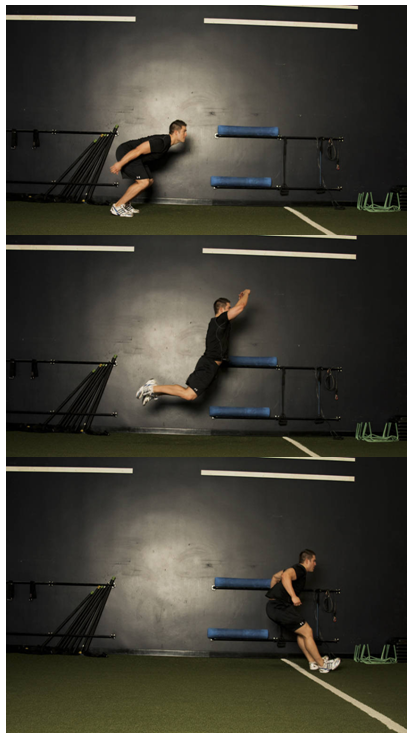 | Figure 1. Standing Long Jump. Image reprinted with permission from Bodybuilding.com (bodybuilding.com/exercises/standing-long-jump) |
2.4. Statistical Analysis
- There is debate over the most appropriate manner to calculate the reliability of a test [7, 8, 16, 17, 19]. As such, a number of statistical approaches were combined to determine reliability of the SLJ scores. Each trial score was examined, and trials one and two were combined, taking only the better score of the first two trials for comparison with the third trial scores in order to determine the reliability of the SLJ scores. The process initiated with examining the visual degree of linearity between trials (scatter plot). Next, the interclass (Pearson’s r) and intraclass reliability coefficients (ICC), the mean difference between trials, and the standard error of measurement (SEm) were calculated including 90% upper and lower limits (UL, LL). A Bland-Altman plot was also constructed in order to examine error uniformity. The coefficient of variation percent (CV%, UL, LL) was also expressed to examine the typical error from the log-transformed trial data. The statistical analysis was calculated in Microsoft Excel, using a spreadsheet prepared by Hopkins [15]. The spread sheet of SLJ trial data was peer reviewed for inaccuracies preceding statistical analysis as advocated by AlTarawneh and Thorne [3]. The statistical analysis strategy is essentially the same as that used in a number of prior reliability investigations [2, 11, 20, 21].
3. Results
- Thirteen NCAA Division I Track and Field athletes from participated in the study, six male, and seven female. The averages for age, height, and body mass of these participants are shown in Table 1. Each of the participants completed the three SLJ trials without injury or incident of any kind.
|
|
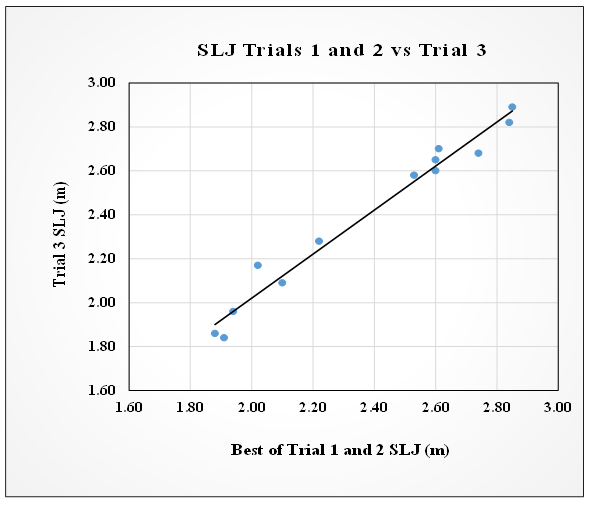 | Figure 2. Scatter Plot SLJ Trial 3 compared to the best of Trials 1 and 2 |
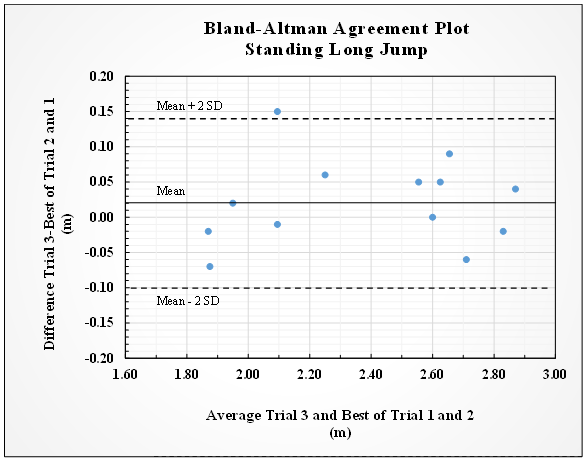 | Figure 3. Bland-Altman plot of SLJ scores |
|
4. Discussion
- The purpose of this study was two fold. First, to determine the reliability of the SLJ test in NCAA Division I track and field athletes in determining lower body power. Second, to confirm the results of a prior study by Ah Sue et al. [2] regarding the number of SLJ trials needed to establish a consistent SLJ score. The data collected from this study utilizing only 3 trials of SLJ scores suggested that the SLJ is a highly reliable test as every reliability metric examined suggested very high reliability.The SLJ scores collected during this study for females were 2.10±0.25 meters, which would be considered in the 25%ile for female elite athletes but considered excellent for female 15-16 year old athletes [14]. The SLJ scores collected during this this study for males were 2.65±0.11 meters; considered 40%ile for male elite athletes but considered excellent for 15-16 year old male athletes [14].The interclass reliability coefficient for this current study was r=0.99, which is much higher than test-retest reliability coefficients which have previously been reported for other physical performance tests that are commonly used [19]. It should further be notated that the lower limit of the 90% confidence interval for the interclass reliability coefficient for this current study is LL=0.97, which is considered to be very high [19]. For comparison, Au Sue et al. [2] reported an interclass reliability coefficient of r=0.88 (LL=0.61) for SLJ scores which is lower than that of the current study. The intraclass reliability coefficient for this present study is ICC=0.99, which is also higher than ICC’s that have been recorded in commonly used physical performance tests [6]. Likewise, it should be noted that the lower limit of the 90% confidence interval for the intraclass reliability coefficient for this current study is ICC LL=0.97, which is considered “above average acceptable” by some [6] or excellent by others [17]. It may also be important to note that there is an agreement between these current findings from this study and those of Markovic et al. [18]. Markovic et al. [18] had reported an ICC=0.93 for the SLJ in the sample of physically active college aged men. Similarly, Au Sue et al. [2] had reported an ICC=0.91 (LL=0.71) for SLJ in collegiate female volleyball players.The standard error of measure (SEm) is a measure of absolute reliability [8]. The SEm for this study indicates that when evaluating and measuring the SLJ as has been explained in this study, and for this group of people, that the true score is within ±0.04 meters (or 4.0 cms) of the score that was measured with 68% confidence. This suggests that were a coach to use the SLJ in order to measure the change in horizontal plane power output, then the score change must be more than 4.0 cms, or else the change in score could simply be indicate of measurement error. Au Sue et al. [2] similarly recorded a SEm of 3.95 cms for SLJ scores in a study group of female collegiate volleyball players. It is also important to note that when a non-uniform error is reflected in the scores (which was not the case in this current study), the SEm is biased, and may overestimate error in the lower scores of the trials, and underestimate the error for the higher scores of the data group. Although there was no apparent evidence in the data that suggested bias or non-uniformity of error, we choose to make a correction to the data to ensure that our reliability analysis was comprehensive.Hopkins [16] suggests log-transforming the scores and then expressing the error as ‘typical error’ or CV% in order to correct the non-uniformity of error in a data series. A CV% with 90% confidence limits represents a non-biased measure of error. This measure should be used when attempting to measure change in the SLJ scores, from this group of people, as a benchmark. The typical error or CV%=1.97 of the current study equates to 4.6 cms, nearly identical to the SEm of this study (SEm=4.3 cms). Because the CV% was nearly equal to the SEm, it is a confirmation for this study that the analyzed data collected from the trials was without bias and/or non-uniformity of error. Au Sue et al. [2] found similar results, noting a CV%=2.0 for the SLJ scores in a study group of female collegiate volleyball players.There was one perceived outlier score that we considered removing prior to statistically analyzing the data set. However, we chose not to eliminate the potential outlier score due to the limited number of participants, and thus the results presented in the previous section include the perceived outlier score. As a point of interest, the statistics were re-run without the outlier score in the data. The interclass correlation coefficient was r=0.99 (1.00, 0.98), and the intraclass correlation coefficient was ICC=0.99 (1.00, 0.98). Both of these coefficients were essentially unchanged in the removal of the outlier score, and confirms the initial statistical analysis as presented in previous section.The trials showed that of the thirteen participants, two had the best score for trial 1, two had the best score for trial 2, seven had the best for trial 3, one had the best score for trials 1 and 2 (as those scores were the same), and one had the best score for trials 2 and 3 (as those scores were the same). In other words, 54% of the participants improved the SLJ distance on the 3rd trial and 46% did not improve their SLJ score on the 3rd trials. Given the lack of a pattern of systematic change in SLJ scores across trials, it would seem that fatigue did not play a role in determining the trial scores. This also could indicate that the periods of rest between the different trials and the warm-up were sufficient to prepare the athletes without fatiguing the athletes, and these rests were of appropriate length.Those who participated in this study were NCAA Division I track and field athletes from Utah Valley University, and, as such, were trained athletes fairly familiar with the SLJ and the required mechanics to successfully execute the movement. The participants were physically mature and familiar with the test. It should be noted that these were track field athletes who compete in events that require training axial anteroposterior force output vectors [10]. Given that the SLJ is an axial anteroposterior movement (specificity), it may explain why the ICC’s reported in the current study are greater than those reported for previous studies of collegiate female volley ball players [2] and physically active college aged men [18]. For the future, studies should seek to include participants from different backgrounds, who are not the same age or gender, and have a different sport affiliation in order to gain the greatest feasibility of the use of the SLJ by practitioners.
5. Conclusions
- Given the parameters used in this study, the SLJ should be considered a highly reliable test of horizontal plane muscular power output that requires only 3 SLJ trials to establish a reliable maximal score. The SLJ is a test that can easily be administered to a variety of sports with a high degree of task specificity. It is recommended that strength and conditioning coaches, physical educators and athletes use this test as a measure of horizontal plane muscular power output.