-
Paper Information
- Previous Paper
- Paper Submission
-
Journal Information
- About This Journal
- Editorial Board
- Current Issue
- Archive
- Author Guidelines
- Contact Us
International Journal of Sports Science
p-ISSN: 2169-8759 e-ISSN: 2169-8791
2017; 7(3): 128-136
doi:10.5923/j.sports.20170703.06

Quantitative Analysis of Distances Covered by Professional Basketball Players According to the Movement Intensities
 Abstract
 Reference
 Full-Text PDF
 Full-text HTML
Anderson C. Junior, Milton S. Misuta, Luciano A. Mercadante
School of Applied Science, University of Campinas, Limeira, R. Pedro Zacharias, Brazil
Correspondence to: Anderson C. Junior, School of Applied Science, University of Campinas, Limeira, R. Pedro Zacharias, Brazil.
| Email: |  |
Copyright © 2017 Scientific & Academic Publishing. All Rights Reserved.
This work is licensed under the Creative Commons Attribution International License (CC BY).
http://creativecommons.org/licenses/by/4.0/

We aimed quantifying distances covered in several intensity categories, based on maximum sprint performed individually in court, during official basketball games. The sample consisted of 12 male professional players in six games. During active game clock, significant difference was found in distances covered only for Z4 intensity zone, with first quarter higher than the second and the fourth quarter, whereas Guards have presented higher values compared to forwards and centers in the Z2 and Z3 intensity zones. During stopped game clock, there was significantly differences among quarters in the Z2 and Z3 intensity zones, whereas guards covered a higher distance in Z1 intensity zone, when compared to forwards and centers. The Z3 intensity zone have presented significantly difference between guards and centers. The practical implications are: distances training in the moderate (21-60% of velpeak) and submaximal (61-80% of velpeak) intensity need to be differentiated individually by playing position. More attention is required to intensities that players are exposed during stoppage periods, not exceeding 20% of their individual maximum velocity. The third quarter are more likely to players to perform lower intensity activities during recovery. Provide special attention and guidelines to forwards and centers for their recovery during stopped game clock.
Keywords: Basketball players, Team Sport, Performance, Intensity demands
Cite this paper: Anderson C. Junior, Milton S. Misuta, Luciano A. Mercadante, Quantitative Analysis of Distances Covered by Professional Basketball Players According to the Movement Intensities, International Journal of Sports Science, Vol. 7 No. 3, 2017, pp. 128-136. doi: 10.5923/j.sports.20170703.06.
Article Outline
1. Introduction
- Basketball can be considered as a highly competitive team sport. Taking in consideration that being successful during competitions is the main objective for many professional of collective sport teams, the access to highly performance data from basketball players at these competitions is considered crucial. Given that the competitiveness has become increasingly greater each year, it is important to coaches and conditioning professionals give especial attention to many performance issues, including physical demands during play. Accordingly to Torres Ronda et al. [1], quantification of demands from games competitions might allow sport professionals to design better training methods, mainly developed in sport-specific conditions. For the physical demand quantification, the time motion analysis has been presented as the method often applied in literature, with many studies reporting how the physical requirements is imposed on basketball players from several levels and ages, for both genders [2-6]. Studies with time motion analysis stated that the physical demands in basketball is highly intermittent, given the great number of discrete movements and the change of movements categories every 2 seconds [2, 4, 6].Besides of frequency of movements, the time spent [5, 7, 8] percentage of active game clock [2, 6] and distances covered [7-10] in different movement categories was also parameters quantified with the objective to give further understanding on physical demands in basketball games. The quantification of distances covered by player is considered a more detailed data than frequencies and time duration of movements [7], which can provide further understanding in relation to the volume demanded from different movement intensities during a basketball game. Moreover, knowing the distances covered has allowed conditioning professionals to prescribe more specific training volume in according to what is required during a competition game.Previous researches had reported the distances covered by basketball players during game [3, 7-13]. These investigations have suggested also that distances covered in high intensity movement categories present a high variation between male basketball players, where means of distances covered ranged between 468-1029 and 192-592 m, during striding and sprinting movements, respectively [3]. There was also reported that the frequency of sprints distances covered were in its majority less than 10 m during a game [11] for elite Italian female players, during five games. Other previous investigations have approached female players in two [7] and eight [10] season matches, male players during five season games [8] and both genders in six season games [9]. These studies have provided more evidences about characteristics of distances covered among quarters, player’s level and genders, in different intensity categories. In relation to the differences among player’s levels, the findings suggest that more distances covered in high and low intensities categories is correlated to the low level players, whereas the distances tends to be more covered in moderate intensities, like jogging and running categories, as higher the level of players is [7]. The genders of players also have presented difference on their distances covered. According to study of Scanlan et al. [9], sub-elite male players performed more dibbling and less running displacements than sub-elite female players. On the other hand, distances related to live playing time have presented a similar value. Differences of total distances covered were found between Backcourts and Frontcourts positions in walk, run and dribbling categories [10], whereas distances covered among quarters in different playing levels [8] did not presented any significant difference, for any of intensity categories analyzed. In order to give a better understanding on the activities demands, the stopped game clock have been presented as important issue to the investigations of basketball intensity demands. Some studies have proposed the quantification of stopped game clock durations and found a considered relationship with the high intensity activities performed in basketball games [8, 14]. The authors have reported the way of recovery that players have during these periods have a significantly influence on the repeated high intensity movement performance, that is crucial for basketball games [2, 6, 8]. Although there is a large number of investigations proposed to quantify distances covered in many intensity categories, these categories are from movements patterns subjectively defined by operator and not individualized. Despite of studies where categories movement defined with velocity categories already exits [7-10], it criteria was based in a previous study with futsal players [15], where the velocities ranges are normally higher than the basketball players can perform. Besides that, when distances covered in many velocity ranges are quantified based on futsal criteria, maximal intensities categories in basketball may be underestimated due the difference of court area and the dynamic of competition which allow futsal players perform higher velocities. For a more precise quantification of distances covered, a previous study [7] have pointed that an individual categorization based on maximal sprint velocity is necessary for more precise efforts data. Although the movement speed in intensity categories based on individual maximal velocity has already reported in basketball matches [13], there is no studies related to quantification of distances covered by professional male players, based on maximal velocity performed in court. Certainly, information about the distances covered in individual intensities will give conditions for coaches and conditioning professionals to prescribe training volumes specified for both game and individual requirements. Moreover, would be also interesting provide information about the distance covered and its more predominant intensity during these moments, considering the stoppage situations as an increasingly interesting subject. Therefore, the present study aimed quantify distances covered in several intensity categories, according to the movement intensities performed individually on court, during official basketball games, in active game clock, stopped game clock and total time situations. The second aim is to verify whether there are differences in distances covered considering playing positions, quarters and halves, considering the individual intensity categories proposed.
2. Methodological Procedures
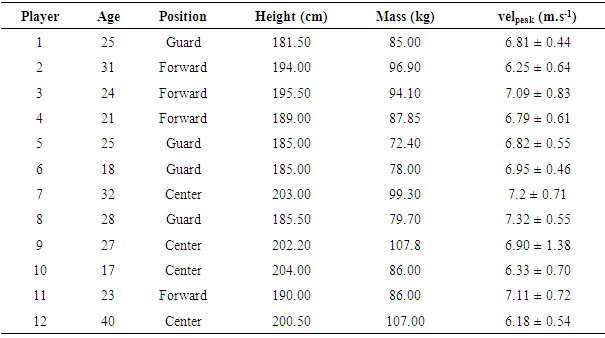
- 2.1 Experimental Design: A quantitative observational analysis was made to assess the distances covered of professional basketball players in different levels of intensity, based on their maximum velocity performed in each period of game. There was performed an intergroup analysis of data considering the playing position of the players.2.2 Participants of study: The sample consisted of 12 (4 guards, 4 forwards and 4 centers) male professional players (25.91± 6.37 years, 192.93 ± 8.04 cm, 90.00 ± 11.19 kg) from the first division of a Brazilian National Championship. There was analyzed six games, all played at home. The position and function of participants were considered following the information extracted at Brazilian National Championship’s official website. Ethics committee of university approved the research and all subjects involved gave their consent by signing their respective consent terms.2.3 Video recordings: The matches were filmed in team’s gymnasium, under conditions of artificial lighting. There was used four video digital cameras (JVC GZHD10, 30 Hz), positioned in the four upper corners of matches place, at a height of 12 meters, ensuring a good camera frame on each half court (two cameras for each half court). At the end of matches, the video recordings were stored in a personal computer and further converted to the AVI format and measured at a frequency of 7.5 Hz [16-18].2.4 Video calibration and synchronization: The DVideo System (Campinas, Brazil) was used for the proceedings of calibration, camera’s temporal synchronization, coordinates measurement and reconstruction of 2D tracks of players. The video recordings were calibrated using a 16 reference points system, with real coordinates values, defined in strategical points of basketball court (strategical lines intersection). The origin of global system was set in the intersection between one of the base lines with it respective side line. The temporal synchronization of cameras was made considering a common event in the match. The event determined was a change of the digit from ball possession time board, that was visible by the four cameras at the same time. This registration defined the frame correspondent to the beginning frame at its recording in all cameras. 2.5 Players Tracking: The players tracking was performed manually, using DVideo System. The coordinate point from each player was determined by the operator in each video frame. The position of basketball player in the screen was determined as the player’s center mass projection on the court. At the end of manual tracking, there was performed a Direct Linear Transformation (DLT) to obtain the values of player’s coordinates in real values. Followed the players tracking, the data obtained was passed through a smooth process. There was utilized a digital Butterworth filter of fourth order, with a cut frequency set in 0.2Hz. 2.6 Determination of distances covered and velocities ranges: Distances covered by players was obtained from the sum of distance covered between two successive frames, which was calculated by difference between two tracked position, which was separated in active game clock, stopped game clock and total time situations. Then, the distance data was divided by the time based on video frame rate (7.5 Hz), providing the instantaneous velocity in each frame recorded. The velocity ranges for each player were calculated based on the velocity peak performed in the game period. The velocity ranges determined the zones of intensity that players covered their distances, which were: Z1 (0-20% of velpeak), Z2 (21-40 % of velpeak), Z3 (41-60% % of velpeak), Z4 (61-80% % of velpeak) and Z5 (81-100% of velpeak), following the same procedures reported in previously study with Japanese basketball players [13]. Further, the distances covered were quantified in each category intensity which it was performed during game. To avoid discrepancies among values from player who had stayed on more and less time court, values of distances covered were normalized by the time on court for each player. The distances covered were normalized by the minutes that each player spent in court. Due the fact of players from some positions spent more time in court than others, the normalization will not allow that the time spent in court influence the difference among playing positions in their distance covered data.2.7 Statistical Analysis: The data are presented as mean and standard deviation for all measures. It was performed a Kolmogorov -Smirnov normality test with a Levene’s test for homogeneity of variance to determine the use of a parametric or nonparametric statistical analysis procedures. For active game clock, stopped game clock and total time situations, an ANOVA one-way test for parametric and a Kruskal-Wallis test for non-parametric samples was performed to verify differences of distances covered among quarters and playing positions. The post-hoc Bonferroni test was used to discriminate groups who presented significant different values. For analysis between halves, a T test and a Mann-Whitnney test was performed for parametric and non-parametric distance covered data, respectively.
3. Results
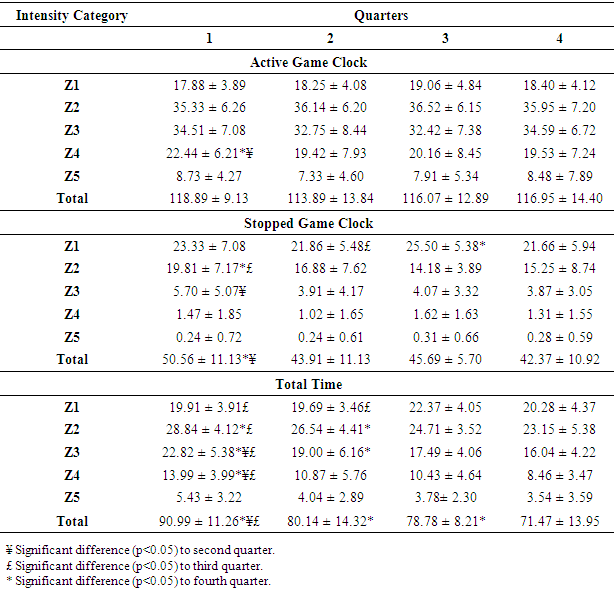
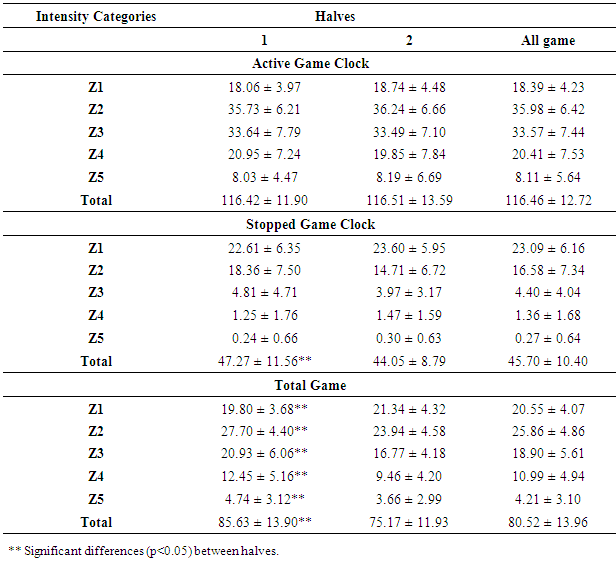
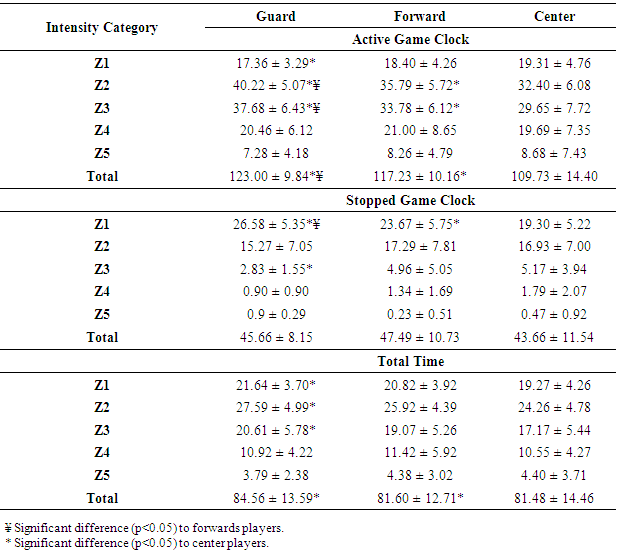
- In the table 1 is presented the characterization of participants who involved in study, as well as the mean of velocity peak achieved by each player in all quarters played. The table 2 shows the distances covered in each quarter and the table 3, during first and second halves, in all intensity categories. During the active game clock, there was found significant difference in distances covered only for Z4 intensity zone, where the means presented in first quarter (22.44 ± 6.21 m.m-1) was significantly higher than the second (19.42 ± 7.93 m.m-1) and the fourth quarter (19.53 ± 7.24 m.m-1). For the stopped game clock, there was significantly differences among quarters in the Z2 and Z3 intensity zones and the total distances covered. For distances covered in Z2 intensity zone, the first quarter presented a higher value (19.81 ± 7.17 m.m-1) than the third (14.18 ± 3.89 m.m-1) and fourth quarter (15.25 ± 8.74 m.m-1). For the distances covered in Z3 intensity zone, only the second quarter (3.91 ± 4.17 m.m-1) had a lower value than the first quarter (5.70 ± 5.07 m.m-1). For the total distances covered, the first half (50.56 ± 11.13 m.m-1) presented higher values than the second (43.91 ± 11.13 m.m-1) and fourth quarter (42.37 ± 10.92 m.m-1). The second half (44.05 ± 8.79 m.m-1) have also presented significantly lower values than the first half (47.27 ± 11.56 m.m-1) for distances covered regardless the intensity level. For total time situations, there was found significantly differences in Z1, Z2, Z3 and Z4 intensity levels and for total distances. Only the highest intensity category (Z5) did not presented difference. The halves also have presented differences in all intensity categories, including the total distance. The table 4 present the results of distances covered for each playing position (center, forward and guard). In the active game clock situations, in the Z2 and Z3 intensity zones and in total distances covered, guards have presented the higher values (40.22 ± 5.07, 37.68 ± 6.43 and 123.00 ± 9.84 m.m-1, respectively) compared to forwards (35.79 ± 5.72, 33.78 ± 6.12 and 117.23 ± 10.16 m.m-1, respectively) and centers (32.40 ± 6.08, 29.65 ± 7.72 and 109.73 ± 14.40 m.m-1, respectively), who had presented significantly lower values than forwards. For the Z1 intensity zone, only the guards had presented lower distances covered than centers (17.36 ± 3.29 vs 19.31 ± 4.76 m.m-1). The stopped game clock presented significantly differences in Z1 and Z3 intensity zone, where the guards covered a higher distance in Z1 intensity zone, when compared to forwards (23.67 ± 5.75 m.m-1) and centers (19.30 ± 5.22 m.m-1). The Z3 intensity zone have presented significantly difference between guards (2.83 ± 1.55 m.m-1) and centers (5.17 ± 3.94 m.m-1). The total time situation has presented differences in Z1, Z2 and Z3 intensity zones, besides of total distance covered. For those all intensity zones, only guards and centers presented significantly differences, having guards with the higher means (21.64 ± 3.70 vs 19.27 ± 4.26 m.m-1 for Z1, 27.59 ± 4.99 vs 24.26 ± 4.78 m.m-1 for Z2 and 20.61 ± 5.78 vs 17.17 ± 5.44 m.m-1 for Z4). For total distances category, the guars presented higher means than forwards (84.56 ± 13.59 vs 81.60 ± 12.71 m.m-1).
|
|
|
|
4. Discussion
- This is the first study with the purpose of quantify the distances covered by professional male players in several individual intensity categories. The results for playing positions reveals that during active game clock guards presents more overall distances covered than other two positions, suggesting a special attention to a prescription of a higher volume for this position compared to forwards and centers. When taking in consideration the individual intensity levels, the distances covered in moderate intensities were predominant for guards, whereas the forwards and centers have presented more distance covered in the lowest intensity zone. No significant differences were found for distances covered in the highest intensity level, which indicate that players in three positions are exposed to a similar demand of high intensity activity in individual conditions. For stopped game clock, there was found a considerably displacements in moderate intensities, suggesting an active recovery in movements higher than 20% of individual maximum velocity, which great differences among positions in the displacements under 20% of individual intensity, indicating fluctuations of behaviors among playing positions during recovery situations.
4.1. Distances Covered by Quarters and Halves
- Concerning on the activity demands among game quarters, some past studies have reported findings which suggest that the basketball game presents decrease of the higher intensity movement and, consequently, an increase of lower intensity activities [2, 8, 14], despite of there is some inconsistency found by other studies [4, 10]. These studies pointed the onset fatigue, the increase of stopped game clock periods and the change of movement patterns due the strategic changes the factors that slow down the game pace. This contributes to a decrease of high intensity activities and increase of low intensity activities at the last periods of the game. The results presented in this study show that as for active game clock as for total time there were a greater distance covered in Z4 intensity for the first quarter (22.44 ± 6.21 and 13.99 ± 3.99 m/min), compared to second (19.42 ± 7.93 and 10.87 ± 5.76 m/min) and fourth quarter (19.53 ± 7.24 and 8.46 ± 3.47 m/min). This result was in line to the previous studies that have reported the trend of basketball players perform more high intensity activities in first periods of game [2, 8, 14]. However, for the highest intensity (Z5), there was not found any difference among quarters during active game clock and total time, presenting a great inconsistency of distances covered in this intensity. The results of distance covered at active game clock suggest that there is a trend of decrease toward to last periods of game only for the submaximal efforts. There was found inconsistency of means found for distances covered in Z5 level at active game clock period. This is probably explained by the low frequency of sprints performed in the maximal intensity, due the predominance of more ball possession and half court situations, which is commonly found in games with high level of competition [2, 14]. At total time period, were also found lower mean of distances covered per minute in the highest intensity zones. Considering that the increase of time spent in stoppage periods decreases the distances covered by minute and that stopping periods is more likely to increase as the game progresses [6, 8, 14], it seems properly to state that higher frequency of timeouts and free-throws are the main factors that contribute to a lower distance covered at these intensities, during total time.The data regarding on distances covered in stopped game clock presented across game quarters shows that the lowest level of intensity provided the greater means of distance covered). It is important to highlight that the third quarter the players performed more distance in the lowest intensity (25,50 ± 5,38 m/min) than in the in others three quarters. This suggest that the players in the high competition level tend to perform their recovery more in lowest intensity during the third quarter. It is also important to consider that there are considerable distances covered at intensities greater than Z1 for all quarters of play, having the first quarter presenting the greater means. This evidence is important to conditioning coaches in the control of player’s behavior in the beginning of game in order to allow a better use of the recovery opportunities.
4.2. Distances Covered by Player’s Position
- The quantification of distances covered in intensity categories during active game clock presented in this study can provide to coaches and coaching staff relevant information about game demands without the influence of breaks and time outs, from stopped game clock [6]. It becomes more relevant considering the percentages of 35% total time performing low intensity movements and distances covered of 1720 ± 143 and 1870 ± 322 m in walking and jogging movements, respectively [3, 6]. During active game clock, distances covered by position presented the guards with more distances covered than forwards and centers, regardless the intensity level. The current results of total distances covered for guards (123.00 ± 9,84 m/min) and centers (109.73 ± 14.40 m/min) were lower than those of 132.2 ± 10.0 and 124.4 ± 2.0, reported for Australian male players [8], for backcourts and frontcourts, respectively. The criteria difference in determination of position might be one of the factor that probably may contributed to a lower mean, mainly when comparing the means of centers from our study to means from the frontcourt players, where was included forwards and centers together. Although fitness level, game’s structure and competitive level standard probably could also have contributed to this variation between studies, these differences in data highlights the importance of taking in account at least three positioning categories for application of positional specific conditioning training programs.Previously studies consider that different playing positions require specific intensity movement, where guards tends to perform more high intensity movements than forwards and centers [2]. However, the findings in the present study showed that guard players have presented more relative distance (40.22 ± 5.07 and 37.68 ± 6.43 m/min) covered in the intensities of Z2 and Z3 (21-40% and 41-60% of velpeak) than the forwards (35,79 ± 5,72 and 33,78 ± 6,12 m/min in Z2 and Z3, respectively), which were also higher than centers (32,40 ± 6,08 and 29,65 ± 7,72 m/min in Z2 and Z3 respectively). The data presented suggest that, although centers have presented greater distances covered in the lowest zone (0-20% velpeak), the distances covered by guards are more predominant in moderate intensities. This evidence suggests that the playing style for the professional Brazilian male players evolves many half court situations, where forwards and centers perform more tactical movements. In addition, fewer fast court transitions performed by guards during counter-attack movements may also have contributed to lower distance in high intensity activities [2]. Indeed, past studies had already suggested that elite level players perform more distances in jogging and running [7] and that a slower pace at the offensive movements is associated with a higher competitive level of basketball players [8, 19]. These evidences may explain the greater distances covered in moderate intensities found in the present study, since the sample investigated is from a national level basketball team.Distances covered in the highest intensities have presented low averages, with no difference among position analyzed (7,28 ± 4,18, 8,26 ± 4,79 and 8,68 ± 7,43 m/min, for guards, forwards and centers, respectively). This low distance in the highest intensity was already expected, since many studies have reported that besides of sprints and high intensity movement frequencies do not occur so frequently than those from lower intensities [2, 4, 6, 7, 10]. Besides that, only 5% of sprints duration last more than 4 seconds and more than 80% of sprints distances are performed up to 10 meters [10, 11]. These evidence associated with the lower mean of distances covered in highest intensity sustain the evidence that high intense efforts in basketball are very quickly, consisting basically of accelerations and decelerations in court [20].The total distances covered during total time ranged between 81.48 ± 14.46 and 84.56 ± 13.59 m/min. However, the distances covered in Z1 (19.27 ± 4.26 to 21.64 ± 3.70 m/min), Z2 (24.26 ± 4.78 to 27.59 ± 4.99 m/min) and Z3 (17.17 ± 5.44 to 20.61 ± 5.78 m/min) intensities zones was more performed when considering total time situations. Although the normalized values were not provided and neither categorized by individual intensity, the study with junior Tunisian players also reported higher distances covered during walking (1.72 ± 0.14 km), jogging 1.87±0.32 km, and running (0.93 ± 0.16 km) activities. When compared to the active game clock, the distances in all categories performed between 21-100% of velpeak was lower for total time than active game clock, except for the lowest zone (<20%). These differences suggest that the reduction is due the predominance of low intensity during stopped game clock. This indicate that stopped game clock has a great influence on distances covered among intensities during total time. Therefore, information about distances covered during total time need to be considered with caution when designing training programs based on these data. It is crucial taken in account that the distances covered in these situations are influenced by the great amount of distances performed in low intensity during the stopped game clock. In relation to the stopped game clock, the present study provides novel information regarding to the player’s distances covered during periods of free throws and time-outs. In the literature, many studies have given great importance to the periods of stopped game clock, considering that plays an important role for restoration of phosphocreatine and ATP used to perform high intensity activities, besides of provide a great reductions of fatigue and enhance the ability to perform repeated high intensity moments during the game [8, 21, 22]. The data presented in this study provide information about how much of distances and in which intensity players are performing during at a period where, at first, should be used for recovery. This will help conditioning coaches to give better guidelines to players about their actions during these opportunities in game.Considering all intensity levels, the distances covered during stoppage situations presented considerably values, ranging from 43.66 ± 11.54 to 47.49 ± 10.73 m/min. This result suggest that players presented a sustained displacement during moments of the game when movement was not required. Constant movements presented by players indicate a high amount of active recovery performed during stopped game clock. Taking into account that studies consider a passive recovery composed mainly with standing and siting situations [8] the most efficient way of energy replacement to perform more high intensity activities [23], the high means of distances covered suggests that conditioning coaches should give more attention to the actions performed by professional male players during stoppage periods and insure that players do not perform intense actions as during games as during physical training sessions.Specially to playing positions, the results shows that distance covered is very different among guards, forwards and centers. Although the means of total distance covered seemed similar among positions, it is interesting to note that there was a great difference of distances covered among positions in lowest intensity. It was expected that at stoppage situations players to cover a similar distance in this zone, due the fact that there is no displacement required from the game. However, a significantly higher distance covered was found for guards (26.58 ± 5.35 m/min), compared to forwards (23.67 ± 5.75 m/min) and centers (19.30 ± 5.22 m/min) in Z1 intensity zone. Besides of a higher mean of distances covered at low intensity movements than centers and forwards, there was also found a lower mean distance in moderate (Z2 and Z3) intensity zones for guards (15.27 ± 7.05 and 2.83 ± 1.55 m/min) than for forwards (17.29 ± 7.81 and 4.96 ± 5.05 m/min) and centers (16.93 ± 7.00 and 5.17 ± 3.94 m/min). These differences give support to the evidence that guards are more likely to recovery from high intensity activity during stopped game clock.
5. Conclusions
- When considering the distances covered in individual intensities, the findings from the present study provided practical implications regarding on: (1) Distances training in the moderate (21-60% of velpeak) and submaximal (61-80% of velpeak) intensity need to be differentiated individually by playing position. (2) Special differentiation on the distances volume is not needed in individual maximal intensity (>80% velpeak). (3) More attention is required to the intensities that players are exposed during stoppage periods, not exceeding 20% of their individual maximum velocity. (4) The third quarter are more likely to players to perform lower intensity activities during recovery (5) Provide special attention and guidelines to forwards and centers for their recovery, considering that were the guards the position with more trend to perform recovery in the lowest range of velocity.
ACKNOWLEDGEMENTS
- We would like to thank to Associação Limeirense de Basquete and Liga Nacional de Basquete, including its support staff and athletes, who had been always available and helpful during the research. We also thanks to CAPES for the financial support.