-
Paper Information
- Next Paper
- Paper Submission
-
Journal Information
- About This Journal
- Editorial Board
- Current Issue
- Archive
- Author Guidelines
- Contact Us
International Journal of Sports Science
p-ISSN: 2169-8759 e-ISSN: 2169-8791
2017; 7(2): 66-72
doi:10.5923/j.sports.20170702.07

Correlation Profiles between Lower Extremity Net Joint Torques and Whole Body Power during the Power Clean
 Abstract
 Reference
 Full-Text PDF
 Full-text HTML
Sangwoo Lee1, Kyle DeRosia1, Landon Lamie1, Nicholas Levine2
1Department of Human Performance and Health Education, Western Michigan University, Kalamazoo, Michigan, USA
2Department of Kinesiology, Texas Woman’s University, Denton, Texas, USA
Correspondence to: Sangwoo Lee, Department of Human Performance and Health Education, Western Michigan University, Kalamazoo, Michigan, USA.
| Email: |  |
Copyright © 2017 Scientific & Academic Publishing. All Rights Reserved.
This work is licensed under the Creative Commons Attribution International License (CC BY).
http://creativecommons.org/licenses/by/4.0/

A potential correlation between joint kinetics and power output exists during the power clean. This study investigated correlations between lower extremity (hip, knee, and ankle) net joint torques (NJT) and whole body power (WBP) during the power clean. Ten weightlifters (five males and five females) performed five trials of the power clean with 60% of one repetition maximum. Peak NJT and WBP values were extracted through a three-dimensional motion analysis. Pearson correlation coefficients were obtained to observe possible correlations. Multiple-regression (stepwise) analysis was also conducted to identify the best predictor of WBP during the power clean with the hip, knee, and ankle NJT being the independent variables. It appeared that hip and knee NJT showed significant positive correlations with WBP (r = .29 - .33, p < .05), but no significant inter-correlation was observed among lower extremity NJT. Knee NJT appeared to the best predictor of WBP during the power clean, followed by hip NJT. Practically, this study suggested that the developments of hip and knee extensor muscle action would help weightlifters improve WBP during the power clean.
Keywords: Weightlifting, Biomechanics, Joint kinetics
Cite this paper: Sangwoo Lee, Kyle DeRosia, Landon Lamie, Nicholas Levine, Correlation Profiles between Lower Extremity Net Joint Torques and Whole Body Power during the Power Clean, International Journal of Sports Science, Vol. 7 No. 2, 2017, pp. 66-72. doi: 10.5923/j.sports.20170702.07.
Article Outline
1. Introduction
- The power clean (PC) is a bilateral weightlifting technique that generates explosive power output by vertically accelerating a heavy load as quickly as possible [1]. The PC is often utilized in strength and conditioning training programs as an important part of power enhancement training for athletes. Several studies analyzed the PC movement by investigating especially how individuals generated power during the PC with different conditions, such as different starting positions, loads, and pull techniques [2-6]. Most studies primarily focused on determining an optimal load generating maximum power and identifying the timing of maximum power occurrence during the PC. For example, the effects of different loads on power output during the PC were examined, and it was shown that lifters generated peak power when performing the PC with 60-80% of their maximum load and the maximum power output was observed in the second pull phase (from when the bar reaches approximately mid-thigh to when the hips and knees become the complete extension). Previous studies also examined power and rate of force development during variations of the PC, including normal power clean, hang power clean, and mid-thigh power clean [6-8].Power is the mechanical quantity defined as the rate of work and calculated as the product of force and velocity. Four different approaches were used to calculate power during the PC in previous studies [4, 9-11]: 1) barbell power calculated by the product of the barbell force (barbell mass × barbell acceleration + barbell weight) and barbell velocity, 2) whole body power (WBP; barbell + body) calculated by the product of ground reaction force (GRF) and whole body velocity calculated from GRF based on the relationship between impulse and momentum (forward dynamics approach), 3) WBP calculated by the product of whole body force (whole body mass × barbell acceleration + whole body weight) and barbell velocity, and 4) WBP calculated by the product of GRF and barbell velocity. Hori et al. [12] compared these different approaches and reported that there were significant differences in peak power between the method 1 and the methods 2), 3), and 4) due to a discrepancy in peak force calculation (i.e. barbell force vs. whole body force). Significant differences in peak power were also observed between the method 2) and methods 3) and 4) because of a difference in peak velocity calculation (i.e. whole body velocity vs. barbell velocity). Therefore, the previous study suggested that as a practical application, it is important to understand the characteristics of each power output calculation and use the most appropriate method according to the nature of the study. A critical review of literature on power generation during the PC elicits one observation. The WBP can be significantly related to lower extremity joint kinetics during the PC. It is because a primary movement during the pull phase of the PC is the deadlift that involves all lower body joints simultaneously moving against a resistance [6]. Thus, it is highly likely that the main source of WBP generated during the PC may be attributed to the lower extremity net joint torques (NJT). Two studies investigated lower extremity biomechanics during the PC [5, 13]. The first study [5] examined the effects of different loads on lower extremity biomechanics during the PC and the results suggested that lower extremity joint powers and NJT varied across joints and loads during the PC. The second study [13] investigated the percentage of each lower extremity joint work compared to total lower extremity work and NJT during the PC and reported that work performed at the knee was the greatest contributor to the total lower extremity work with the largest NJT generated. These studies, however, focused only on lower extremity biomechanics and did not explicitly explain whether lower extremity NJT are correlated to power generation during the PC. Therefore, potential correlations between lower extremity NJT and WBP during the PC needs to be scrutinized.In spite of its potential correlations, there is a paucity of research investigation on the correlations. It may be due to a methodological limitation in calculating WBP and lower extremity NJT simultaneously. To measure WBP during the PC, for example, lifters performed the PC on a single forceplate with both feet on it to obtain overall GRF, and WBP was then calculated by the product of the overall GRF and either bar or whole body velocity [2-4, 6, 10, 11]. In order to calculate each lower extremity NJT, however, GRF needs to be independently collected from two forceplates with each foot on each forceplate. The limitation can be overcome by collecting overall GRF from both feet and independent GRF from each foot simultaneously. Therefore, the purposes of this study were 1) to investigate the relationship between lower extremity NJT and WBP and 2) to identify how well each lower extremity NJT predicted WBP during the PC. It was hypothesized that lower extremity NJT would significantly correlate with WBP during the PC and the knee NJT would be the best predictor of WBP during the PC, followed by the hip NJT and the ankle NJT.
2. Methods
2.1. Subjects
- A total of ten experienced weightlifters participated in this study. The mean (± SD) age, mass, height of the subjects, and PC experience were 26 ± 4.2 years, 78.2 ± 14.7 kg, 172.5 ± 10.4 cm, and 2.8 ± 1.0 years, respectively. Five males and five females were recruited to eliminate the influence of sex-induced homogeneity. The inclusion criteria were 1) prior PC experience of at least three years, 2) no lower extremity joint or lower back injury history at least twelve months prior to this study, and 3) ability to perform the PC with appropriate PC posture. Prior to the initiation of the study, the subjects were informed of the purposes of this study and asked to sign an informed consent form approved by the University’s Institutional Review Board.
2.2. Trial Conditions
- Before collecting data, all subjects performed special stretch primarily developed for the PC technique, including elbow stretch and bar on the knees stretch [14]. Subjects also performed a warm-up with nine PC trials that included three trials with a weighted bar (20.4 kg) only, with 30% of one repetition maximum (1RM), and with 60% of 1RM. Each subject’s 1RM of the PC was determined one week before the day of data collection using a 1RM testing protocol developed by the National Strength & Conditioning Association [15], and 60% of 1RM was used for testing according to a previous study [2]. Subjects performed a total of five trials for PC testing and were instructed to execute the PC as powerfully as possible for every trial. Subjects were given at least two-minute rest between trials to minimize fatigue. All the subjects wore Olympic weightlifting shoes during the test.
2.3. Experimental Setup
- A 200-Hz six-camera VICON motion capture system (Model Bonita 3 and 10; VICON, Centennial, CO, USA) was used to collect three-dimensional (3D) coordinates of retro-reflective markers. A total of fifty-nine markers were placed on the subject’s anatomical landmarks for motion capture. A static T-pose trial was initially captured with all the markers placed, and a group of secondary points (including thirteen joint centers) were additionally computed based on the captured markers to facilitate analysis. A group of markers were then removed in the motion trials for non-obstructed PC performance. The static T-pose trial was combined with the motion trials to locate the markers removed in the motion trials.Two AMTI forceplates (Model Optima; Advanced Mechanical Technology, Inc., Watertown, MA, USA) were used to collect ground reaction force (GRF) data at a sampling frequency of 1000-Hz and each foot was placed on each forceplate during the PC. Subjects oriented in the direction of the positive X-axis of the laboratory reference frame (global reference frame). The positive Y-axis pointed leftward perpendicular to the X-axis. The positive Z-axis was vertical.
2.4. Data Processing and Analysis
- The collected PC trials and the GRF data were initially processed on VICON Nexus to obtain data files in C3D format. The C3D files were then imported into Kwon3D Motion Analysis Suite (Version XP; Visol Inc., Seoul, Korea) for subsequent data processing and analysis. The raw 3D coordinates were filtered using a Butterworth zero phase-lag fourth-order low-pass filter with a cut-off frequency of 6-Hz to eliminate experimental errors.Sixteen segmental reference frames (pelvis, abdomen, chest, thighs, shanks, feet, upper arms, forearms, hands, and head) attached on each body segment were defined using the captured makers for calculating subsequent data. The X-, Y-, and Z-axis of the segments were aligned with the mediolateral, anteroposterior, and longitudinal axes of the segments, respectively. To define the segmental reference frames, an anatomical plane was initially defined using two axes (X axis and temporary Y axis). The Z axis was then defined by taking the cross product of the unit vectors of the X and temporary Y axes. The true Y axis was lastly determined by taking the cross product of the unit vectors of the X and Z axes. The body segment parameters reported by de Leva [16] were employed in computing NJT of the lower extremity joints and whole body center-of-mass (CM). An inverse dynamics procedure using the joint coordinate system proposed by Grood and Suntay [17] was used to extract the NJT, and the whole body CM was calculated using the segmental method [18]. The GRF and computed NJT were normalized to total mass including body mass plus barbell mass. The combined GRF parameters including the X, Y, Z component of the combined GRF and center-of-pressure (CP) were computed as following (Figure 1):
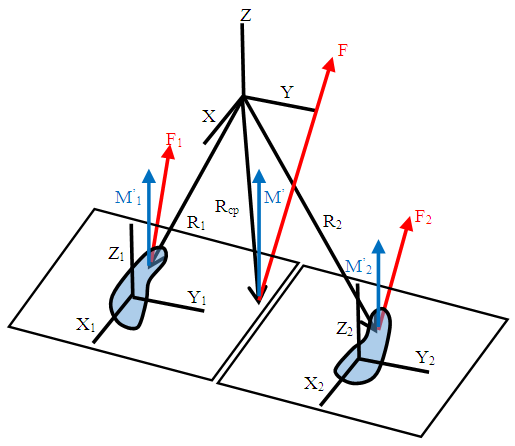 | Figure 1. A diagram illustrating combined GRF and independent GRF |
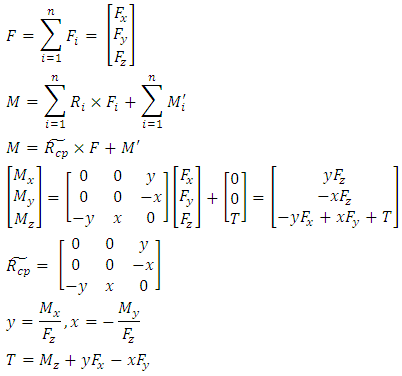 where F is the combined GRF, Fi is the GRF of the plate i, (Fx, Fy, Fz) are the components (anteroposterior, mediolateral, and vertical) of the combined GRF, M is the resultant torque about the global origin, Ri is the global position of the CP of the plate i, Mi' is the torque of the plate i about its CP (equal to the free vertical torque), Rcp ̃ is the skew-symmetric form of the combined CP, M' is the resultant torque of the combined GRF about the combined CP, (Mx, My, Mz) are the components (anteroposterior, mediolateral, and vertical) of the resultant torque about the global origin, and T is the resultant free vertical torque, (x and y) are the positions of the combined CP.WBP was then calculated by the product of the combined vertical GRF and whole body CM vertical velocity, and peak WBP was used for data analysis. NJT values extracted from the GRF dominant side of the leg were used for data analysis [19]. In terms of lower extremity NJT, only positive peak values of NJT indicating the hip and knee extensor and ankle plantar flexor torques were extracted for data analysis. Although 3D motion analysis conducted in this study generated variables in all three planes, only sagittal-plane NJT were analyzed because the PC primarily involves muscle actions in the sagittal-plane.To facilitate data analysis, the PC was divided into four phases using five events defined using the whole body CM vertical velocity and vertical GRF (Figure 2). Bar Off (BO) was when the bar was off the floor, Transition 1 (TR1) was when the whole body CM vertical velocity started decelerating, Transition 2 (TR2) was when the whole body CM vertical velocity started accelerating, Peak Velocity (PV) was when the whole body CM vertical velocity became peak, and Toe off (TO) was when the subject’s foot was off the forceplate. Four phases were then defined: initial-pull (IP: BO to TR1), power-preparation (PP: TR1 to TR2), power-generation (PG: TR2 to PV), and bar-throw (BT: PV to TO).
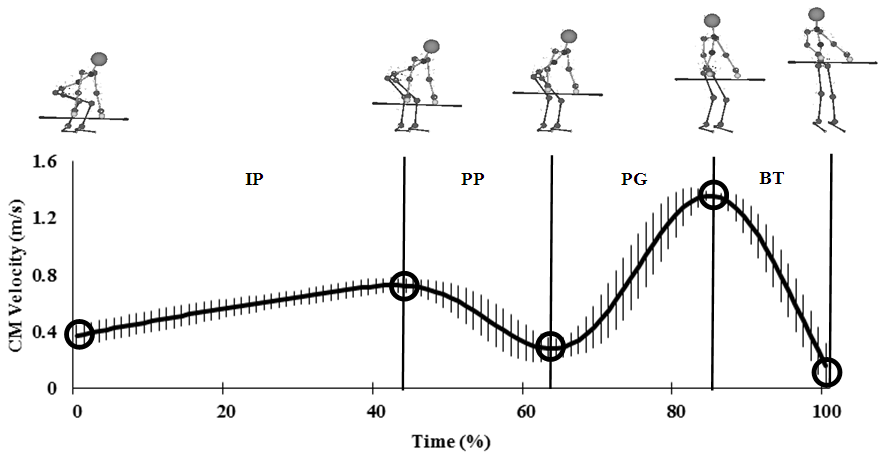 | Figure 2. Five events and four phases defined using time-normalized whole body CM vertical velocity |
2.5. Statistical Analysis
- Before collecting data Pearson correlation coefficients were obtained to observe the relationships between lower extremity NJT (hip, knee, and ankle) and WBP. To identify how well each joint NJT predicted WBP, multiple-regression (stepwise) analysis was conducted with the peak hip, knee, and ankle NJT being the independent variables [20]. As the focus of the study was on the relationship between lower extremity NJT and WBP, five repeated trials were treated independently. Statistical analyses were conducted using IBM SPSS Statistics version 24 (IBM, New York) with the α level set at .05.Before running the multiple-regression analysis, multivariate outliers for the independent variables were first checked for data screening using Mahalanobis distance [21] and the critical value of χ2. Degree of freedom against appropriate χ2 value was three (number of independent variables) at p = .01. Several statistical assumptions including multicollinearity, homoscedasticity, independent errors, normally distributed errors, and linearity were also checked using variance-inflation-factor values (1.00 for all significant independent variables), Durbin-Watson test (.558 for all significant regression models), standard residual plot, histogram, and normal probability plot [20].
3. Results
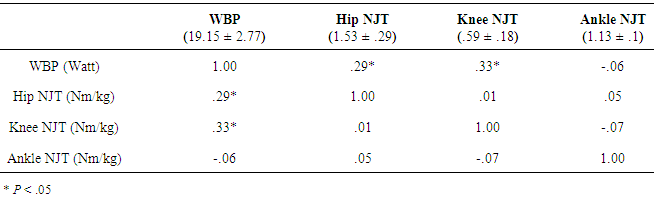
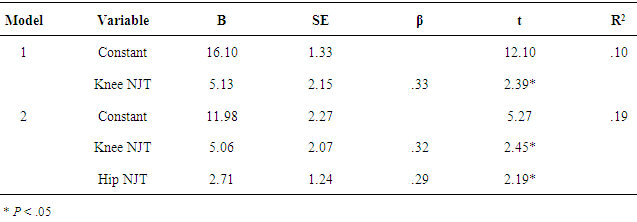
- The averaged peak WBP and hip, knee, and ankle NJT values (± SD) were presented (Table 1). The greatest averaged peak NJT value was observed in the hip, followed by the ankle and the knee. Hip and knee NJT showed significant positive correlations with WBP (r = .29 - .33, p < .05; Table 1), but no significant intercorrelation was observed among lower extremity NJT. Both hip and knee NJT were identified as significant predictors of PC performance with up to 19% of the variance in WBP explained, and knee NJT appeared to the best predictor of WBP during the PC, followed by hip NJT (Table 2).
|
|
4. Discussion
- In this study, peak lower extremity NJT were selected as biomechanical variables to investigate the correlation profiles between lower extremity NJT and WBP during the PC because those have been primary biomechanical variables in previous PC studies. [1, 5, 13]. This study also believed that WBP was more applicable than barbell power based on the purpose of this study. The averaged peak WBP and hip, knee, and ankle NJT values were observed in the PG phase, which means that subjects strived for exerting maximum lower extremity NJT and power output during the PG phase. Hip NJT was the greatest, followed by ankle and knee NJT (Table 1). These results were consistent with a previous study indicating the same NJT results occurring in the second pull phase [5]. But, the results were not in line with another previous study [13] showing knee NJT was the greatest, followed by hip and ankle NJT. The current study analyzed the pull phase (between IP and TO), while the previous study analyzed the catch phase (between initial contact after toe off and peak knee flexion). A NJT generation strategy would vary with different phases during the PC. For example, the lower extremity joints would mechanically function to maximize power during the pull phase; however, the joint would mechanically work to safely catch the bar and to stabilize the catch motion during the catch phase. The discrepancies, therefore, were likely to be driven by the different phases of motion analyzed in the two studies. In the interpretation of correlation profiles between lower extremity NJT and WBP, hip and knee NJT showed significant positive correlations with WBP and were also characterized as significant predictors of WBP during the PC (Table 1 & 2). Although the smallest average NJT value was observed in the knee joint, knee NJT appeared to the best predictor of WBP during the PC, followed by hip NJT. It could be, therefore, suggested that the developments of hip and knee extensor muscle action would help weightlifters improve WBP during the PC. Despite the fact that average ankle NJT value was greater than knee NJT, it did not appear to be a significant predictor of WBP during the PC. It might be attributable to the fact that ankle NJT data points were primarily vertically distributed, even with a slight negative relation with WBP (Figure 3). Since high ankle NJT was produced during the PC, however, it would be beneficial for weightlifters to practice training drills that allow them to utilize ankle NJT for power enhancement during the PC.
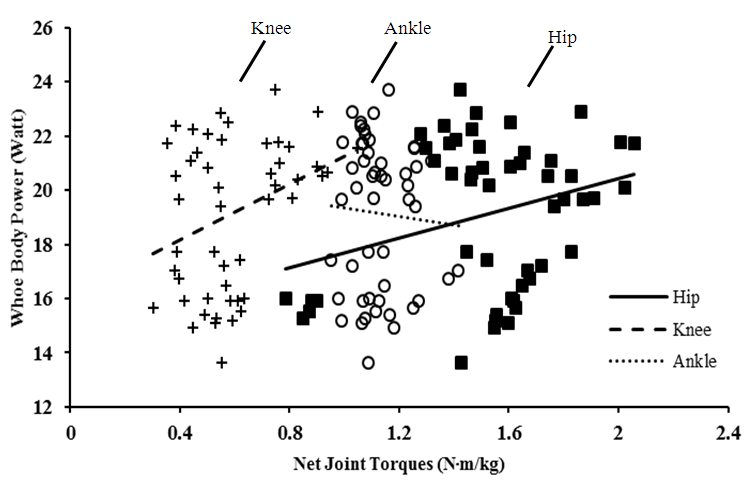 | Figure 3. A scatter plot of the WBP versus hip, knee, and ankle NJT. Linear trend lines of hip and knee NJT are also presented |
5. Conclusions
- Hip and knee NJT were characterized by significant positive correlations with WBP during the PC. Hip and knee NJT also appeared to be significant predictors of WBP during the PC. However, the findings of this study should be applied with caution when individuals perform the PC with different amount of weight from 60% of 1RM and different levels of PC experience, especially with less than three years.
ACKNOWLEDGEMENTS
- Authors would like to thank Erin Carlson and Zachary Parsons for recruiting subjects and sharing their practical experiences of weightlifting.