-
Paper Information
- Next Paper
- Paper Submission
-
Journal Information
- About This Journal
- Editorial Board
- Current Issue
- Archive
- Author Guidelines
- Contact Us
International Journal of Sports Science
p-ISSN: 2169-8759 e-ISSN: 2169-8791
2017; 7(1): 1-5
doi:10.5923/j.sports.20170701.01

Determination of Trials Needed for Measurement Consistency of Standing Long Jump in Female Collegiate Volleyball Athletes: A Brief Report
 Abstract
 Reference
 Full-Text PDF
 Full-text HTML
Robert Ah Sue1, Chad Harris2, Joseph Berning3, Trish Sevene4, Kent J. Adams4, Mark DeBeliso1
1Department of Physical Education and Human Performance, Southern Utah University, Cedar City, UT, USA
2College of Professional Studies, Metropolitan State University of Denver, Denver, CO, USA
3Department of Kinesiology and Dance, New Mexico State University, Las Cruces, NM, USA
4Kinesiology Department, California State University Monterey Bay, Seaside, CA, USA
Correspondence to: Mark DeBeliso, Department of Physical Education and Human Performance, Southern Utah University, Cedar City, UT, USA.
| Email: |  |
Copyright © 2017 Scientific & Academic Publishing. All Rights Reserved.
This work is licensed under the Creative Commons Attribution International License (CC BY).
http://creativecommons.org/licenses/by/4.0/

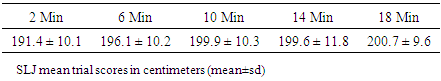
Lower body power is an important physical attribute of competitive volleyball athletes. In order to assess such an attribute, it is important that the test reliability be established using a sport specific physical test and a participant pool consisting of competitive athletes. Furthermore, identification of the appropriate number of trials to use during assessment insures accuracy of scores and time efficiency for coaches. PURPOSE: The aim of this investigation was to establish the minimum number of trials needed for reliability of the standing long jump (SLJ) in female collegiate volleyball players. METHODS: Nine female athletes (age: 18.3±0.5yrs, height: 179.2±5.3cm, mass: 68.8±7.9kg) completed five trials of a SLJ. Jumps were performed at 2, 6, 10, 14 and 18 minutes following a dynamic warm-up. In an attempt to simulate the active nature of sport, the athletes alternated between walking and jogging the length of a basketball court between successive trials. For the SLJ, subjects performed a standard countermovement SLJ and distance in centimeters was measured from the starting line to the rear-most heel upon landing. Pearson (PCC) and Intraclass (ICC) Correlation Coefficients were calculated between successive trials. RESULTS: Means for the for the successive trials were as follows: Trial 1: 191.4±10.1cm; Trial 2: 196.1±10.2cm; Trial 3: 199.9±10.3; Trial 4: 199.6±11.8cm; Trial 5: 200.7±9.6cm. Mean difference between successive trials (i.e. Trials 2 to 1, 3 to 2, 4 to 3 and 5 to 4) were; 4.8±6.9, 3.8±5.5, -0.3±5.6 and 1.1±5.4 (cms). PCC and ICC for successive trials were: 0.77 and 0.82; 0.86 and 0.89; 0.88 and 0.91; 0.89 and 0.91. CONCLUSIONS: Given the parameters of this study, the SLJ is a reliable field test of horizontal muscular power output and adequate assessment of SLJ performance is achieved using three trials.
Keywords: Broad jump, Reliability, Horizontal plane power output
Cite this paper: Robert Ah Sue, Chad Harris, Joseph Berning, Trish Sevene, Kent J. Adams, Mark DeBeliso, Determination of Trials Needed for Measurement Consistency of Standing Long Jump in Female Collegiate Volleyball Athletes: A Brief Report, International Journal of Sports Science, Vol. 7 No. 1, 2017, pp. 1-5. doi: 10.5923/j.sports.20170701.01.
Article Outline
1. Introduction
- Lower body power is an important attribute of competitive athletes, and is the focus of key elements of the athlete’s strength and power training program. Appropriate testing to evaluate lower body power is crucial in supplying data for development of the athlete’s individualized exercise prescription. With specific data, one can better manipulate the acute program variables in an attempt to optimize training outcomes related to muscular power, and ultimately game performance.In order to best evaluate any physical attribute, it is important that test reliability is established using a sport specific athlete group and used in a realistic application to the particular sport. Furthermore, identification of the appropriate number of trials to use during assessment insures accuracy of scores and efficient use of time by coaches.The standing long jump (SLJ) is a common test for the assessment of lower body power, specifically focusing on horizontal leg power [1-4]. The SLJ is a relatively easily administered test, feasible in a variety of settings, with basically no cost. Whilst literally everyone can test their athlete’s SLJ anywhere with a simple yard stick and chalk, even a reliable vertical jump test requires equipment costing a few hundred dollars. To better enhance the feasibility of use of the SLJ by practitioners, the purpose of this investigation was to establish the minimum number of trials needed to establish meaningful reliability of the SLJ in female collegiate volleyball players.
2. Methods
2.1. Participants
- Participants were a sample of female volleyball athletes at a Community College in the Intermountain West of the USA. Permission from the school athletic administration and team coach was granted prior to the study initiation. The athletes were verbally solicited to volunteer for the study. Permission from the Institutional Review Board for use human subjects in research was obtained prior to conducting any training or assessments of the participants. Participants provided written consent prior to study involvement. Further, all of the student athletes were 18 years or older.
2.2. Instruments and Apparatus
- Data collection sessions were held in the Activities Center at the Community College. The equipment necessary to conduct this study included a measuring tape, blue painter masking tape to set up jump markers (see Figure 1), and a measuring stick.
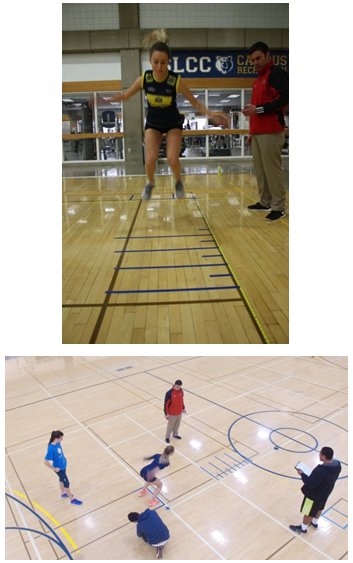 | Figure 1. Athlete setting up and attempting the standing long jump |
2.3. Procedures
- The initial meeting with the participants consisted of an orientation period where age, height, and weight were recorded. The investigators then reviewed the proper technique for the execution of the SLJ with the participants.Following the orientation the participants reassembled for the collection of SLJ trials. The data collection period started with a dynamic warm-up (WU). The dynamic WU protocol was identical to the WU protocol implemented in the athlete’s regular season physical condition program; intended to maintain consistency/specificity. The WU consisted of (in specific order): 20-meter high knees, 20-meter butt kickers, 20-meter lunges, 20-meter karaoke, 20-meter A-skips, 20-meter side shuffle, 30 second line hops (both feet), 15 second line hops (one set each leg), 10-meter broad jumps, 10-squat hops, leg sweeps (hamstring warm-up), 20-meter reverse lunges, 20-meter walking quad/hamstring stretch, 20-meter straight leg bounding, 10-leg swings, 10-medium arm circles and 10-large arm circles.Five trials of SLJs were then collected at 2, 6, 10, 14, and 18 minutes. Athletes started in standstill position with toes just behind the starting line [1]. The athlete then performed a countermovement and jumped forward as far as possible [1]. The athlete was required to land on their feet for the jump to be scored; otherwise the trial was repeated [1]. In the event of a fault the athlete was allowed only one immediate re-jump to avoid fatigue or hindrance of another athletes timing. A mark was placed at the back edge of the athlete’s rear most heel, and the tape measure determined the distance between the starting line and the mark [1].In order to mimic an “active” athletic setting, instead of seated rest between jumps, athletes alternated between walking and jogging the length of the basketball court. Thirty seconds prior to their jump, athletes were notified to prepare for their SLJ. SLJs were strictly regulated to the 5 established time markers of 2, 6, 10, 14, and 18 minutes.
2.4. Statistical Analysis
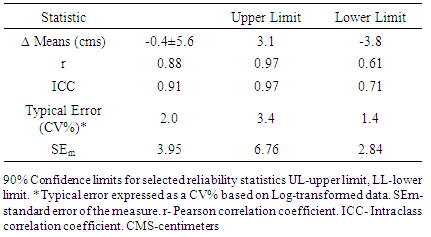
- A combination of statistical approaches were used to determine the needed number to trials to achieve reliable measurements of SLJ scores. We examined all the trials until we found the minimal number of trials to reach a meaningful level of reliability between two consecutive trials of SLJs. Initially, interclass (r) and intraclass reliability coefficients (ICC) were calculated between sequential pairs of SLJ trial scores until a plateau was achieved (i.e. Trials 2 to 1, 3 to 2, 4 to 3 and 5 to 4). Once two consecutive trials were identified the following analysis/calculations were conducted: mean difference between trials and the standard error of the measure (SEm) was calculated, a scatter diagram was plotted to visually inspect linearity between trails, Bland-Altman plots were constructed in order to explore uniformity of error, and trial data was log-transformed in order to assess typical error as expressed as a coefficient of variation percent (CV%). Further, 90% confidence limits were calculated for the aforementioned reliability statistics. Statistics were calculated in Excel with a spreadsheet prepared by Hopkins [5]. This particular reliability analysis is near identical to that reported by White et al. [6] and Tano et al. [7].
3. Results
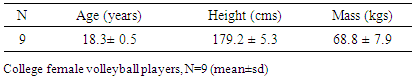
- Nine college female volleyball players participated in the study. The average age, height, and body mass of the participants is presented in Table 1. All of the participants completed all SLJ trials without incident.
|
|
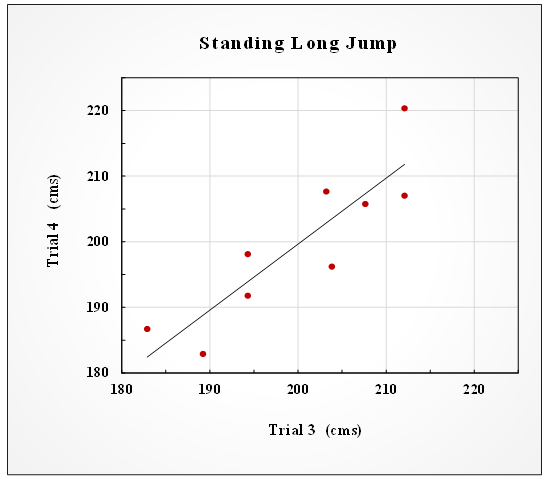 | Figure 2. Scatter Plot SLJ Trial 3 and 4 Scores |
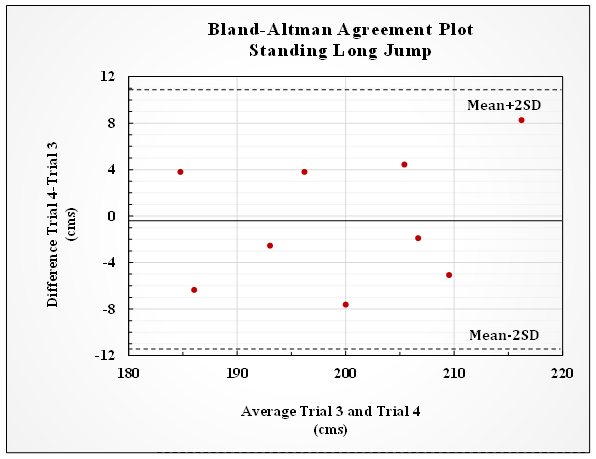 | Figure 3. Bland-Altman plot comparing the trial average scores versus the difference scores |
|
4. Discussion
- There was a twofold purpose to the current study. First, determine the reliability of the SLJ in female collegiate volleyball players. Second, assuming a meaningful reliability existed for the SLJ test, what was the appropriate number of trials to conduct in order to achieve a consistent SLJ score? The SLJ data collected in this study indicated that the SLJ was a highly reliable test and that a consistent score could be achieved at 3 trials. The SLJ scores collected in the current study (trials 3 and 4) were comparable to 20th % ile SLJ scores of elite female athletes and would have been considered “excellent” when compared to 15-16 year old female athletes as reported by Hoffman [12].The interclass reliability coefficient in the current study (r=0.88) is considerably higher than test-retest reliability coefficients reported for other commonly used physical performance tests [10]. Further, if should be noted that the lower limit of the 90% confidence interval for the interclass reliability coefficient in the current study is (LL=0.61), which is considered to be moderate-high [10].The intraclass reliability coefficient in the current study is ICC=0.91, which is also higher than the ICC’s reported for other commonly used physical performance tests [9]. Again, it should be noted that the lower limit of the 90% confidence interval for the intraclass reliability coefficient in the current study is (ICC LL=0.71), which is considered below-average acceptable [9]. Of note is agreement between the current findings and those of Markovic et al. [13]. Markovic et al. [13] reported an ICC=0.93 for the SLJ in a sample of physically active college aged men (n=91). The standard error of measure (SEm) is a measure of absolute reliability [14]. The SEm in the current study suggests that when measuring the SLJ as described in this study (and in this population) that the true score is within ±3.9 cms of the measured score (68% confidence). The implication here is that if a coach is attempting to use the SLJ to measure of change horizontal plane power output then the score change must exceed 3.9 cms or it could likely be that the change in scores recorded was simply measurement error. It should also be noted that when scores reflect non-uniform error (not the case in the current study), the SEm is biased and likely over estimates error in the lower scores and underestimates the error in the higher scores. Although we did not encounter evidence in the data suggesting bias or non-uniformity of error, we choose to attempt to make a correction to the data to ensure that our reliability examination was extensive.In order to correct for non-uniformity of error Hopkins [11] suggests Log-transforming the scores and expressing the error as ‘typical error’ or a CV%. The CV% with 90% confidence limits represents (CV%= 2.0: 3.4, 1.4) a non-bias measure of error that should be used as a bench mark when attempting to measure change in the SLJ scores in this population. It should be noted here that the CV%=2.0 would be ≈3.99 cms which is approximately equal to the SEm in the current study (SEm=3.95 cms). That the CV% was approximately equal to the SEm, is a confirmation that the trial data analyzed in this study was void of bias and/or non-uniformity of error.As we initially analyzed the data we considered removing what we perceived as an outlier score. However, we choose not to because of the limited number of participants (the results reported in the preceding section include the outlier score). As a point of interest, we did re-run the statistics with the outlier score removed. The interclass correlation coefficient was r=0.87 (0.97, 0.55), and the intraclass correlation coefficient was ICC=0.91 (0.98, 0.71). Both coefficients were essentially unchanged and confirmed the robustness of the initial statistical analysis.The trials were essentially split in that of the 9 participants 5 had greater trial 3 scores and 4 had greater trial 4 scores. As such, it would appear that fatigue did not impact the trial scores. A potential indicator that that the rest periods between trials and the warm-up selected for this study were appropriate.The participants in this study were college aged trained athletes who were familiar with the SLJ and the mechanics required to execute the movement. The physical maturity and familiarity of the participants with the SLJ likely added to the extremely reliable results noted in the current study. Future studies should include participants from different age, and sport/gender populations in order to fully enhance the feasibility of use of the SLJ by practitioners.Another point worthy of discussing has to do with the actual value of collecting a fourth trial of SLJ scores. Generally speaking, individuals typically have better scores during subsequent repeated trials of a physical test due to some type of learning (in the absence of appreciable fatigue). Since that was not the case when comparing the 3rd trials to the 4th trials of SLJs, and given that the average difference in trial scores was -0.41 cms, then why conduct the 4th trials if one is looking for max performance? Conversely, given the ease of collecting multiple SLJ trials and in the absence of fatigue, why not collect multiple trials of SLJ scores to establish horizontal plane power output?
5. Conclusions
- Within the parameters of this study, the SLJ should be considered a reliable test of horizontal plane muscular power output. Further, it appears that there is no need to collect more than 3 SLJ trials to establish a reliable maximum score. The SLJ is an easily administered test that has a high degree of task specificity to a number of sports. The authors recommend its use to strength and conditioning coaches who work with this population.
ACKNOWLEDGEMENTS
- We would like to thank Coach Sue Dulaney for allowing the facilities and equipment of Salt Lake Community College to be used freely during the study.