-
Paper Information
- Paper Submission
-
Journal Information
- About This Journal
- Editorial Board
- Current Issue
- Archive
- Author Guidelines
- Contact Us
International Journal of Sports Science
p-ISSN: 2169-8759 e-ISSN: 2169-8791
2016; 6(6): 219-229
doi:10.5923/j.sports.20160606.04

Traditional vs. Undulating Periodization in the Context of Muscular Strength and Hypertrophy: A Meta-Analysis
 Abstract
 Reference
 Full-Text PDF
 Full-text HTML
Leonardo C. Caldas1, Lucas Guimarães-Ferreira1, Michael J. Duncan2, André S. Leopoldo1, Ana Paula L. Leopoldo1, Wellington Lunz1
1Center of Physical Education and Sport, Federal University of Espírito Santo (UFES), Vitória, Brazil
2Department of Biomolecular and Sports Science, Coventry University, Coventry, UK
Correspondence to: Leonardo C. Caldas, Center of Physical Education and Sport, Federal University of Espírito Santo (UFES), Vitória, Brazil.
| Email: |  |
Copyright © 2016 Scientific & Academic Publishing. All Rights Reserved.
This work is licensed under the Creative Commons Attribution International License (CC BY).
http://creativecommons.org/licenses/by/4.0/

There is currently no consensus regarding the best periodization model to increase muscle strength and hypertrophy. However, most recently the undulating periodization (UP) has been believed to be better than traditional periodization (TP) model. The purpose of this study was to conduct a meta-analysis to investigate whether the UP is superior to TP to induce gains in strength and hypertrophy. Studies were searched in databases covering three idioms. Twenty-five studies met the inclusion criteria, allowing 72 and 6 effects sizes (ES) to strength performance and hypertrophy, respectively, covering 400 males and 192 females. Duration of training protocols ranged 6 to 16 weeks. Continuous data from maximum strength (1RM), isometric, power, and muscular endurance (RMs) tests were collected. Additionally, only gold-standard measures were included for hypertrophy assessment. Statistical analyses were performed using dedicated software for meta-analysis. Considering the pooled data, UP was significantly (P = 0.005) larger than TP model to 1RM test (ES= 0.22; 95% IC= 0.07, 0.38). However, there was no significant difference (P > 0.05) between UP vs. TP for power (ES= -0.04; 95% IC= -0.29, 0.22), RMs (ES = 0.20; 95% IC = -0.07, 0.48), isometric strength (ES = -0.13; 95% IC = -0.50, 0.24), and hypertrophy (ES = 0.32; 95% IC = -0.07, 0.71). UP model seems better than TP model to improve maximum strength performance, but not to power, muscular endurance, isometric strength, and muscle hypertrophy.
Keywords: Muscular strength, Resistance training, Weight training, Power training
Cite this paper: Leonardo C. Caldas, Lucas Guimarães-Ferreira, Michael J. Duncan, André S. Leopoldo, Ana Paula L. Leopoldo, Wellington Lunz, Traditional vs. Undulating Periodization in the Context of Muscular Strength and Hypertrophy: A Meta-Analysis, International Journal of Sports Science, Vol. 6 No. 6, 2016, pp. 219-229. doi: 10.5923/j.sports.20160606.04.
Article Outline
1. Introduction
- It has long been recognized that periodized strength training induces higher gains to maximum strength, power, and muscular endurance compared to nonperiodized training [1, 2]. Considering that neuromuscular system adapts quickly to a resistance-training program, it has been accepted that changes in training program are required for continuous gains in strength and muscle mass [1, 3]. However, the most effective strength training periodization model has yet to be elucidated. Although there has been criticism about the historic empiricism of periodization programs [4], the traditional (TP) and undulating periodization (UP) have been the most frequently used models to improve muscular strength and hypertrophy. The TP is termed 'linear' program, despite it is also characterized by undulations in both volume and intensity across each micro- and mesocycles [5]. The TP model is characterized by a division of the entire seasonal program into smaller periods and training unit [5], initiating with high volume and low intensity and progressively shifting to high intensity and low volume throughout the training program [6]. It comprises training phases with 4 to 6 weeks of duration with different goals (e.g., hypertrophy, strength, and power or peak) [7]. On the other hand, the volume and intensity in the UP model vary more frequently, and a number of neuromuscular components are integrated into a same-phase [6, 7]. UP is structured in training zones (e.g., strength, hypertrophy, and muscular endurance) which must fluctuate daily, weekly [8, 9], or biweekly [6, 10]. Some researchers have believed that UP is more effective than TP to improve strength and others parameters [3, 11, 12]. It is hypothesized that more frequently varying in the training stimulus could result in an optimization of the stress and recovery on the neuromuscular components [10, 12, 13]. There are, however, counterarguments regarding the hypothetical superiority of the UP model [9, 14]. In fact, other researchers found better results in favor to the TP regarding maximum strength improvement [15, 16]. Taken collectively, there appears to be no consensus regarding which model of periodization is most suitable and effective in order to improve strength and muscle hypertrophy. In these circumstances, a meta-analytical review is essential to support the decision-making; it is particularly useful because it is a quantitative, impartial and reproducible technique that permits inclusion of multiple scientific studies into the analysis. Thus, the sample number is increased, standard error (SE) decreased and statistical power enhanced, providing a more robust overview of any given area. Therefore, using a systematic review followed by meta-analysis we aimed to investigate the effects of two periodization models (UP or TP) on strength, power, muscular endurance and hypertrophy.
2. Method
2.1. Experimental Approach to the Problem
- This systematic review and meta-analysis was performed in agreement with the steps advocated by Cochrane Handbook [17]. The question we wanted to answer was: Which is the best periodization model to improve strength performance and muscular hypertrophy: traditional or undulating periodization? The electronic searches included two recognized database (PubMed and Scopus) considering their scientific relevance, quantity of studies and language (English), and additionally a database (Scientific Electronic Library Online; SciELO) that comprises more than 10 emerging countries in science covering different languages (Portuguese, Spanish, and English). This strategy was performed to minimize bias from database and English language [18, 19].
2.2. Procedures
- We used the following search strategy in PubMed, which included conjugated terms and their required position on the paper: (undulating [Title/abstract]) OR nonlinear periodization [Title/Abstract]) AND training [Title/Abstract]) AND Humans [Mesch]). Regarding Scopus we used the conjugated terms (TITLE-ABS-KEY (undulating) OR TITLE-ABS-KEY (nonlinear) OR TITLE-ABS-KEY (non-linear) AND TITLE-ABS-KEY (periodization). And we used the following search strategy to the SciELO: (ab:(undulating)) OR (ab:(no linear)) AND (ab:(training)). These terms were searched in Portuguese, Spanish, and English. For all databases there were no limit to data, age, or gender. The inclusion criteria was as follows: Original and interventional studies with healthy human submitted to strength training; presence of one or more dynamic and/or static tests used to evaluate strength (maximal, endurance, and/or power); gold standard imaging techniques (magnetic resonance, computerized tomography or ultrasound) to assess muscle hypertrophy; the aim stated by authors was to compare UP vs. TP; continuous outcome presented as mean, standard deviation or standard error, and sample number. Conference abstracts were excluded due to insufficient methodological description. Results repeated in more than one publication form were included just once (This was applicable only for the studies of Kok [20]; Kok, et al. [21]) to prevent multiple publication bias [18]. After the literature search, the following sequence was carried out: Firstly, the studies were saved electronically for further reading and evaluation. Secondly, abstracts were read and those that did clearly not meet inclusion criteria were excluded. Thirdly, the abstracts showing sufficient information covering the inclusion criteria and had no reason for exclusion were filed to further full text reading. Fourthly, after full text reading, the studies that fulfilled the inclusion criteria were selected for review, and studies that did not meet all inclusion criteria were excluded. Finally, after all full text reading of each study, the reference lists were also searched for any additional papers that were not found by our search strategy.
2.3. Coding and Classifying Variables
- The key categories coded of each study included were: (a) Identification of the studies (authors, title, year publication, journal, objectives); (b) Methodological quality characteristics (strategy of randomization and masking, study design, allocation concealment, intervention monitoring, follow-up loss); (c) Sample characteristics (age, sex, weight, height, number, fitness level, concurrent training, intervention type); (d) Methodological characteristics (type of training, testing, measurement technique, control type, statistical analysis); (e) Training characteristics (duration, frequency, number of sets, interval between sets, exercises selected and muscles trained, volume and intensity work); (f) Results (anthropometrics and performance in the strength tests). The main outcome coded was the results given by strength tests.All data extracted were registered in a datasheet. The mean, deviation (SD or SE) and sample number from pre- and post-intervention were extracted for each group included by studies. We considered teenagers who aged ≥ 10 and < 20 years-old, adults between ≥ 20 and < 60 years-old and elderly ≥ 60 years-old [22]. We classified participants in each study as either experienced or not experienced in resistance training based on the information provided by the authors of each study. In one study [23] was stated that participant had experience in strength training, however it was not informed how much experience (e.g., months or years of training). In addition, the participant from this same study were absent of training for two months. Therefore, we coded this sample as without experience. It was not possible to code one study [24] because the participants with and without experience were grouped together.Strength performance tests were coded in maximum strength (one-repetition maximum; 1RM), muscular endurance (repetitions maximum; RMs), power, and isometric strength. The data for 1RM were split into four categories: Bench press, leg press, squat, and other 1RM tests. This decision was taken because bench press was used in all studies that evaluated upper body strength, and leg press and squat were used by the most of studies that evaluated lower body strength. Other 1RM tests were included in a unique subgroup. Of note, some studies utilized more than one test that could be included in this last subgroup. For these reason, to prevent the possibility that one or few studies could skew the overall results, only one test from each study was chosen randomly. Thus, the meta-analysis to 1RM was completed to bench press, leg press, squat, and other tests separately (as subgroup) and pooled. For muscular endurance tests (RMs tests), two subgroups were created: Bench press and lower body exercises. Again, bench press was chosen because it was used for all studies. Several exercises were used to lower body, being most of them were leg press, squat, and leg extension. Therefore, we decided to cluster and describe them as lower body segment RMs test. Some studies used more than one test that could be included in this last subgroup. In this case, we randomly included a single test for each study. The meta-analysis to RMs test was completed to bench press and lower body segment RMs test separately (as subgroup) and pooled. Regarding power tests, two subgroups were created: Jumping and throwing. For jumping, the more common test was vertical jump (either countermovement or the squat jump). For throwing, the majority of studies employed the bench press or throw of medicine ball. In this case, the meta-analysis was conducted only as pooled because of the small number of data to the subgroups analysis. Just three studies evaluated isometric strength [14, 25, 26]. Thus, a meta-analysis was conducted on the data from these studies.The hypertrophy measures were obtained from the arm [12, 26] or thigh [20, 21, 27, 28]. Nonetheless, the analyses were only carried out using the data together, independently of the segment evaluated. However, when elbow flexors and extensors were measured by the same study [12, 26], only one data was randomly included to avoid the double effect size from the same design.Of note, only post training data for both UP and TP models were employed to perform this meta-analysis. However, this strategy would only be possible if pre training data for both UP and TP models had been matched. Therefore, we first performed a meta-analysis to the UP and TP using only pre training data, and we confirmed that the data from both interventions were statistically equals (as shown in Results). Prudently, we just did not include data from Arm Curl 1RM test from one study [29] in the post training meta-analysis because we found statistic difference between UP vs. TP groups at pre training. In addition, all 25 studies included in meta-analysis found that both UP and/or TP models were sufficient to induce performance gain on the most of the tests as compared with the pre training data.
2.4. Assessment of Study Quality
- The assessment of study quality in general has been accessed by strategies that scoring system are included or are not included [30-33]. However, these proposals are dedicated to clinical trials, but not to exercise interventions. For these reasons, we developed a specific qualitative evaluation considering the main methodological issues highlighted from above-mentioned documents and other related specifically to exercise-based interventions. Thus, we considered 8 criteria, as follows: (1) Study design characteristics: if the sample was randomized (2) Participants’ health condition: if sample participant had some risk factors (e.g., tobacco use, diabetes, hypertension, cardiovascular diseases, obesity); (3) Masking method: if the experimental design was blinded or double-blinded; (4) Monitoring of training: if a expert professional accompanied the training intervention; (5) Loss to follow-up: if there were sample withdrawals or dropouts; (6) Concurrent activities: if the sample was involved in others modalities of training; (7) Dietary prescription: if there was monitoring of food and supplementation intake; (8) Equated work: if the total work of training was matched to both periodization models. In this case, we accepted work described in Joules or as load x repetition.
2.5. Sensitivity Analyses
- Three sensitivity analyses were conducted. First, we analysed if the results were affected by training status. In this case, participants considered by authors as experienced or inexperienced to strength training were analysed separately. Second, we evaluated if the results were affected by conceptualization of periodization adopted for the authors. In this analysis, we included or excluded all those studies that in our own understanding could or not be classified as UP, independently of the author’s interpretation. In this regard, we conceptualized the UP as a model of training that is structured in different zones of training (e.g., muscular endurance, hypertrophy, maximum strength, and power) with frequent variations in the volume and/or intensity during periods (i.e. daily or weekly) that are repeated through the training. Moreover, we interpreted the TP as a model of training characterized by phases lasting 3 to 4 weeks of duration, with each phase distinguished by a specific objective. It begins emphasizing volume and later intensity. These conceptual interpretations are analogous to other authors [6-9, 34]. Thus, taking our own conceptualization into account, we could include the following studies [11-14, 20, 21, 23-29, 35-41]. On the other hand, we had do exclude the following studies [15, 16, 42-44]. Third, we analysed whether the matching training volume could influence the results. In this case, we included only studies that work was matched.
2.6. Statistical Data Analysis
- All statistical analysis was processed using the RevMan Manager software [45], which is a software available for free download (http://tech.cochrane.org/revman/download). All math algorithm used here can be assessed in details in 'help/statistical algorithms in revman', into the RevMan software. Briefly, data of the pre and post intervention from both UP and TP were processed. The effect sizes of each group were calculated using the standardised mean difference (SMD). The SMD of each study was processed by a random-effect model. The weight of each and pooled SMD were established by the inverse variance method. When studies presented standard error of the mean (SE), we converted it in standard deviation (SD) using the equation
 The heterogeneity of data were assessed by the chi-square
  and the heterogeneity-induced variability percentage of the effect sizes was accessed by I-square (I²) [46]. The 95% confidence intervals (95% CI) for each SMD and for all pooled estimating were calculated, and the maximum type I error was 5% (P ≤ .05).
3. Results
3.1. Descriptive Data
- Figure 1 depicts the algorithm of searching and selection. Three studies were excluded after reading all full texts. The first one [47] because the mean and SD in pre- or post intervention could not be obtained, other [48] due absence of results about strength or hypertrophy, and the last one [49] because absence of TP group. We were able to include 25 studies, allowing 72 effects sizes to strength performance and 6 effects sizes to hypertrophy. It amounted to 592 participants (400 male; 192 female). The intervention duration ranged from 6 to 16 weeks, with 2 to 4 sessions/week. Most of studies were ≤ 12 weeks of training duration (80%), adults sample (84%), participants experienced in strength training (60%), RMs as intensity parameter (64%; most of them covered by ≤ 15 RMs) and ≤ 5 sets/exercise (92%). Table 1 summarizes the mains methodological characteristics from the studies.
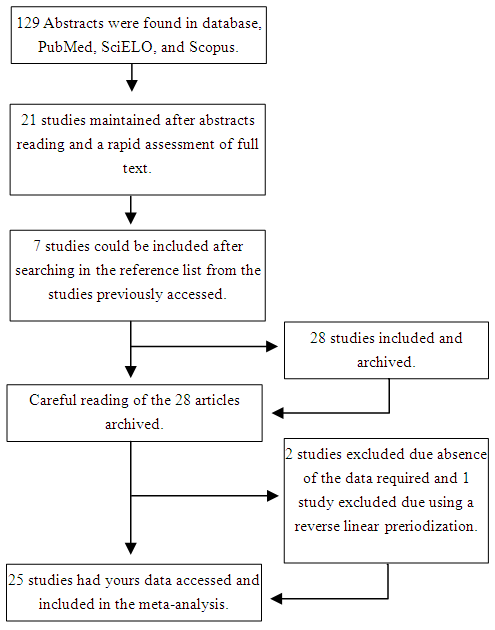 | Figure 1. Procedure for selection of the studies and decision-marking inclusion and exclusion |
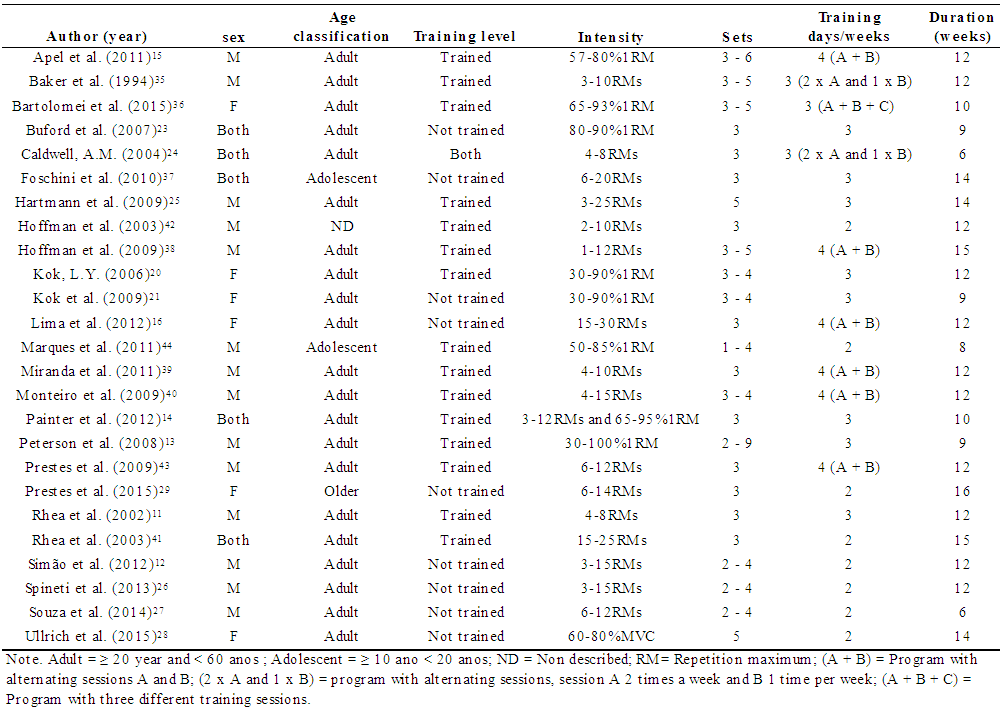 | Table 1. Characteristics of the subjects and studies included in the meta-ananlysis |
3.2. Methodological Quality of Studies
- The majority of studies (68%) described that participants were randomly allocated into each group, while others studies paired (20%), or allocated the participants by convenience sampling (4%), or did not describe any allocation strategy (8%). Regarding clinical conditions, 72% of the studies described that the samples were composed by healthy participants, one study (4%) was composed by obese participants and 24% did not describe the clinical condition. None of the studies described any strategy of masking during the performance tests. Thus, they were not blinded or double-blinded. In most of studies the monitoring of training was used (80%), while three studies (16%) did not describe information about this issue, and one (4%) highlighted that no monitoring of training was used. An expressive number of studies (40%) did not provide information about loss of data at follow-up. Five (20%) described that there were no withdrawals or dropouts, and 40% of studies described loss of one or more participants. In addition, almost one third of studies (28%) did not describe anything about concurrent activities. In 32% of the studies the authors stated that participants did some concurrent training and 40% of the studies stated that participants performed only strength training. Regarding dietary prescription, the majority of studies (64%) did not prescribe any diet, 28% did not assess or control the dietary intake, and just 8% incorporated some form of dietary monitoring. In relation to the training work equalization, 20 studies (80%) from a total of 25 affirmed to have equated the work. However, only 11 studies (44%) showed data that could allow us confirm this methodological statement. From these 11 studies, it just 9 of them (36%) calculated the work using ‘load x repetitions’. The data regarding to the methodological quality of studies are showed on the Table 2.
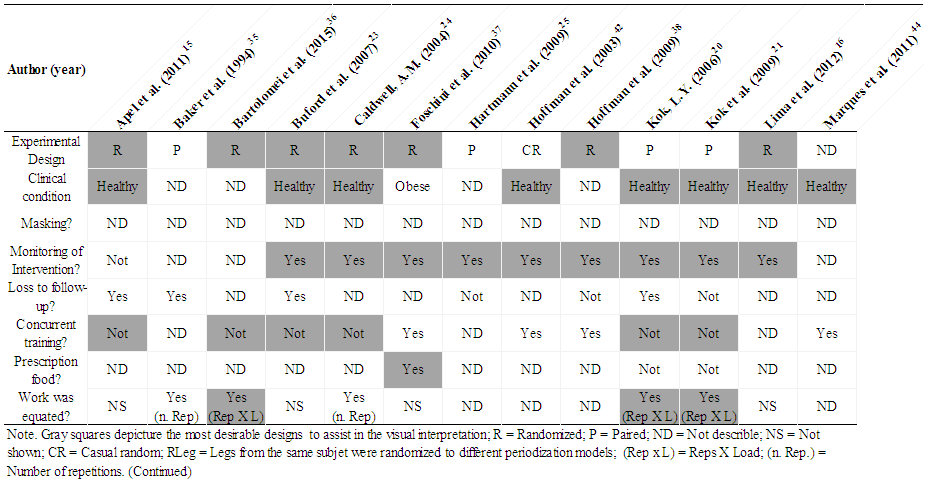 | Table 2. Assessing the quality of studies considering criteria of methodological rigor |
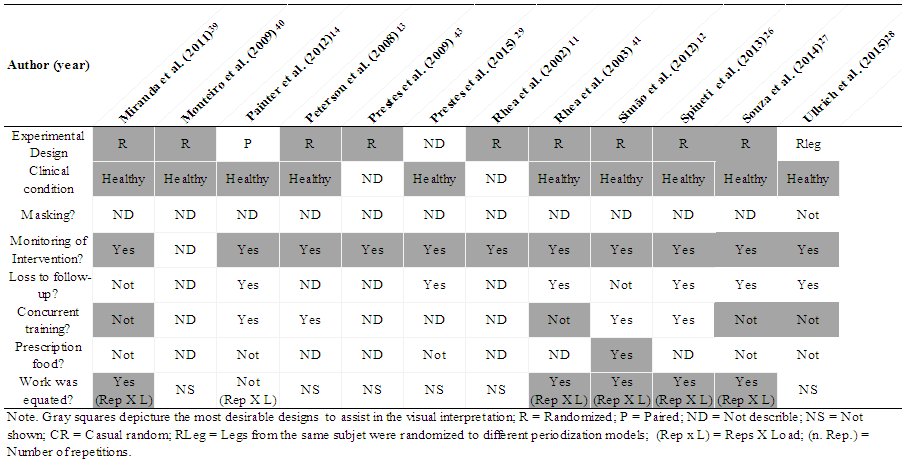 | Table 2. Assessing the quality of studies considering criteria of methodological rigor. (continued) |
3.3. Measures of Strength Performance and Hypertrophy
- At first, we performed a meta-analysis from the pre-intervention results to confirm if the data from participants allocated into UP and TP groups were homogeneous before training intervention. As expected, all results from the performance tests were statistically similar (all Z-value were ≤ 1.20 and all P-value were ≥ 0.23), as follows: Maximum strength (effect size = 0.08; 95% IC = -0.05, 0.20;), muscular endurance (effect size = 0.01; 95% IC = -0.23, 0.26), power (effect size = 0.07; 95% IC = -0.19, 0.33), isometric strength (effect size = -0.03; 95% IC = -0.40, 0.35), and hypertrophy (effect size = -0.04; 95% IC = - 0.40, 0.35). Chi-square test (χ²) did not find any difference (all P-value were ≥ 0.66) and all I2 were zero. Regarding the subgroups analysis for 1RM tests pos-intervention, there was no statistical difference between UP vs. TP on bench press (Z = 1.60, df = 19, P = 0.11), squat (Z = 0.75, df = 9, P = 0.45), leg press (Z =1.84, df = 8, P = 0.07), and other 1RM tests (Z = 1.21, df = 5, P = 0.23). However, when the analysis was made pooling all data, it was found a significant difference in favoring UP (Z = 2.80, df = 44, P = 0.005; effect size = 0.22; 95% IC= 0.07, 0.38; Figure 2).
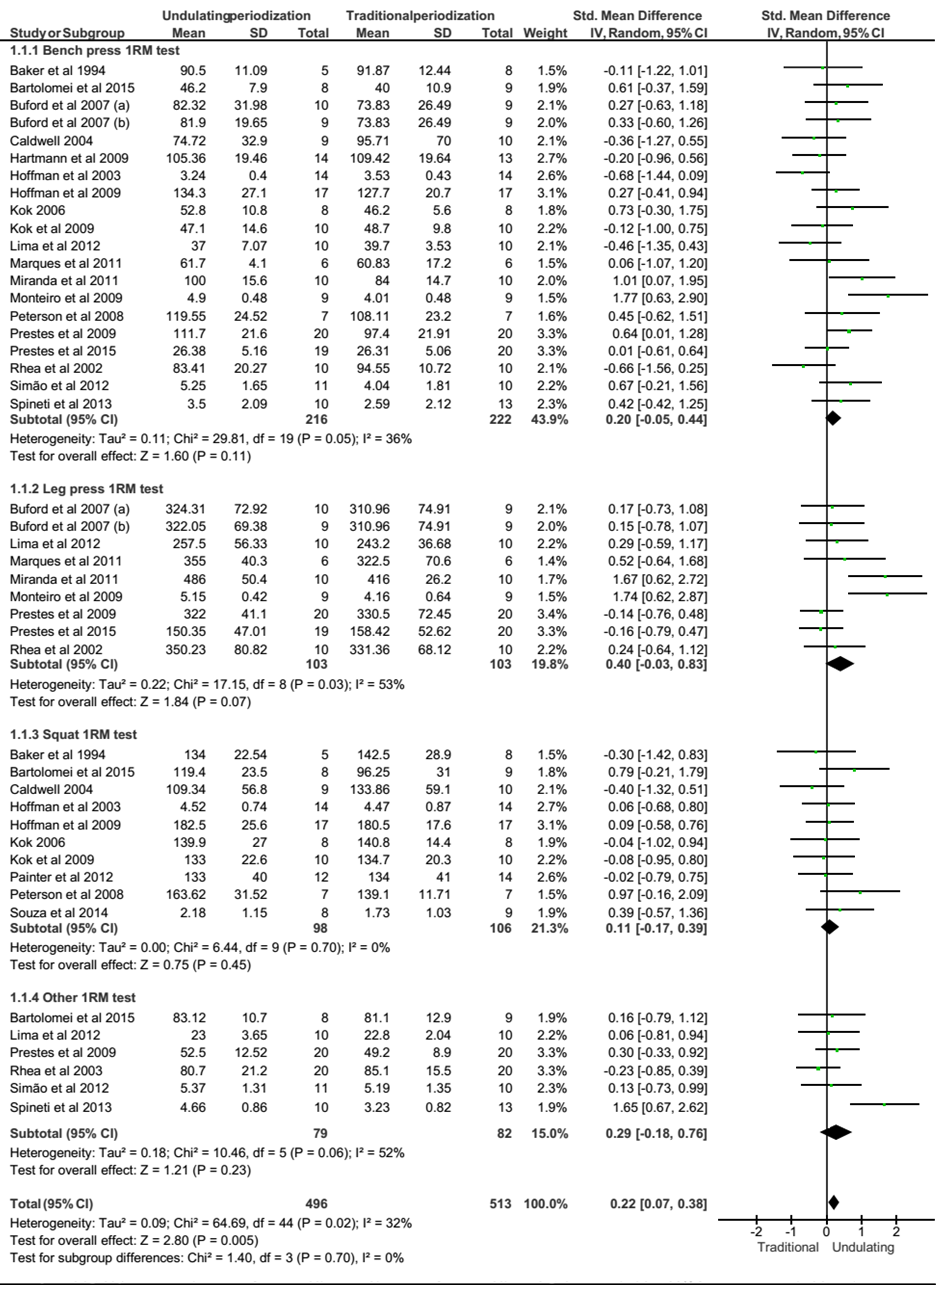 | Figure 2. Forest polt of maximum strength tests (IRM tests) presented as subgroup (Bench press, Leg press, Squat, Otheres tests) and pooled. SD = standard desviation; Std = standardized |
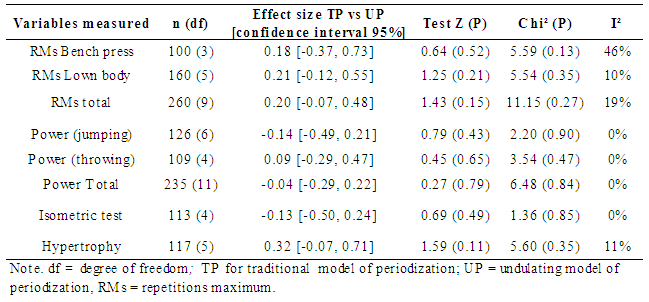 | Table 3. Effect size obtained for muscular endurance tests, power and isometric strength |
3.4. Sensitivity Analyses
- Firstly, we analyzed if training status could affect the results of meta-analysis. Participants were categorized as experienced and inexperienced to strength training in according to the classification made by authors. Altogether, results were not changed after this analysis (Z = 1.71, df = 15, P = 0.09). The second analysis included data from studies according to our own conceptualization of periodization (as explained before). In general, the results were not significantly changed, however a significant effect size for RMs tests was also found in direction to the UP model (effect size = 0.35; 95% IC = 0.02, 0.67; Z = 2.10, df = 5, P = 0.04). The last analysis was performed using data from those studies that the training work was matched. The statistical results were not altered. However, the effect size was approximately 2-fold larger in direction to the UP model when we considered only work matching data for 1RM tests (effect size = 0.47; 95% IC = 0.17, 0. 77; Z = 3.05, df = 14, P = 0.002).
4. Discussion
- The main finding of this systematic review followed by meta-analysis was that UP model was statistically better than TP to improve maximum strength performance when pooled effects sizes were analyzed. The effect size was still enhanced in direction to the UP when only data from studies using equated work were analyzed. In addition, we also found a significant effect size for repetition maximum tests in favor of UP when we used our own concept of periodization. However, the UP was not significantly better than TP model regarding to power, muscular endurance, isometric strength, and muscular hypertrophy. Considering that we only found difference to the pooled data, it is possible that the small number of data-points to this latter parameters may, at least partly, explain the lack of statistical difference. The UP model has been believed by some researchers to offer a better stimulus-recovery relation through of the strength training as compared to the TP [10, 12, 13, 26]. However, it is not consensual. In fact, it was also already found that UP induced a worse stimulus-recovery relation [15]. It is important to mention that all studies conducted to date and included in our meta-analysis were of short-term, thus it is not possible to make interpretation about long-term periodization. The possible mechanisms (e.g., neurophysiologic and/or morphologic) that could explain why UP was better than TP to maximum strength performance do not seem easy to explain.None of the studies included in our meta-analysis have been investigated the potential mechanisms. It is well-known that the capacity to generate muscle strength are dependent from neural and physiological ways. Apparently, the explanation could not be attributed to muscle morphological alterations, since we have not found any difference (or even tendency to difference) regarding to muscle hypertrophy. Thus, a hypothesis that must be tested is whether UP model could induce better neural adaptation as, for example, increasing central motor drive and motoneuron excitability, inhibiting presynaptic Ia afferent [50] or even inducing faster neural adaptations [43]. However, this hypothesis will need be addressed in the future. Effect sizes (or Cohen’s d) of 0.2, 0.5 and 0.8 have been considered as small, medium, and large, respectively; Of note, this classification has been criticized mainly when the 95% confidence interval and P-value are not considered [51]. In the present meta-analysis the effect sizes (or standardized mean deviation; SMD), with P-value lesser than 5%, ranged 0.22 – 0.47 for maximum strength performance, before and after sensitivity analyses. These effects sizes denote that the mean score of participants in the UP groups would be around the 58th percentile to 69th percentile in relation to the TP group [51]. We used a software dedicated exclusively to process meta-analysis and to prevent unrealistic outputs we followed the steps advocated by an important worldwide reference in systematic review and meta-analysis [17, 52]. In addition, considering the importance of bias control, we also created strategies to incorporate consolidated and emergent databases in order to reach studies published in three different languages. A classical concern in meta-analytical studies refers to the heterogeneity [17, 46, 52]. On the other hand, it has also been recognized that heterogeneity is inevitable since the methodological diversities are inherent to the studies included in any meta-analysis [46]. The chi-squared test has frequently been used to assess heterogeneity [17], with a low P-value (e.g., < 0.05) suggesting heterogeneity. In our meta-analysis the chi-square was statistically significant for some 1RM analysis; that is, exactly where we have found significant effect size in favoring to UP model. Even considering that chi-square can be problematic (and irrelevant) if many studies are included into a meta-analysis [17], this result may be a concern. Although there is no consensus about the I2 interpretation [53], it has been used to describe the variability caused by heterogeneity [46]. The I2 < 40% is not an indicator of significant heterogeneity [17, 53], and we have only found I2 > 40% for some 1RM tests (leg press; other 1RM tests). Other important concern in meta-analysis refers to the methodological quality of the studies. There is no single strategy for this evaluation. The most of methods employed, either qualitative or quantitative, was created for a clinical context [30-33]. However, strength-training interventions have their own peculiarities. For example, it is very difficult to carry out a blind or double-blind study in strength training, but is decisive that strength training progression and technique be monitored by a specialized professional. In addition, it is clearly possible and essential that researchers have concern and make strategies regarding sample randomization, clinical condition, withdrawals or dropouts, concurrent activities, monitoring of diet and equalization of the work training. As a consequence, the use of previously employed metrics to gauge methodological quality could be insufficient in the context of the exercise training. For this reason, we adapted a qualitative strategy from others [30-33]. In our view, the studies included in our meta-analysis had reasonable quality in relation to the randomization strategies, clinical condition, and monitoring of training. The concerns about work matching were also reasonable; however, several data descriptions necessaries to confirm this point were insufficient. The studies had poor information about loss of follow-up and were mainly deficient to masking methods. In addition, there were a great number of studies with concurrent training and missing control to dietary prescription. We did not include information regarding of drugs use (e.g., steroids) and ergogenic aids in our qualitative analysis, but it is an important issue in strength training. Nevertheless, no studies included in our meta-analysis described information about drugs use. Consequently, we cannot completely dismiss the possibility of these all methodological faults aforementioned had biased part of the results. Thus, further studies must to consider such issues.Sensitivity analyses have classically been recommended to test the robustness of meta-analyses findings [54, 55]. In this regard, one of our concerns was related to the equality of training work between groups inserted in UP and TP. In fact, some researchers have been speculated that different total training volume could explain the differences of results between UP and TP [11, 21, 35]. Our sensitivity analyses showed that equalization of total work did not alter the results. However, the effect size for pooled 1RM tests was 2-fold greater in favor to UP model when only studies matched by total work were analyzed. This result confirmed the advantages of the UP model for maximum strength and, in the same time, it illustrates that equalization of total work must be considered as intervening confounding variable in studies investigating periodization. Another theme considered in the sensitivity analyses was related to the interpretation of the periodization conceptualization. Initially, the UP or TP models were classified in conformity that stated by the authors. However, we found similar experimental designs with different classifications reported by the authors [16, 23, 43], and sometimes we found designs that could not be easily classified as UP or TP. Different nomenclatures and interpretations regarding the periodization models [11, 14, 15, 21, 23, 25, 38, 43] could induce conceptual confusions. Thus, we standardized the UP and TP conceptualizations to select and include the studies in our sensitivity analyses. Thereafter, we found a larger effect size for maximum strength and muscular endurance tests in favor of UP model. These findings are sufficient to suggest that inappropriate conceptualization of periodization may influence the robustness of the results. At the same time, it must encourage the scientific community to establish conceptual standardizations regarding the periodization and follow them. Other important concern is about the short-term nature from the studies. Indeed, the longest training duration included in our meta-analysis was 16 weeks. This is rather problematic since periodization should be thought for a long-term. Thus, it is currently not possible to draw conclusions regarding the effectiveness of ‘long-term periodization’. Harries, et al. [56] also did a meta-analysis regarding the TP and UP model. However, there are some important differences between our both studies concerning to the methods and results. We included more studies (47%) than Harries et al. [56]. They only analyzed data from 1RM tests, while we also analyzed data from power, muscular endurance, isometric strength tests, and hypertrophy using data from robust techniques. Unlike them, we also performed sensitivity analyses that are particularly important to expand the data interpretation. Harries et al. [56] did not find differences between TP vs. UP, while we found that the UP was significantly better than TP to improve maximum strength performance. The main explanation for this conflicting result is the larger number of effects sizes that we have included in our study. Despite it, we did not find difference to other variables (power, RMs, and isometric strength tests; hypertrophy).Regarding the studies included by Harries et al. [56], it is interesting to mention that they found 1RM bench press data for the Rhea et al. study [41], while we only found data regarding leg extension in this same study. They also included 1RM bench press data from the Apel et al. study [15], however in this study mentioned we only found data from 10RMs, but not 1RM. Unlike us, they included a study (Franchini et al. [49]) whose authors used a reverse linear periodization. In conclusion, our results suggest that UP is better than TP to improve maximum strength performance. The same conclusion cannot be made for power, muscular endurance, isometric strength, and muscular hypertrophy. However, a number of methodological faults from the studies and the short-term periodization request some caution before trying to extrapolate the results.