-
Paper Information
- Paper Submission
-
Journal Information
- About This Journal
- Editorial Board
- Current Issue
- Archive
- Author Guidelines
- Contact Us
International Journal of Sports Science
p-ISSN: 2169-8759 e-ISSN: 2169-8791
2016; 6(4): 163-167
doi:10.5923/j.sports.20160604.06

Analysis of Shots and Passing Sequence of a Soccer Team and Its Opponents during 2014 Brazilian Championship
 Abstract
 Reference
 Full-Text PDF
 Full-text HTML
Júlia Barreira1, 2, Caroline Vendite1, Laércio Luis Vendite2
1Faculty of Physical Education, State University of Campinas, Campinas, SP, Brazil
2Institute of Mathematics, Statistics and Computer Science, State University of Campinas, Campinas, SP, Brazil
Correspondence to: Júlia Barreira, Faculty of Physical Education, State University of Campinas, Campinas, SP, Brazil.
| Email: |  |
Copyright © 2016 Scientific & Academic Publishing. All Rights Reserved.
This work is licensed under the Creative Commons Attribution International License (CC BY).
http://creativecommons.org/licenses/by/4.0/

The aim of this study was to analyze the shots and passing sequence of a team, and its opponents, during the second division of the 2014 Brazilian Championship. Thirty-eight matches were analyzed and the technical scout was used to quantify the amount of shots and incorrect passes, length of passing sequence and ball possession of both teams per game. The results showed that ball possession and incorrect passes had no relationship with the match outcome. Sequences of three passes or less were the most frequent and most of the shots and goals came from sequences of four and five passes. The main reasons that interrupted passing sequence were: incorrect passes (25%) and loss of ball control (25%), followed by incomplete passes (18%) and fouls (11%). The occurrence of incorrect passes showed a small variability during the championship, from 5% to 12% per game, and presented a significant decrease from the middle to the end of the tournament. The results presented in this study provide valuable information for national coaches for training programs based on real game situations.
Keywords: Soccer, Scout, Performance analysis, Brazilian Championship
Cite this paper: Júlia Barreira, Caroline Vendite, Laércio Luis Vendite, Analysis of Shots and Passing Sequence of a Soccer Team and Its Opponents during 2014 Brazilian Championship, International Journal of Sports Science, Vol. 6 No. 4, 2016, pp. 163-167. doi: 10.5923/j.sports.20160604.06.
Article Outline
1. Introduction
- The technical components of a soccer match have received great attention of coaches and researchers in order to investigate their relationship with the match outcome. Among the several elements present in a soccer match, shots and passes are technical components widely studied and can be used as performance indicators in the sport [1]. In international matches it was shown that goal scoring-related variables, such as shots and shots on target, are associated with team’s success [2-6]. Also, Castellano et al. [2] and Lago et al. [5] found that shots on target were the game-related statistics with the greatest discriminatory power among winning, drawing and losing teams. Due to the straight relationship between these technical components and the match outcome, it is important to investigate actions that led to create shooting opportunities. The relationship between the length of passing sequence and shooting opportunities has already been studied in international matches. According to the authors Hughes and Franks [7] and Reep, Pollard and Benjamin [8], 80% of the shots are performed on sequences of four passes or less implicating in a dynamic game with ball possession directed to create shooting opportunities as quickly as possible. Paixão et al. [9] also found that international teams use shorter passing sequences when they are winning which may be explained by preference to play counterattacking and direct play.The studies cited above used several methods to analyze shots and passes during a match, such as digital videos [9] and collection of data available on websites [2, 3]. The fundamentals of soccer, as shots and passes, can be also quantified using the scout analysis which allows the complete description of the actions and game situations that occur in a match [10]. Information about the actions that create shooting opportunities, the length of passing sequence, as well as the cause of its interruption, are valuable for the game understanding and to the training planning. Although shots and passes have been widely studied in international matches, few studies have investigated these technical aspects in national championships.The scout has been used to analyze the longitudinal performance of Brazilian teams during national and state championships [11-14]. These previous studies have examined the relationship between the amount of shots and incorrect passes with the match outcome. However, there is no study of our knowledge that analyzed the relationship between shots and passing sequence in national matches and the occurrence of these actions along the championship. Brazilian coaches resort to the international literature to obtain references for training. Therefore, it is necessary to identify patterns in national matches that can be used as references for national coaches [15]. The aim of this study was to analyze the shots and passing sequence of a team, and its opponents, during the second division of the 2014 Brazilian Championship.
2. Methods
2.1. Sample
- We analyzed all the 38 games played by a team in the second division of the 2014 Brazilian Championship.
2.2. Procedures
- In this study, we used the scout analysis to quantify the technical actions at the time of the games. A team of ten trained evaluators performed the collections. Each evaluator was responsible to quantify a determined technical action during all the championship. In addition, player’s individual observations were carried out in all matches and the main technical actions of the opposing team were also collected.The actions quantified in each game and their classification criteria, were based on the model used by Vendite, Moraes and Vendite [10]:- Incorrect passes: were characterized by the inappropriate direction or force imposed on the ball, preventing it receipt by another athlete of the same team.- Total shots: were considered the kicks taking into consideration the trajectory of the ball direct to the goal.- Shots on target: shots whose trajectory was towards the goal, showing a risk to the opponent.- Passing sequence: amount of passes performed before the sequence was interrupted. As used by Hughes and Franks [7] the sequence length of zero was a pass that could not be received by a player of the same team. A sequence of one pass was composed by a successful pass followed by a second unsuccessful pass with loss of ball control, and so on. The reasons why the sequences were interrupted were also collected. In this study no computer program was used for the data collection, only observations and annotations. After the collection, data were tabulated and arranged into Microsoft Excel spreadsheets.
2.3. Statistical Analyses
- The descriptive statistics using mean, standard deviation and frequencies was used to summarize the database collected. Bar charts were also used to explore the frequency of each length of passing sequences. The normality of the data was verified by statistical test of Shapiro-Wilk. To analyze the differences of ball possession, incorrect passes, total shots and shots on target among winning, losing and drawing teams was used the analysis of variance (ANOVA) with post-hoc of Tukey. The difference of the each passing sequence frequency depending on the game outcome was analyzed through the Chi Square test. The analysis of shots on target and incorrect passes in all rounds of the Championship were performed using the quality of control tool. The relative frequency of incorrect passes was calculated as a proportion of total passes and shots on target percentage were also calculated as a proportion of total shots. The variability of these variables along the championship was analyzed through the confidence interval generated by the quality control. The amount of shots and incorrect passes performed on the first (1 to 19 rounds) and on the second phase (20 to 38 rounds) of the Championship was analyzed through the T-test for independent samples. All analyses were performed in GraphPad Prism 6 (San Diego, California, USA) and Microsoft Excel. The significance level of 0.05 was adopted.
3. Results
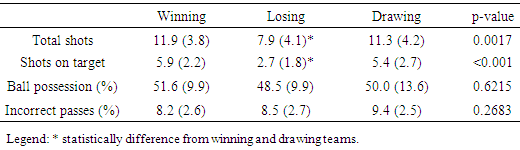
- Table 1 shows the technical characteristics of the winning, losing and drawing teams. No significant difference was found in ball possession and in the amount of incorrect passes according to the match outcome. However, losing teams presented lower amount of total shots and shots on target than winning and drawing teams.
|
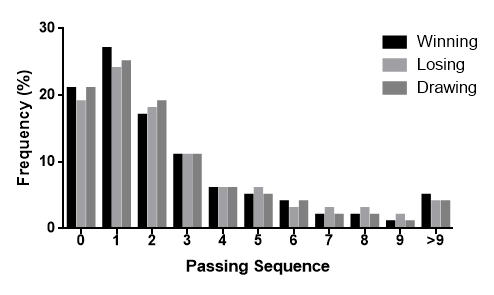 | Figure 1. Frequency of each passing sequence according to the match outcome |
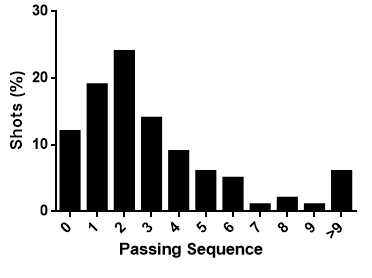 | Figure 2. Frequency of shots according to each passing sequence |
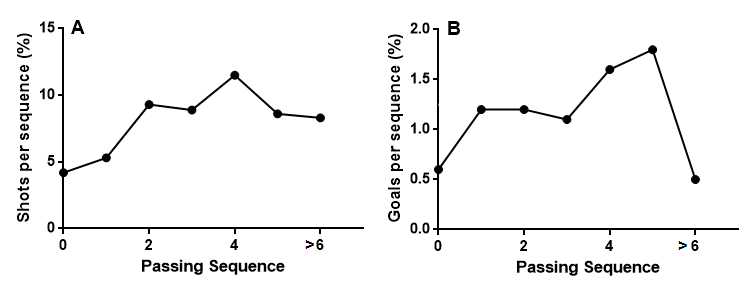 | Figure 3. Rate of shots and goals per passing sequence |
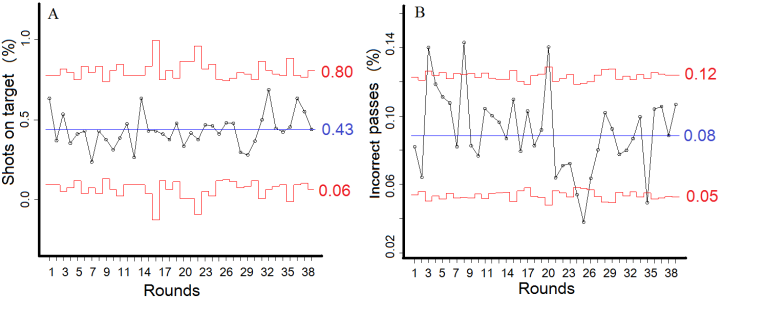 | Figure 4. A) Shots on target and B) incorrect passes in all rounds of the championship. Legend: red line - confidence interval, blue line – average over championship |
4. Discussion
- The aim of this study was to analyze the shots and passing sequence of a team and its opponents during the second division of the 2014 Brazilian Championship. The results presented showed that ball possession and incorrect passes have no relationship with the match outcome. The sequences of three passes or less were the most frequent and sequences of four and five passes were the most efficient in promoting shots and goals. The main factors that interrupted the passing sequence were incorrect passes and loss of ball control. The occurrence of incorrect passes presented a significant decrease from the middle to the end of the tournament. The amount of shots showed a greater variability in the championship than incorrect passes.The results of our study showed the predominance of sequences of three passes or less in Brazilian national matches. Our results are similar to the international finds [7, 8] showing that the national matches are also dynamic, with the ball possession directed to create shooting opportunities as quickly as possible. The relationship between passing sequence and match outcome in UEFA Champions League was investigated by Paixão et al. [9]. The authors found that teams perform shorter passing sequences when they are winning and longer sequences when they are drawing or losing. Differently from the international matches, our finds showed that winning, losing and drawing teams in national matches present no significant difference in the length of passing sequence.Our results showed that sequences of four and five passes were the most efficient in promoting shots and goals, once more corroborating the references of Hughes and Franks [7] for international matches. The main reasons for the interruption of the passing sequence were the incorrect passes and loss of ball control. In this way, if a team wants to increase possession through the passing sequence, it is necessary to make fewer mistakes and minimize the loss of the ball, aspects that can be developed through the technical and tactical training. The analysis of the amount of total shots and shots on target showed that defeated teams performed less these actions. Our results corroborate the findings of other studies showing that successful teams perform more shots and shots on target than unsuccessful teams [16-18] and losing teams [2-6]. We found an average of 43% of shots on target in the championship. Our data corroborates with Paula [19] who verified an average of 40% of shots on target performed by the Brazilian national team in different editions of the World Cup. The great confidence interval in our study reflects the high variability of shots that is probably influenced by temperature, field conditions and crowd of each match.The average frequency of 8% of incorrect passes found in our study is next to the found by Fonseca [20] of 11% in the first division of the 2011 Brazilian Championship. These results show a small difference between the occurrence of incorrect passes in matches of the first and second division of the Championship showing that professional teams of different levels present similar performance in this action. We also found a small confidence interval of incorrect passes, from 5 to 12%, in all phases of the championship showing that this action presents a small variability facing the different stimulus of each game. This amount of incorrect passes reference in official national matches can be used for a greater control of training stimuli and to approach it to real game situations. In addition, it was found no significant difference in the amount of incorrect passes performed by winning, losing and drawing teams. Despite the independence between incorrect passes and the match outcome, depending on the area where the pass is performed and the placement of the teams, the error can easily allow the opponent's goal. Also, Collet [21] and Göral [22] showed that passing success and accuracy are related to team’s success. Therefore, pass is an important skill to be developed in training programs that allows creating scoring opportunities during the matches and difficult the ball possession of the opponent. Several studies verified the efficiency of the physical training to improve the physical fitness of the players throughout championships [23-26]. In our study we found the effectiveness of the technical training conducted during the championship in reducing the frequency of incorrect passes throughout the phases.
5. Conclusions
- The results presented in this study are important to extend the knowledge about the dynamics national matches. The results showed that sequence of three passes or less are the most frequent, promoting a dynamic game with possession directed toward the goal. However, the sequences of four and five passes are the most efficient in generating shots and goals. If teams want to increase ball possession through the passing sequence, they need to perform fewer mistakes and minimize the loss of ball control, aspects that can be developed through the technical and tactical training. It was found a small variability of incorrect passes per game, from 5% to 12%, reference that can be used to approach national trainings to the real game situations.