-
Paper Information
- Paper Submission
-
Journal Information
- About This Journal
- Editorial Board
- Current Issue
- Archive
- Author Guidelines
- Contact Us
International Journal of Sports Science
p-ISSN: 2169-8759 e-ISSN: 2169-8791
2016; 6(4): 153-158
doi:10.5923/j.sports.20160604.04

Laboratory and Field-based Assessment of Maximal Aerobic and Anaerobic Power in Professional Tennis Players
 Abstract
 Reference
 Full-Text PDF
 Full-text HTML
1Hitit University, Physical Education and Sports School, Çorum, Turkey
2Siirt University, Physical Education and Sports School, Siirt, Turkey
Correspondence to: Erşan Arslan, Siirt University, Physical Education and Sports School, Siirt, Turkey.
| Email: |  |
Copyright © 2016 Scientific & Academic Publishing. All Rights Reserved.
This work is licensed under the Creative Commons Attribution International License (CC BY).
http://creativecommons.org/licenses/by/4.0/

The purposes of this study were to determine the relationship between laboratory and field aerobic and anaerobic tests performances in professional tennis players. Fourteen professional tennis players (age 23.0 ± 1.9 years; height 178.9 ± 3.5 cm; weight 73.9 ± 7.6 kg; training experience 7.1 ± 1.1 years) participated in this study voluntarily. A portable gas-analysis system was used during the laboratory treadmill running testing (TRT). Field-based assessments were performed using the Hit and Turn Tennis Test (HTTT), the Yo-Yo Intermittent Recovery Test Level 1 (YYIRT) and the 20-m Multistage Shuttle Run Test (MSRT). The Wingate anaerobic test (WAnT), jumping ability (counter-movement jump (CMJ) and squat jump (SJ), and sprinting ability (5-m, 10-m and 20-m) were used for the determination of anaerobic performances. The results demonstrated that the distance covered in TRT was significantly correlated with all field tests in terms of distance covered (ranging from r = 0.56-0.64; p < 0.05). Significant correlations were also found between HTTT and TRT in terms of VO2max response (r = 0.46; p < 0.05). Moreover, the maximal running velocity calculated from the field tests was significantly correlated with the WaNT, jumping and sprinting abilities (ranging from r = 0.40-0.81; p < 0.05). The results of this study suggest that HTTT may be more suitable sport specific field test for determining required aerobic capacity responses in tennis players.
Keywords: Field test, Jumping performance, Sprint, Tennis, Maximal running velocity
Cite this paper: Bülent Kilit, Erşan Arslan, Laboratory and Field-based Assessment of Maximal Aerobic and Anaerobic Power in Professional Tennis Players, International Journal of Sports Science, Vol. 6 No. 4, 2016, pp. 153-158. doi: 10.5923/j.sports.20160604.04.
Article Outline
1. Introduction
- Competitive tennis players need a mixture of fitness qualities such as speed, agility, and power combined with a well-developed aerobic fitness to achieve high levels of performance [1, 2]. An advanced aerobic fitness enables tennis player not only to repeatedly generate explosive actions, but also ensures fast recovery between rallies, especially during long matches [3, 4, 5]. Furthermore, tennis players’ high intensity movements (e.g., several strokes, quick changes of direction, short accelerations, and decelerations) are positively associated with their anaerobic energy pathways during match play [1]. Because of this relationship, tennis players should enhance their both aerobic and anaerobic capacity [6]. Tennis players need to possess tennis-specific aerobic fitness, muscle strength and power not only to reach optimum match performance, but also to be able to effective performance tennis on-court practice for professional tennis players [5, 7, 8]. It is thus important to assess physical capacities and to determine sport specific demands. Direct measurement of maximal oxygen uptake (VO2max) using analyzers on treadmill in the laboratory environment, is the gold standard, are commonly used for tennis players [3, 9]. However, incremental exercise tests requires expensive measurement equipment, laboratory conditions, and trained personnel [10]. In addition, treadmill maximal oxygen uptake testing cannot simulate the intermittent demands of tennis and does not reflect both upper and lower sport specific muscular activity demands [11]. For these reasons, monitoring and assessment of physical capacities, using sport specific field and laboratory tests, is one of the most important issues for training in professional sports [3, 12]. An increased interest in predictive tests is important to develop field tests that can measure the physical capacities of athletes and also important comparing these tests with each other [3, 13]. One of the these tests the Hit & Turn Tennis Test (HTTT), is validate and reliable tennis-specific endurance test, is a progressive fitness test for tennis players [14]. The other popular tests Yo-Yo Intermittent Recovery Test (YYIRT) and 20-m Multistage Shuttle Run Test (MSRT), which have progressively become the most popular field tests, are practical in variety team sports [15, 16]. However, these are suitable for nature of the tennis training and match activity, there is no study found in literature. The other commonly used test of anaerobic fitness is the Wingate anaerobic test (WaNT), which is a gold standard popular laboratory-based cycle ergometer test [17]. However, a few previous studies has compared the field and laboratory test performance in tennis players [2, 18]. In this context, we was hypothesized that the HTTT would be different from the other field test performances. Therefore, the aims of this study were (a) to determine the differences between field and laboratory aerobic tests performances and (b) to evaluate the relationship between the Wingate anaerobic test (WAnT), jumping and sprinting ability test in professional tennis players.
2. Material and Methods
- ParticipantsFourteen right-handed professional male tennis players (age 23.0 ± 1.9 years; height 178.9 ± 3.5 cm; weight 73.9 ± 7.6 kg; percentage body fat 10.2 ± 2.1; training experience 7.1 ± 1.1 years) participated in this study. At the time of the study, the players had International Tennis Numbers (ITN) ranging from 1 to 2, corresponding to an Association of Tennis Professionals (ATP) ranking of between 800 and 1600 and a national ranking of between 1 and 25. All the participants were right-handed tennis players. Except the TRT and WaNT, all tests were performed on an indoor hard court in the morning between 9:00 and 12:00 and in the same field facilities. The participants were asked not to drink caffeinated beverages or take other stimulants for the 3 hours prior to the test, and to avoid strenuous exercise for 24 hours prior to the field and laboratory tests. Verbal encouragement was given by the coaches throughout the tests. All the players were notified of the research procedures, requirements, benefits, and risks before giving informed consent. Written informed consent was obtained from all the subjects. This study was approved by the research ethics committee of the local university, and was conducted in a manner consistent with the institutional ethical requirements for human experimentation in accordance with the Declaration of Helsinki.MeasuresAnthropometric measurements Body height was measured to the nearest 0.1 cm using a calibrated stadiometer (Holtain Ltd, England), while body weight and body fat percentage were measured using Bioelectrical impedance analysis (BC–418, Tanita, Tokyo, Japan). Treadmill running test protocolAll players completed a treadmill test (T150, Cosmed, Rome, Italy) to determine HRmax and VO2max. The test consisted of an initial 3 min continuous workload of 9 km/h with an increase of 0.5 km/h every minute at a constant gradient of 0% until exhaustion [3]. During the test, respiratory gas exchange measures were obtained using the K4b2 and recorded at 5-second intervals. Heart rate was recorded using the K4b2 with athletes wearing a chest belt. The flow, volume, and gas analyzer were calibrated prior to each test according to the manufacturer’s instructions. The highest 30-second mean HR and VO2 values measured during the test were used as maximum values (HRmax and VO2max). Yo-Yo Intermittent Recovery Test 1Yo-Yo Intermittent Recovery Test 1 (YYIRT) was performed according to the procedures suggested in this study [6]. Each player’s HR was measured at five-second intervals throughout the test and stored using HR monitors (Polar S610, Polar Electro OY, Kempele, Finland). Stored data were transferred to the computer and filtered by dedicated software (Polar Precision Performance SoftwareTM, Finland). The highest HR measurement during the test was recorded as HRmax. Peak velocity was calculated according to the last 20-m run performed. After the test, estimated maximum oxygen uptake (VO2max) was calculated by using the following formula [6].VO2max = 36.4 + (0.0084 x covered distance in YYIRT)Hit & Turn Tennis TestThe Hit and Turn Tennis Test (HTTT) was developed as an acoustically controlled progressive on-court fitness test for tennis players, which can be performed simultaneously by one or more players [14]. The test took place in an indoor hard court, involving specific movements along the baseline (i.e., side steps and running), combined with forehand and backhand stroke simulations at the doubles court corner (distance 11.0-m). At the beginning of each test level, the players stand with their racket in a frontal position in the middle of the baseline. Upon hearing a signal, the player turns sideways and runs to the prescribed (i.e., by the CD player) backhand or forehand corner. After making their shot, they return to the middle of the court using side steps or crossover steps (while looking at the net). When passing the middle of the baseline again, they turn sideways and continue to run to the opponent’s opposite corner. The end of the test was considered when players fail to reach the cones in time or was no longer able to fulfill the specific movement pattern. Maximal completed level was used for the determination of the tennis-specific endurance capacity and this level was annotated to maximum oxygen uptake and peak velocity. Each player’s HR was measured at five-second intervals throughout the test and stored using HR monitors (Polar S610, Polar Electro OY, Kempele, Finland). The highest HR measurement during the test was recorded as HRmax. After the test, estimated maximum oxygen uptake (VO2max) was calculated by using the formula [14]. (i.e. for adult male players, if the player finishes level 16 it is: 30.0 + 2.00 x 16 = 62 ml/kg/min). VO2max = 30.0 + 2.00 x (player finishes level in HTTT)20-m Multistage Shuttle Run TestEach players’ maximal oxygen uptake was obtained using 20-m multi-stage shuttle run test. This consisted of shuttle running between 2 parallel lines set 20-m apart, running speed cues being indicated by signals emitted from a commercially available prerecorded audiocassette tape. The audiocassette tape ensured that subjects started running at an initial speed of 8.5 km.h-1 and that running speed increased by 0.5 km.s-1 each minute. This increase in running speed is described as a change in test level. The speed of the cassette player was checked for accuracy in accordance with the manufacturer’s instructions before each application. Test results for each player were expressed as a predicted VO2max obtained by cross-referencing the final level and (completed) shuttle number at which the subject became exhausted with that of the VO2max table provided in the instruction booklet accompanying the 20-m multi-stage shuttle run test. The highest HR measurement during the test was recorded as HRmax. Only fully completed 20-m shuttle runs were considered [19]. Peak velocity was calculated according to the last 20-m run performed. After the test, estimated maximum oxygen uptake (VO2max) was calculated by using the formula [20].Y = 31.025 + 3.238 X - 3.248A + 0.1536AX (Y= VO2max, X = player finishes level in test, A= age)The Wingate Anaerobic Test (WAnT) The Wingate Anaerobic Test (WAnT) was conducted using a mechanically braked cycle ergometer (model 894 Ea, Monark, Sweden) according to the procedures detailed in a study [21]. During the test, the athletes were verbally encouraged to give the maximum effort possible. At the end of the test, peak power and mean power was calculated automatically by the WAnT test computer program. A fatigue index (FI) was calculated by using the following formula [22].FI = [(Peak Power Output-Minimum Power Output) / Peak Power Output] x 100Vertical jump measurementsJump performance was assessed using a portable force platform (Newtest, Finland). Players performed countermovement jump (CMJ and) squat jump (SJ) according to the protocol described by a study [2]. Before tests, following the tennis-specific warm-up, participants performed 3 times CMJ and SJ as a practice. During the tests, the players were instructed to keep their legs straight throughout the tests. Each player were asked to 3 jumps interspersed with 45 seconds of passive recovery and the highest jump was recorded.Sprint measurementsBefore sprint tests, each player performed individually warm up consisting of 10-15 minutes on an indoor hard court surface. The feet were placed side to side in the tennis-ready position behind the starting line. Players were asked to run 3 maximal 20 meter sprints (5-m, 10-m and 20-m) interspersed with 3 minutes of passive recovery, and the fastest time was recorded. Sprint performance was assessed using a portable electronic timing gates (Smart Speed, Grabba International/ Australia).
3. Analysis
- The data are reported as means and standard deviations. A one-way repeated-measures analysis of variance was performed on each dependent variable, including VO2max, HRmax and total covered distance between HTTT, YYIRT and MSRT. The Bonferroni Post Hoc test was applied to make a pairwise comparison between the different levels of within subjects’ factor (measurement methods). Pearson’s product moment correlation coefficient (r) was used to determine the relationships between aerobic and anaerobic tests. The level of statistical significance was set at p<0.05.
4. Results
- Table 1 shows the results of the aerobic and anaerobic tests performances. No difference was found between HTTT, YYIRT and MSRT performances.
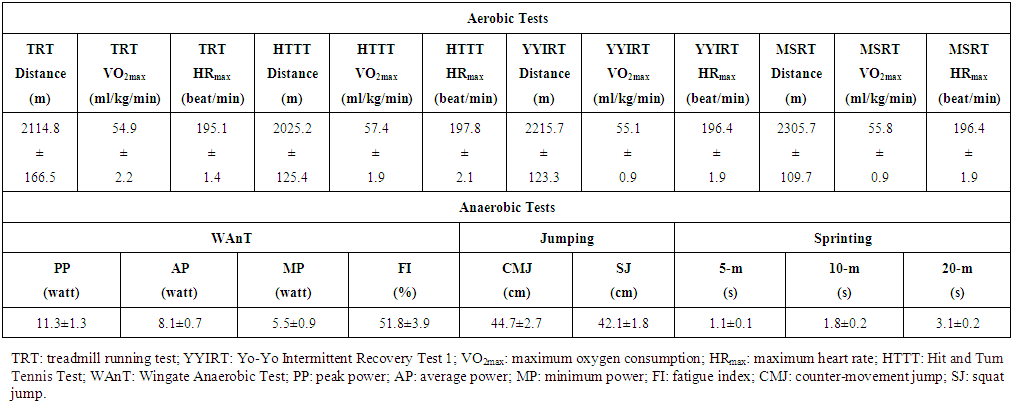 | Table 1. The results of the aerobic and anaerobic tests |
|
|
5. Discussion
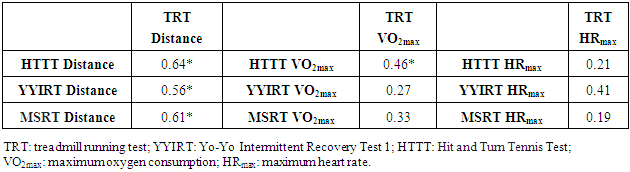
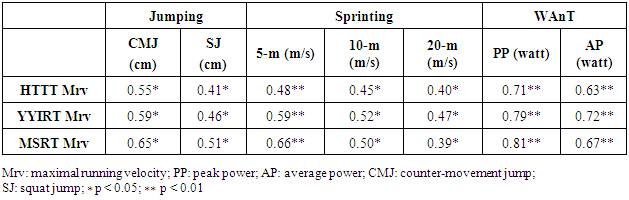
- The purposes of this study were to determine the field and laboratory aerobic tests performances and to evaluate the relationship between aerobic performances and the Wingate anaerobic test, jumping ability, sprinting ability test in professional tennis players. In accordance with our hypothesis, the main findings of the present study is that the VO2max response is higher in HTTT compared with YYIRT and MSRT, but no significantly. Previous studies have shown that treadmill and field tests running are similar or slightly different in athletes [3, 5, 23]. These differences may be explain that weather condition (temperature, humidity and wind) ground features and design of the test during laboratory and field-based tests. For example Girard et al., [3] no found any difference in VO2max responses between measured treadmill and field-based testing, but they found significant differences in the maximum work load in determining VO2max responses between laboratory and field-based conditions. Our findings are similar with those of previous study. The HTTT involves specific movements such as side steps and running then forehand and backhand stroke simulations at corner and this may causes more fatigue than the other field tests. Because of this, players have less covered distance after the HTTT compared with YYIRT and MSRT. Our players covered greater total distance in MSRT compared with YYIRT and HTTT. In contrast, Urso et al., [24] found significant higher total covered distance in the HTTT compared to MSRT in trained tennis players. Another finding of this study is that we found no significant differences in HRmax responses between HTTT, YYIRT and TRT. Heart rate (HR) monitoring is the most practical, low-cost and very common indirect method of estimating intensity of exercise, several factors can also affect HR responses in tennis [11]. In similar, many studies no found differences in HRmax response between YYIRT, TRT and MSRT [25, 26, 27]. For example, Stickland et al., [10] reported similar results with our study and they determined no differences between HRmax from the YYIRT test and that from the MSRT performance. In addition, Metaxas et al., [28] found no significant differences in HRmax values in maximal exercise tests between the 2 field and treadmill tests. These result have supported that YYIRT, MSRT and HTTT tests could be interchangeably used for determining HRmax in tennis players. The other important finding of present study is that, relationships were found between measured VO2max and distance covered in all field tests (ranging from r = 0.56-0.64; p < 0.05). Many studies have investigated the relationships between measured VO2max and distance covered in field tests such as YYIRT, MSRT and HTTT in literature. Previous studies [21, 29, 30, 31] found that YYIRT distance correlated with VO2max (ranging from r = 0.56-0.87). Ferrauti et al., [14] have previously examined the relationship between HTTT performance and VO2max, reporting a correlation between HTTT performance with measured VO2max (r = 0.79). Aslan et al., [27] have examined the relationship between YYIRT, MSRT and VO2max measured in TRT, reporting a high correlation between laboratory and field performances (r = 0.89, 0.78 respectively). In similar with the other field tests, previous studies found relationships between MSRT and VO2max measured in TRT [13, 19]. Our findings are consistent with those of previous studies. The relationship between the YYIRT, MSRT and HTTT performance and VO2max is changeable. Differences in relationship may be explained with the different training age, and surfaces of the test area and this idea supported in a study [14].The Wingate anaerobic test (WaNT) is the gold standard for evaluating anaerobic capacity [17]. We found relationships between peak power (PP) and average power (AP) measured in WaNT and maximal running velocity calculated from the covered distance in all field tests. In similar with our result, Hermassi et al., [30] found relationships between maximal running velocity measured in YYIRT, peak power and relative peak power (r = 0.80, 0.65; p < 0.01 respectively). In contrast, Karakoç et al. [21] no found between PP, AP and fatigue index (FI) as measured by the WaNT and distance covered in the YYIRT. The vertical jump ability is one of the important predictors in effective tennis performance [3, 15, 32] and it varies with their competitive level [33, 34]. In similar with the our study results, previous study showed significant correlation between the vertical jump ability and the YYIRT performance [26, 30]. Significant moderate relationship was found between maximal running velocity and vertical jump ability such as CMJ and SJ (r = 0.66, 0.60; p < 0.01 respectively). In present study, the maximal running velocity all field tests also showed significant correlations with sprinting ability tests (ranging from r = 0.39-0.66), commonly used to assess explosive force and skills in tennis [1, 2]. For example, Hermassi et al., [30] found relationships between maximal running velocity measured in YYIRT, 5-m sprint and velocity after first step time in handball players (r = 0.71, 0.73; p < 0.01 respectively). However, no found any correlation sprint performance and YYIRT level 2 performance [22]. These results have shown that jumping and sprinting have similar muscle activities and these require a agility which is very important ability for tennis players.
6. Conclusions
- Field aerobic tests performances were significantly correlated with laboratory test in tennis players. In addition, HTTT showed significant relationship with maximum oxygen consumption measured in TRT. The maximal running velocity of all field tests showed significant relationship with the WAnT, jumping and sprinting tests performances for the all tennis players. Our results suggest that HTTT is more suitable to characterize tennis players’ intermittent endurance performance and HTTT, which is practical measurement method, may provide a more effective field-based assessment of both aerobic and anaerobic performance in tennis players. It can be seen that a few number of studies have been conducted on relationships between aerobic and anaerobic performance test in tennis. Therefore, further research is needed in order to explain differences and correlation in tennis players.