-
Paper Information
- Next Paper
- Paper Submission
-
Journal Information
- About This Journal
- Editorial Board
- Current Issue
- Archive
- Author Guidelines
- Contact Us
International Journal of Sports Science
p-ISSN: 2169-8759 e-ISSN: 2169-8791
2016; 6(4): 133-137
doi:10.5923/j.sports.20160604.01

No Differences in Neuromuscular Power and Range of Motion, but Greater Muscle Soreness in Young vs Masters Athletes Following a 12km Run
 Abstract
 Reference
 Full-Text PDF
 Full-text HTML
Matthew W. Driller1, Joseph A. McQuillan1, Francisco F. S. Tavares1, 2
1University of Waikato, Hamilton, New Zealand
2Chiefs Super Rugby, Hamilton, New Zealand
Correspondence to: Matthew W. Driller, University of Waikato, Hamilton, New Zealand.
| Email: |  |
Copyright © 2016 Scientific & Academic Publishing. All Rights Reserved.
This work is licensed under the Creative Commons Attribution International License (CC BY).
http://creativecommons.org/licenses/by/4.0/

Background: The purpose of the study was to assess lower-body neuromuscular power and range of motion in young and masters recreational runners before and after a 12km run. Methods: In a straight-forward parallel group trial, participants performed a number of tests pre and post a 12km run. Participants included 36 recreational runners (mean ± SD; 12km run time: 67 ± 18 mins) and were matched on running ability and divided into two groups; young (< 35 y, n=18) and masters (> 40 y, n=18). Pre and post measures included body mass, vertical jump height (m), peak jump velocity (m.s-1), sit and reach test (cm), mean 6s cycling power (W), peak cycling power (W) and perceived muscle soreness. Results: There were no significant differences (p > 0.05) between groups for any of the measured variables pre to post run, except for muscle soreness (p < 0.01), where the young group experienced significantly higher levels of soreness, associated with a large effect size between groups (-1.03 ±0.6). Conclusions: There were no differences in neuromuscular power and range of motion between young and masters athletes following a 12km run. This was possibly due to the exercise not being a demanding enough stimulus to cause fatigue in the measures used. However, masters athletes perceived lower levels of muscle soreness pre to post run, possibly due to decreased pain perceptions with aging.
Keywords: DOMS, Aging, Running, Neuromuscular
Cite this paper: Matthew W. Driller, Joseph A. McQuillan, Francisco F. S. Tavares, No Differences in Neuromuscular Power and Range of Motion, but Greater Muscle Soreness in Young vs Masters Athletes Following a 12km Run, International Journal of Sports Science, Vol. 6 No. 4, 2016, pp. 133-137. doi: 10.5923/j.sports.20160604.01.
Article Outline
1. Introduction
- Aging involves a series of biological and physiological phenomena, therefore, responses and adaptations to exercise seem to be age-specific [1, 2]. Although structural and functional changes may occur with aging, masters endurance athletes may still maintain their ability to perform at the same level as younger athletes [3]. In relation to post-exercise recovery, older individuals demonstrate a less effective recovery rate in the hours/days following exercise [4, 5]. However, research on the effects of age on changes in pre to post muscle fatigue (e.g muscle power, soreness, flexibility) following exercise is scarce, especially when comparing young vs masters athletes matched on performance. Contradictory findings are reported in the literature comparing the effect of exercise on levels of fatigue for different age groups [4-7]. Studies that have addressed differences in fatigue between young and older subjects after an aerobic event, often opt to use longer endurance events(55km trail running and Olympic-distance triathlon) [4, 5]. The effects of exercise on immediate post-exercise muscle soreness (MS) have been extensively studied after fatigue-inducing modalities (e.g. downhill running) and mechanical protocols (e.g. isokinetic dynamometry) involving eccentric activities [8]. In terms of age-dependent responses to MS, the literature suggests that aging reduces perceived MS following exercise, meaning that MS in young subjects measured immediately after exercise is higher in comparison to both middle-aged (48 y) [9] and older subjects (70.5 y) [10, 11]. Nevertheless, studies that compare age-dependent effects of MS immediately after exercise are limited to eccentric exercise protocols, which are not always high in ecological validity as they do not mimic real-world sporting competitions. To the best of our knowledge, the age-dependent acute effects of an endurance event on MS have not yet been investigated. Furthermore, the age-dependent effects on ROM following exercise are also relatively unknown and findings are limited to upper limb eccentric exercise [9-11]. Relative to a younger population, no differences in ROM were found immediately after eccentric exercise when compared to middle-aged [9] nor older subjects [11]. Neuromuscular function and performance (NM) is often used to measure the level of fatigue imposed by a certain activity [12]. NM assessments may vary from mechanistic measures (e.g blood markers, EMG, direct current transcranial stimulation) to more functional assessments that can be performed in the field. Examples of these field tests include; jump and sprint performance [13], or the mechanical output of an activity performed over a short period (e.g. 6 s; [14]). Nevertheless, studies that compare the age-related differences in neuromuscular fatigue, typically use more controlled environments (i.e. laboratory settings) [15]. In general, a decline in NM is expected after both intermittent [16] and continuous exercise [17]. Nicol et al [17] observed significant decreases in maximal sprint velocity, assessed every 10kms during a marathon, after just 20km. Moreover, authors found no significant differences in countermovement jump performance from pre- to post-marathon [17]. To the best of our knowledge, no study has addressed the age-related differences in MS, ROM and NM immediately after a moderate-duration aerobic event lasting ~1 hour. Therefore, the purpose of this study was twofold. Firstly to observe if a 12km run was demanding enough to affect MS, ROM and NM measured by field tests. Secondly, to assess if immediate post-exercise neuromuscular power, range of motion and muscle soreness differ between young (~27 y) and masters (~50 y) recreational athletes.
2. Materials and Methods
2.1. Participants
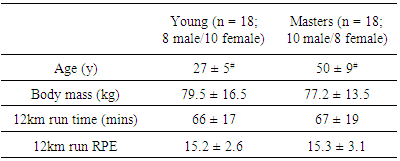
- Thirty-six recreational runners (18 male) volunteered to participate in the current study. Participants were classified according to age and grouped as young (<35 y) or masters (>40 y) athlete and peer-matched by their 12km run time. These age categories for classifying young and masters athletes were based on a summary of previous masters-athlete litereature [3]. Furthermore, the mean age and standard deviation for both groups in the current study is almost identical to that of Sultana et al [5], and therefore allows for a reasonable comparison. Participant demographics for both young and masters groups are shown in Table 1. All participants self-reported as healthy with no history of significant hip, knee or back injury. Written informed consent was obtained from each participant, and ethical approval was obtained from the Human Research Ethics Committee of the Institution.
|
2.2. Experimental Design
- In a straight-forward parallel group trial, participants performed a number of tests pre and post a 12km run. Participants were required to report to the testing facility 30-mins prior to the start time of a 12km race. Participants were instructed to perform their own self-selected warm-up prior to taking part in the pre testing. Following the pre-tests, all participants took part in an organised 12km run event at 10:00am. Immediately following the race, before warming-down, participants were instructed to return to the testing facility located at the start/finish line to perform the post-testing session.
2.3. Methodology
- Pre and post testing were performed in an identical order and consisted of five assessments: body mass, sit and reach ROM, modified squat jumps, a 6-s wattbike test and perceived ratings of muscle soreness. Body mass (kg) was assessed immediately pre and post run using laboratory-grade scales (Seca, Gmbh Hamburg, Germany) that had been calibrated according to manufacturer’s instructions. Fluid consumption during the run was ad libitum and was not monitored in the current study, therefore, accurate sweat rates could not be determined.ROM was determined using the sit and reach test. Participants sat upright on the floor with their legs extended and feet dorsiflexed and placed against a measurement box. Individual’s then reached forward with their arms extended toward or past their feet as far as possible. The distance in cm from (-) or past (+) the participant’s feet was documented. The sit and reach test is a standard and reliable test used to measure hamstring and lower back flexibility [18].Participants were then asked to perform three modified squat jumps following a single familiarisation jump, to measure lower-body neuromuscular power. Modified squat jumps involved participants performing a squat to a 90° angle, which was measured by the researcher using a handheld manual goniometer (RBMS®, USA). Participants were asked to hold the squat position for 3 ss, before performing a maximal vertical jump. This angle was selected as research has shown that squat jumps initiated from a 90° squat position have been reported to produce maximum jump height and peak velocity [20]. Data regarding the maximal jump height (m) and the peak jump velocity (m.s-1) were measured using the Gymaware software, and the best of three attempts was recorded and used for subsequent analysis. High levels of reliability and validity for the squat jump procedure [19] and Gymaware device [20], have been reported elsewhere. Thereafter a 6-s maximal test on a cycle ergometer (Wattbike) was performed as another assessment of lower-body neuromuscular power pre and post run. Following appropriate ergometer set-up for the individual, a self-selected intensity warm-up was performed for two mins before the start of the test. The 6-s test employed a seated stationary start with dominant leg initiating the first down-stroke. The air braking resistance was set to level l0, and magnetic resistance set to level 1. The test was initiated following a 5-s countdown followed by a firm verbal command. The completion of the test was indicated with another verbal command. On completion of the test, peak power (W and W.kg-1) and mean power (W and W.kg-1), were recorded for analysis. The validity of this test protocol to measure lower-body power has been described elsewhere [14].Pre and post run, athletes performed a half-squat exercise, as described by Driller & Halson [21], to promote general body awareness before rating their perceived muscle soreness on a 10-point visual analogue scale (from ‘no soreness at all’ to ‘extremely sore’). Immediately post-run, ratings of perceived exertion using the Borg’s RPE scale were also obtained from participants.
2.4. Statistical Analysis
- Statistical analyses were performed using the Statistical Package for Social Science (V. 22.0, SPSS Inc., Chicago, IL). Descriptive statistics are shown as means ± standard deviations unless stated otherwise. Magnitudes of the standardized effects were calculated using Cohen’s d and interpreted using thresholds of 0.2, 0.5, 0.8 for small, moderate and large, respectively [22]. An effect size of ±0.2 was considered the smallest worthwhile effect with an effect size of <0.2 considered to be trivial. The effect was deemed unclear if its 90% confidence interval overlapped the thresholds for small positive and negative effects [23]. A students paired t-tests was used to compare pre and post run for all measured variables for both groups. Statistical significance was set at p < 0.05 for all analyses.
3. Results
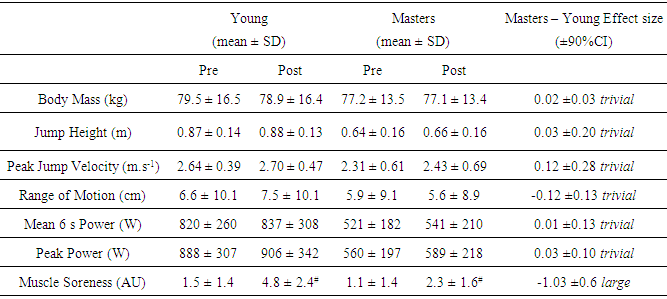
- There were no significant differences (p > 0.05) between groups for body mass, 12km run time or rate of perceived exertion during the 12km run, with the only significant difference being in age (Table 1).There were no significant differences pre to post run for both groups in any of the following measured variables; body mass, jump height, peak jump velocity, range of motion, mean 6 s power, or peak power (p > 0.05, Table 2). Furthermore, all of these variables were associated with trivial effect sizes (< 0.2) when comparisons were made between groups.Muscle soreness was significantly higher (p < 0.01) pre to post run (1.5 ± 1.4 AU to 4.8 ± 2.4 AU) in the young group and also in the masters group (1.1 ± 1.4 AU to 2.3 ± 1.6 AU). This difference between groups was associated with a large effect size (-1.03 ±0.6, Table 2), with the masters group having less increase in muscle soreness pre to post run, when compared to the young group.
4. Discussion
- The main finding from the current study was that there were no significant differences (p > 0.05) in either the masters or young recreational athletes for any of the physical measures (lower-body power and range of motion) following a 12km run. Furthermore, all differences between groups were associated with trivial effect sizes for the physical measures. Despite no changes in the physical measures, there was a significant increase in perceived muscle soreness in both groups pre to post run, with a large effect size (-1.03) when groups were compared, suggesting that young athletes had a greater increase in muscle soreness than their older counterparts.Our results demonstrate no difference between age-groups for jump height and 6 s cycling performance following exercise (Table 2). Previously, literature that has addressed differences in fatigue between young and masters athletes after an aerobic event, used longer events in comparison to the 12km run used in the current study. Easthope et al [4] found no differences in maximal isometric force and muscle properties after a 55km trail running competition between young (30.5 ± 7.0 y) and masters (45.9 ± 9.0 y) athletes. Similarly, no differences were reported by Sultana et al [5] following an Olympic triathlon on knee extensors/flexors maximal isometric torque between young (28.4 ± 6.1 y) and masters (52.4 ± 10.0 y) athletes. During an aerobic running event, the force produced during each foot-strike is low, therefore, it is expected that essentially type I muscle fibres are recruited [24]. For this reason, fatigue arising from short-duration aerobic events, like the one used in the current study, may not be detectable in explosive maximal efforts (e.g Wattbike and jump tests) that rely essentially on the contraction of type II muscle fibres [25].Significant differences between groups (p > 0.05) were found in the present study for perceived muscle soreness following a 12km run (Table 2). An increase in perceived muscle soreness after exercise is generally expected [8]. Therefore, after endurance running, immediate muscle soreness has been demonstrated after both long (e.g. marathon) [26] and short distance races (e.g. 10km race) [27]. We found a large effect (-1.03) between groups for muscle soreness, showing the young group had a greater increase in muscle soreness pre to post race (Table 2). Studies that have compared age-dependent effects of exercise on muscle soreness are limited to eccentric exercise protocols [9-11]. A decrease in perceived muscle soreness suggest that the masters group did not perceive muscle soreness to increase to the same extent as their younger counterparts pre to post run. As reviewed by Gibson & Ekme [28], pain perception is decreased with aging. Indeed, this may explain the decreased post-exercise muscle soreness that was observed in the current study. The authors acknowledge that it may have been beneficial to gain information on the training-age of participants in addition to their chronological age, as this may have provided an interesting comparison for muscle soreness. Indeed, it may be that the more experienced the runners, the less pain sensation following the run.No pre to post differences (p > 0.05) were found for either group for ROM measured by the sit and reach test after the 12km race (Table 2). These findings are in agreement with previous literature that analysed the effect of an aerobic run (60-mins on a treadmill) on sit and reach range of motion [29]. The current study found a trivial effect (-0.12) for ROM between groups (Table 2). Literature addressing age-dependent effects of exercise on ROM is also scarce and limited to eccentric exercise performed in the upper body [9, 11]. Nevertheless, similar to our findings, no differences in the ROM were found immediately following exercise when young were compared to older subjects [11]. A further finding of the current study was that our results demonstrate no significant pre to post changes in both age-groups on NM performance (jump height and peak velocity and 6 s wattbike peak and mean power) after a 12km race (Table 2). Although NM performance is expected to be reduced after exercise, the characteristics of exercise (e.g. intensity, duration, density) needs to be demanding enough to acutely reduce NM function. Specifically in running, previous literature demonstrates that NM performance may not be affected by short distance/duration aerobic events [17, 30-32]. In agreement with our findings, Nicol et al [17] reported no changes in sprinting performance (maximal velocity during last 10m of a 30m sprint) after 10 and 20km of a marathon race. However, significant differences at the 30 and 40km mark were reported by the authors [17]. Kraemer et al [30] observed no differences in the peak torque of knee extensors and flexors after a 20km race-pace performed on a treadmill. No changes in jump performance (i.e. countermovement height) between athletes were also found by Ali, Creasy, & Edge [32] after a 10km running race. Similarly, Gómez et al [31] found no differences in a group of recreational runners for countermovement vertical jump power following a 10km race.
5. Conclusions
- A somewhat novel finding of the current study was that masters athletes perceived lower levels of muscle soreness pre to post run when compared to the younger athletes. It is suggested that this is possibly due to the decrease in pain perceptions with aging and/or experience with running. Our study demonstrated that there were no differences in neuromuscular lower-body power or range of motion between young (27 ± 5 y) and masters (50 ± 9 y) athletes following a 12km run.
References
| [1] | Macaluso A, De Vito G. Muscle strength, power and adaptations to resistance training in older people. Eur J Appl Physiol. 2004; 91(4): 450–72. |
| [2] | Stratton JR, Levy WC, Cerqueira MD, Schwartz RS, Abrass IB. Cardiovascular responses to exercise. Effects of aging and exercise training in healthy men. Circulation. 1994; 89(4): 1648–55. |
| [3] | Borges N, Reaburn P, Driller M, Argus C. Age-related changes in performance and recovery kinetics in masters athletes: A narrative review. J Aging Phys Act. 2016; 24(1): 149–57. |
| [4] | Easthope CS, Hausswirth C, Louis J, Lepers R, Vercruyssen F, Brisswalter J. Effects of a trail running competition on muscular performance and efficiency in well-trained young and master athletes. Eur J Appl Physiol. 2010; 110(6): 1107–16. |
| [5] | Sultana F, Abbiss CR, Louis J, Bernard T, Hausswirth C, Brisswalter J. Age-related changes in cardio-respiratory responses and muscular performance following an Olympic triathlon in well-trained triathletes. Eur J Appl Physiol. 2012; 112(4): 1549–56. |
| [6] | Lanza IR, Russ DW, Kent-Braun J a. Age-related enhancement of fatigue resistance is evident in men during both isometric and dynamic tasks. J Appl Physiol. 2004; 97(3): 967–75. |
| [7] | Stackhouse SK, Stevens JE, Lee SC, Pearce KM, Snyder-Mackler L, Binder-Macleod S a. Maximum voluntary activation in nonfatigued and fatigued muscle of young and elderly individuals. Phys Ther. 2001; 81(5): 1102–9. |
| [8] | Cheung K, Hume PA, Maxwell L. Delayed onset muscle soreness: Treatment strategies and performance factors. Sport Med. 2003; 33(2): 145–64. |
| [9] | Lavender AP, Nosaka K. Changes in markers of muscle damage of middle-aged and young men following eccentric exercise of the elbow flexors. J Sci Med Sport. 2008; 11(2): 124–31. |
| [10] | Lavender A, Nosaka K. Responses of old men to repeated bouts of eccentric exercise of the elbow flexors in comparison with young men. Eur J Appl Physiol. 2006; 97(5): 619–26. |
| [11] | Lavender AP, Nosaka K. Comparison between old and young men for changes in makers of muscle damage following voluntary eccentric exercise of the elbow flexors. Appl Physiol Nutr Metab. 2006; 31: 218–25. |
| [12] | Halson SL. Monitoring Training Load to Understand Fatigue in Athletes. Sport Med. 2014; 44(sup2): S139–47. |
| [13] | Gathercole R, Sporer B, Stellingwerff T, Sleivert G. Comparison of the Capacity of Different Jump and Sprint Tests to Detect Neuromuscular Fatigue. J Strength Cond Res. 2015; 29(9): 2522–31. |
| [14] | Herbert P, Sculthorpe N, Baker J, Grace FM. Validation of a Six Second Cycle Test for the Determination of Peak Power Output. Res Sport Med. 2015; 23: 115–25. |
| [15] | Allman BL, Rice CL. Neuromuscular fatigue and aging: Central and peripheral factors. Muscle and Nerve. 2002; 25(6): 785–96. |
| [16] | Girard O, Lattier G, Maffiuletti NA, Micallef JP, Millet GP. Neuromuscular fatigue during a prolonged intermittent exercise: Application to tennis. J Electromyogr Kinesiol. 2008; 18(6): 1038–46. |
| [17] | Nicol C, Komi P V, Marconnef P. Changes in muscle force and stiffness characteristics I. Changes in muscle force and stiffness characteristics. Scand J Med Sci Sport. 1991; 1(1): 10–7. |
| [18] | Lemmink KAPM, Han K, De Greef MHG, Rispens P, Stevens M. Reliability of the Groningen Fitness Test for the Elderly. Vol. 9, Journal of Aging and Physical Activity. 2001. p. 194–212. |
| [19] | Markovic G, Dizdar D, Jukic I, Cardinale M. Reliability and factorial validity of squat and countermovement jump tests. J Strength Cond Res. 2004; 18(3): 551–5. |
| [20] | Hori N, Andrews W. Reliability of velocity, force and power obtained from the Gymaware optical encoder during countermovement jump with and without external loads. J Aust Strength Cond. 2009; 17: 12–7. |
| [21] | Driller MW, Halson SL. The effects of lower-body compression garments on recovery between exercise bouts in highly-trained cyclists. J Sci Cycl. 2013; 2(1): 45–50. |
| [22] | Cohen J. Statistical Power Analysis for the Behavioral Sciences. Vol. 2. Hillsdale, NJ: Lawrence Earlbaum Associates; 1988. |
| [23] | Batterham AM, Hopkins WG. Making meaningful inferences about magnitudes. Int J Sports Physiol Perform. 2006; 1(1): 50–7. |
| [24] | Henneman E, Somjen G, Carpenter D. Functonal significance of cell size in spinal motoneurons. J Neurophysiol. 1965; 28: 560–80. |
| [25] | Smith JL, Betts B, Edgerton VR, Zernicke RF. Rapid ankle extension during paw shakes: selective recruitment of fast ankle extensors. J Neurophysiol. 1980 Mar 1; 43(3): 612–20. |
| [26] | Shanely RA, Nieman DC, Zwetsloot KA, Knab AM, Imagita H, Luo B, et al. Evaluation of Rhodiola rosea supplementation on skeletal muscle damage and inflammation in runners following a competitive marathon. Brain Behav Immun. Elsevier Inc.; 2014; 39: 204–10. |
| [27] | Ali A, Creasy RH, Edge JA. Physiological effects of wearing graduated compression stockings during running. Eur J Appl Physiol. 2010;109(6):1017–25. |
| [28] | Gibson SJ, Helme RD. Age-related differences in pain perception and report. Clin Geriatr Med. Elsevier; 2001;17(3):433–56. |
| [29] | Mojock CD, Kim J-S, Eccles DW, Panton LB. The effects of static stretching on running economy and endurance performance in female distance runners during treadmill running. J Strength Cond Res. 2011; 25(8): 2170–6. |
| [30] | Kraemer WJ, Noble SJ, Fleck BJ. Muscle strength and endurance following long distance treadmill running. J Hum Muscle Perform. 1991; 1(3): 32–9. |
| [31] | Gómez AL, Radzwich RJ, Denegar CR, Volek JS, Rubin MR, Bush J a, et al. The effects of a 10-kilometer run on muscle strength and power. J Strength Cond Res. 2002; 16(2): 184–91. |
| [32] | Ali A, Creasy RH, Edge J a. The effect of graduated compression stockings on running performance. J Strength Cond Res. 2011; 25(May): 1385–92. |