-
Paper Information
- Paper Submission
-
Journal Information
- About This Journal
- Editorial Board
- Current Issue
- Archive
- Author Guidelines
- Contact Us
International Journal of Sports Science
p-ISSN: 2169-8759 e-ISSN: 2169-8791
2015; 5(5): 201-208
doi:10.5923/j.sports.20150505.05
Indicators of Anaerobic Capacity and Muscular Performance in Malay Female Athletes and Non-Athletes with ACE Gene I/D Polymorphism
 Abstract
 Reference
 Full-Text PDF
 Full-text HTML
Xiao Li1, Foong Kiew Ooi1, Bin Alwi Zilfalil2, 3, Surini Yusoff2, 3
1Sports Science Unit, School of Medical Sciences, Universiti Sains Malaysia, Kubang Kerian, Kelantan, Malaysia
2Department of Paediatrics, School of Medical Sciences, Universiti Sains Malaysia, Kubang Kerian, Kelantan, Malaysia
3Human Genome Center, School of Medical Sciences, Universiti Sains Malaysia, Kubang Kerian, Kelantan, Malaysia
Correspondence to: Foong Kiew Ooi, Sports Science Unit, School of Medical Sciences, Universiti Sains Malaysia, Kubang Kerian, Kelantan, Malaysia.
| Email: |  |
Copyright © 2015 Scientific & Academic Publishing. All Rights Reserved.
Purpose: The aim of our study was to examine the association between the ACE I/D polymorphism, muscular strength and power, anaerobic capacity and fatigue index (FI) of athletes and non-athletes in Malay female population. Methods: Thirty three Malay female athletes who were university representative in Malaysia, and 33 Malay non-athletes were recruited in this study (aged 18-25 years old). Participants’ hand grip strength and back and leg strength tests were performed. Meanwhile standing long jump power test was performed to estimate leg explosive power. Additionally, participants’ Wingate mean power, peak power, anaerobic capacity, anaerobic power and FI were measured via Wingate test. Results: The frequency of II, ID and DD genotypes among athletes was 21.2% (n=7), 63.6% (n=21) and 15.2% (n=5) respectively, while that among non-athletes was 48.5% (n=16), 39.4% (n=13) and 12.1% (n=4) respectively. Athletes with ID genotype showed statistically significant greater jumping distance as indicator of explosive leg power compared to athletes with DD genotype (154.8 ± 16.6 cm versus 130.0 ± 23.8 cm, p=0.034). In athletes with DD genotype, it was found that there was statistically significant lower FI when compared to athletes with II and ID genotypes respectively (DD genotype: 6.3 ± 2.0 Watt·sec-1; II genotype: 9.6 ± 1.8 Watt·sec-1; ID genotype: 9.6 ± 1.4 Watt·sec-1, p<0.01). Conclusions:The present study findings showed that ACE ID genotype is related to greater jump power andDD genotype is related to lower FI in Malay female athletes.
Keywords: ACE I/D polymorphism, Physical fitness, Anaerobic capacities, Power, Fatigue index, Malay
Cite this paper: Xiao Li, Foong Kiew Ooi, Bin Alwi Zilfalil, Surini Yusoff, Indicators of Anaerobic Capacity and Muscular Performance in Malay Female Athletes and Non-Athletes with ACE Gene I/D Polymorphism, International Journal of Sports Science, Vol. 5 No. 5, 2015, pp. 201-208. doi: 10.5923/j.sports.20150505.05.
Article Outline
1. Introduction
- Genetic predisposition has great implications in the characterization of an individual as a great athlete apart from the specific training and nutritional follow-up factors [1]. Studies of genes that influence human physical performance show a strong heritability of key endurance and strength phenotypes. Endurance phenotypes include maximal oxygen uptake, lactate threshold and economy movement, while strength phenotypes consist of muscle strength and sprint performance [2]. Meanwhile, genetic factors determine 20-80% of the variations in a wide variety of traits that is relevant to athletic performances such as the relative proportion of fast and slow fibers in skeletal muscle [3]. One popular gene that has been associated with the tendency of individual towards sports is Angiotension I-Convertion Enzyme (ACE) gene. ACE is encoded by the ACE gene located on chromosome 17 at position q23.3. The size of the gene is 44,778 bases, with 21 kb contains 26 exons and 25 introns. There are two forms of ACE in human, the production of which depends on whether it is encoded by somatic ACE (sACE) or germinal or testicular ACE (gACE) [4, 5]. Somatic ACE is the longer form of ACE in human which is transcribed from exons 1-12 and 14-26, while germinal ACE (shorter form) is transcribed from exons 13-26 [6, 7]. The D allele has been shown to be associated with increased sprinter performance and muscle powers based on a research conducted by Woods et al. [8] on short distance swimmers. This allele was also found to be related to an increase in the strength of the quadricipital thigh muscle in response to nine-week isometric strength training [9, 10]. Amir et al. [11] found the overrepresentation of the ACE gene D allele and DD genotype among elite Israeli marathon athletes. Similar finding was also reported by Tobina et al. [12]. They noted that the DD genotype was significantly higher than the II genotype amongst the Japanese athletes, and the average running speed was significantly higher for athletes with the combined DD and ID genotypes than those with the combined II genotype.It is very intricate and complex to become an elite athlete. Many gene variants that influence physical performance in one population might not have the same effect in another. The genotype and phenotypic variance exists in different ethnicities and populations. For example, discernable deviations can be observed in the genetic profiles of individuals within a less genetically heterogeneous ancestry, e.g., among Europeans and Han Chinese [13]. Most countries are mixture of different races, caused by history of migration centuries ago. Any genetic analysis with different ethnic groups might lead to misleading results. Malaysia is also a country with multi-ethnic population. In this country, there are three main ethnicities, which are Malay, Chinese and Indian. There are a total of 14 sub-ethnic groups consisted in Malay ethnicity, namely, Melayu Kelantan, Minang, etc [14]. To date, to our knowledge, there are no studies focusing on the athletic performance and genetic factors among Malaysian population and various sub-ethnic groups. Additional, no study has been performed to investigate ACE I/D polymorphism in Malay female athletes in Malaysia, and no study has investigated the association between the ACE I/D genotypes, muscular strength and explosive power, and anaerobic power in this population. Hence, the present study was designed to address the paucity of this information. We hypothesized that muscular strength and explosive power, anaerobic capacity, and fatigue index could be associated with the ACE I/D genotypes in Malay population, and the present study aimed to investigate the association between this polymorphism, muscular strength and power, and anaerobic-orientated phenotypes among Malay female athletes.
2. Methods
2.1. Study Participants
- Thirty-three well-trained female athletes, who represented sports events at least university level in Malaysia (handball, n=11; netball, n=11; softball n=11), and 33 healthy non-athlete female controls volunteered for the study. All participants were with age ranging from 18 to 25 years old. The participants were Malays who resided in Malaysia with at least three generations in peninsula Malaysia, and with family history without any admixture or inter-marriage. A detailed questionnaire concerning medical condition, family history, lifestyle and training habits was answered by each participants. Subsequently, consent forms were obtained from all the participants. This study was approved by the Research and Human Ethics Committee of Universiti Sains Malaysia (USM). The sample size in the present study was determined according to Jayapalan et al. [15] by considering a study power of 80%, 0.05 probability of type I error, and a dropout rate of 10%.
2.2. Measurement of Anthropometric Parameters
- Participants’ anthropometric parameters, i.e. body weight and height were measured in this study. All participants’ body weight (kg) and height (m) were measured in light clothing without shoes (Seca 220, Hamburg, Germany). The results of body weight and height were recorded to the nearest 0.5 kg and 0.01 m, respectively.
2.3. Measurement of Anaerobic Power and Strength
2.3.1. Hands Grip Strength Test
2.3.2. Back and Leg Strength Test
- A back and leg dynamometer (Takei TKK 1858, Tokyo, Japan) was used for measuring back and leg strength (kg). Participant was instructed to stand on the bar with back kept straight, the knees bent at about 120 degrees, and the feet were shoulder-width apart. The length of the chain was changed and adjusted in order to ensure participant felt comfortable for meeting the above requirements. Then participant was required to grip the chain handle with head held upright and pulled the chain attached to the dynamometer as hard as possible. Once this was done, the strength of the back and leg was read from the scale. Three attempts were repeated for each subject with scale to zero every time. The best of three attempts was recorded and used for reflecting back and leg strength.
2.3.3. Standing Long Jump (SLJ) Power Test
- The participant was instructed to stand on a non-slip rubber mat with feet together and toes behind a line. A maximum jump off with the feet together was performed by the participants. Participant was required to land on both feet simultaneously with the heels landed at approximately even position, and another trial was permitted if the subject lost balance and fell backward. Three successful jumps were required to be performed, and the jump distances were measured and recorded to the back heel mark. The best result of three jumps was recorded and used for reflecting standing long jump explosive power.
2.3.4. Wingate Anaerobic Capacity Test
- In Wingate anaerobic capacity test, participants performed a 30-second cycling on a mechanically braked cycle ergometer (H-300-R Lode, Groningen, Holland) at maximal propelling speed [17]. Participant was seated comfortably on a cycle ergometer with friction-loaded flywheel. Each participant was weighed before the test and a resistance workload was calculated at 85 g per kg of body weight. After completing a 1 minute warm-up at 60 rpm using low aerobic workload (50 Watt), participants were instructed to increase their pedaling frequency to as fast as possible. At the signal “Go”, the participant began to pedal maximally. When the participant’s cadence reached their highest rpm at no resistance, the electromagnet released the weight pan and the 30-second test began. Verbal encouragement was provided to motivate the participant to pedal at a maximal effort throughout the duration of the test. Mean power and peak power throughout the 30-second test were recorded. Following the completion of the Wingate test, participants cycled at a low aerobic workload (25-100 Watt) for 2-5 minutes as an active recovery [17-20].
2.4. DNA Isolation and Genotyping
- Genomic DNA was isolated from the whole blood of the participants by using EasyPure Genomic DNA Kit (TransGen Biotech, Beijing, China), according to the manufacturer’s protocol. Genotyping was performed by using polymerase chain reaction-restriction fragment length polymorphism (PCR-RFLP) method. For ACE I/D polymorphism, the primer pair used for amplification was 5’- CTG GAG ACC ACT CCC ATC CTT TCT -3’ and 5’- GAT GTG GCC ATC ACA TTC GTC AGA -3’,which yielded a product of 490 bp or 190 bp. The PCR amplification was carried out in 25 µL reactions containing 40 ng genomic DNA, 0.2 µM each of forward and reverse primers, 1 X PCR buffer II, 2.0 mM MgCl2, 0.2 mM dNTP mix, and 1 U TaqDNA Polymerase. The PCR process comprised an initial denaturation at 95°C for 5 min, 35 cycles of denaturation (95°C, 30 sec), annealing (58°C, 30 sec) and extension (72°C, 1 min), and a final extension at 72°C for 1 min. As the D allele was preferentially amplified in individuals having the heterozygous genotype, samples which showed DD genotype in the above amplification was subjected to a second insertion specific PCR in order to avoid a misclassification of ID heterozygotes as DD homozygotes [21]. The insertion-specific primer pair used for ACE I/D polymorphism was 5’- TGG GAC CAC AGC GCC CGC CAC TAC - 3’ and 5’ - TCG CCA GCC CTC CCA TGC CCA TAA - 3’, and only the allele I of ACE gene produced a 335 bp amplicon. The second PCR comprised an initial denaturation at 95°C for 5 min, 35 cycles of denaturation (95°C, 30 sec), annealing (64°C, 30 sec) and extension (72°C, 1 min), and a final extension at 72°C for 1 min. The product was identified on a 1.5% agarose gel stained with the GelStain (TransGen Biotech, Beijing, China). The reaction yielded no products for samples with DD genotype. Fifteen PCR products which included different ACE I/D genotypes were randomly selected for sequencing.
2.5. Statistical Analysis
- Statistical analysis was performed by using SPSS version 22. Chi-square test was used to compare genotype and allele frequencies, and to test for the presence of Hardy-Weinberg equilibrium among genotypes. All data were presented as mean ± standard deviation, unless otherwise stated. Independent t tests were used for comparisons of physical characteristics and fitness parameters between all athletes and non-athletes, and also for comparisons of all measured parameters between athletes and non-athlete groups with same genotype. One way analysis of variance (ANOVA) was used for comparison among groups with different genotypes. Statistical significance was accepted at P < 0.05.
3. Results
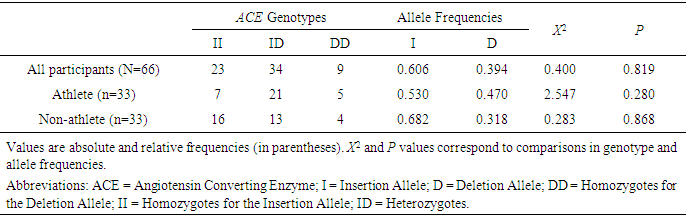
- The distribution of the polymorphic genotypes and alleles are shown in Table 1. Among the 66 participants with mean age 21.1 ± 1.4 years old recruited in this study, the frequency of II, ID and DD genotypes was 34.9% (n=23), 51.5% (n=34) and 13.6% (n=9) respectively. The frequency of I and D alleles was therefore 0.606 and 0.394 respectively. The distribution of the genotypes among all participants was in agreement with the Hardy-Weinberg equilibrium (χ2 = 0.400, P = 0.819). The frequency of II, ID and DD genotypes among female athletes was 21.2% (n=7), 63.6% (n=21) and 15.2% (n=5) respectively, while those among female non-athletes was 48.5% (n=16), 39.4% (n=13) and 12.1% (n=4) respectively. In athletes and non-athletes, the frequency of the I allele was 0.530 and 0.682 respectively, and that of the D allele was 0.470 and 0.318 respectively. No significant differences were found in genotype and allele frequencies among athletes and non-athletes (athlete: χ2 = 2.547, P = 0.280; non-athlete: χ2 = 0.283, P = 0.868).
|
|
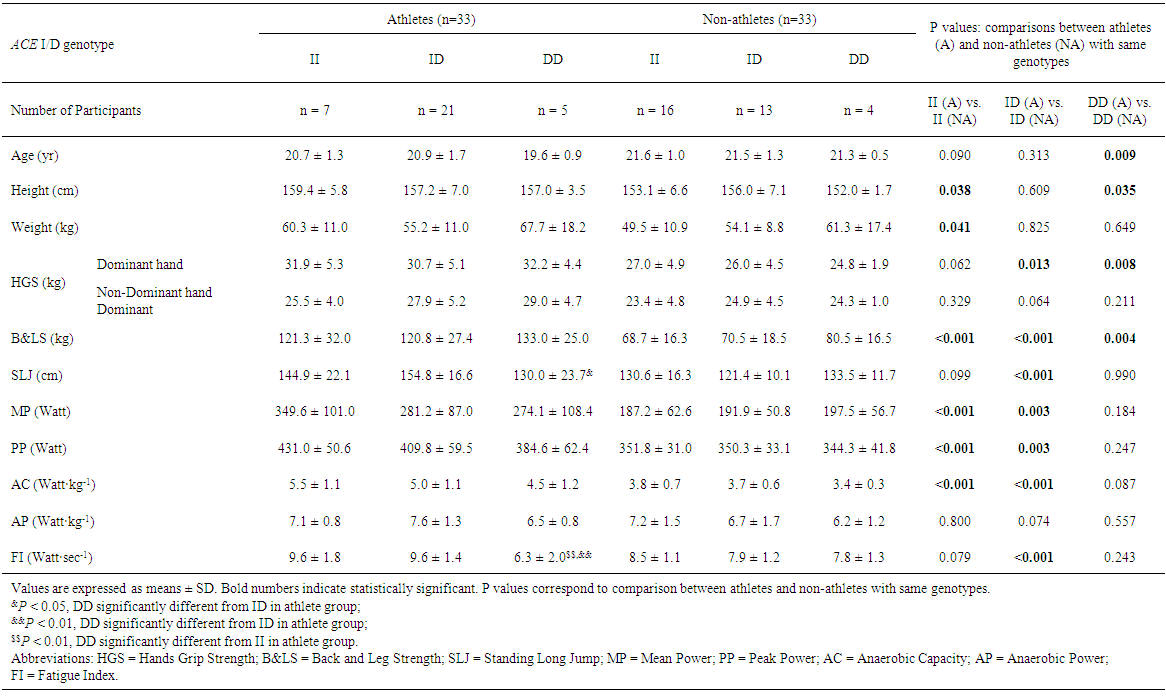 | Table 3. Comparisons of physical characteristics and fitness components according to ACE I/D genotypes in athletes and non-athletes |
4. Discussion
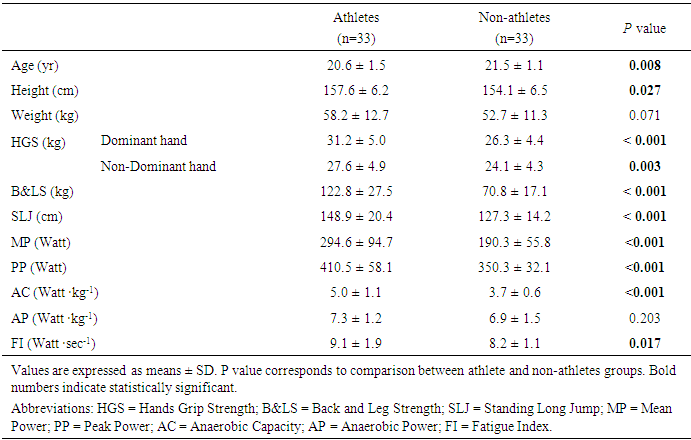
- The main finding of the present study was that athletes with ID genotype showed a statistically significantly greater standing long jumping distance compared to athletes with DD genotype. It is known that results of standing long jump power test are usually regarded as an indicator of leg explosive power in sport science researches [22, 23]. The finding of the present study on association between the ACE ID genotype and leg explosive power was in agreement with a previous study, which also reported that there was an association between ACE ID genotype and leg power in rugby union players [24]. In several previous studies, the associations between ACE II and DD genotypes and muscular strength or power have been reported [25-27]. Meanwhile, association between these genotypes with muscle mass [28, 29] as well as response of muscles to strength training have also been reported. It has been suggested that ACE D allele might influence muscle activities by Reneland and Lithell [30], and Folland et al. [9] also mentioned that ACE D allele to be associated with the muscular strength gains and skeletal muscle hypertrophy. Regarding muscular strength, the present study found that athletes showed statistically significant greater values in handgrip strength and back and leg strength compared to non-athletes generally. Nevertheless, associations between ACE I/D polymorphism and muscular strength parameters were not observed, in which statistically significant differences in muscular strength parameters were not found among neither athletes nor non-athletes with different genotypes. Numerous conflicting results on relationship between ACE genotype and muscle phenotypes have been reported in several previous studies. Woods et al. [31] reported that there was lack of significant association between ACE gene I/D polymorphism and muscular strength. Similar results were also reported in some of the much larger cohorts whose populations were quite heterogeneous, which involved males and females, mixed ethnicity, and active and non-active participants. For instances, Frederiksen et al. [32] compared 684 older male and female Caucasian Danish Twins, and did not find any ACE genotype influence on isomeric hand grip strength. Additionally, in a larger population study on the influence of ACE genotype on human strength carried out by Moran et al. [33] with 1027 participants, i.e. 543 male and 484 female Greek teenagers, it was found that there was no association between ACE genotypes and hand grip strength in males, however there was association between ACE II genotype and hand grip strength in females. Their study findings imply that gender may play a role in influencing muscular characteristics. The discrepancy between Moran et al. [33] and the present study finding of no association between ACE genotype and hand grip strength in neither female athletes nor non-athletes can be due to differences in ethnicity and number of participants.Anaerobic performance can be evaluated via Wingate test with its indices such as peak power, mean power and fatigue index [34]. Energy production is primarily anaerobic lactic (approximately 70%), with anaerobic alactic (approximately 15%), and aerobic (approximately 15%) contributions during the Wingate test [35]. In this test, one’s peak power is the highest mechanical power output achieved in 5 seconds, while mean power is the average power which can be maintained throughout the six 5-second segments. Meanwhile, one’s fatigue index is derived from the formula with peak power divided by the time to reach peak power. Results obtained from Wingate test represent the maximal capacity of the adenosine triphosphate and creatine phosphate (ATP-CP) systems to produce ATP. The present study found that in general, athletes exhibited statistically significant greater values of mean power, peak power and anaerobic capacity than non-athletes. However, associations between ACE I/D polymorphism and these few anaerobic fitness parameters were not evident. This is based on our observations that statistically significant differences in mean power, peak power and anaerobic capacity were not found among neither athletes nor non-athletes with different genotypes. The limitation of the present study is that participants in the athletes group consisted of 33 university representatives in different sport events such as handball, netball and softball. The heterogeneous composition of those participants may have affected the present study results.Another notable finding in the present study was that athletes with DD genotype showed a statistically significant lower fatigue index which was measured via anaerobic Wingate test compared to athletes with II and ID genotypes. Plowman and Smith [36] mentioned that individuals with a higher fatigue index are less able to sustain the workload and maintain their power output over the 30-second test duration due to neuromuscular fatigue. In other words, participants with a lower fatigue index show better anaerobic performance. Our findings showed that athletes with DD genotype have lower fatigue index which reflects better anaerobic fitness, and this observation of DD genotype was in agreement with the finding reported by Cam et al. [37]. To date, ACE D allele and DD genotype have been assessed for the relationship with muscular strength in numerous previous studies [22, 23], however studies which investigated the association between ACE I/D polymorphism and Wingate anaerobic capacities are limited. To our knowledge, this is the first study to assess the association between ACE gene I/D polymorphism and Wingate anaerobic capacities in the Southeast Asian population.
5. Practical Applications
- The findings obtained from this study can be used to guide the decisions of sports bodies, coaches and athletes in talent identification in Malaysia, as well as in Southeast Asian countries, and help the formulation of training programs that can maximise an individual’s potential especially those from Malaysian ethnic groups.
6. Conclusions
- In conclusion, the present study findings showed that ACE DD genotype is related to lower fatigue index, and ID genotype is related to greater jump power in Malay female athletes. Further studies are required to consider the influence of gender and different sport events on the association between ACE polymorphism and muscular strength, power, as well as anaerobic capacities in Southeast Asian population.
ACKNOWLEDGEMENTS
- This work was supported by Universiti Sains Malaysia Short Term Grant (Grant No: 304/PPSP/61312051) provided by Universiti Sains Malaysia. The authors would like to thank AP. Dr. Chen Chee Keong, Ms. Jamaayah bt Meor Osman, Ms. Norlida Azalan, Mr. Muhamad Hanapi Muhamad Hussaini, Ms. Nur Hafizah Hamzah, Ms Nor Aini Sudin and Ms Parimalah Velo from Sports Science Unit, and Mr. Tan Shing Cheng from Human Genome Center, Universiti Sains Malaysia, for their assistance in this study.