-
Paper Information
- Paper Submission
-
Journal Information
- About This Journal
- Editorial Board
- Current Issue
- Archive
- Author Guidelines
- Contact Us
International Journal of Sports Science
p-ISSN: 2169-8759 e-ISSN: 2169-8791
2015; 5(5): 192-200
doi:10.5923/j.sports.20150505.04
Muscle Strength Assessment of Knee Flexors and Extensors. Comparative Study between Basketball, Football, Handball and Volleyball Athletes
 Abstract
 Reference
 Full-Text PDF
 Full-text HTML
Jorge Teixeira 1, Paulo Carvalho 2, Camilo Moreira 3, Ana Carneiro 4, Rubim Santos 5
1Center of Movement Studies and Human Activity, Superior School of Health Technology of Porto, Polytechnic Institute of Porto, Vila Nova de Gaia, Portugal (Physiotherapist, MSc)
2Scientific Technical Area of Physiotherapy, Superior School of Health Technology of Porto, Polytechnic Institute of Porto, Vila Nova de Gaia, Portugal (Physiotherapist, MSc)
3Scientific Technical Area of Physiotherapy, Superior School of Health Technology of Porto, Polytechnic Institute of Porto, 4400-330, Vila Nova de Gaia, Portugal (Physiotherapist, MSc)
4Private practice (Physiotherapist)
5Center of Movement Studies and Human Activity, Superior School of Health Technology of Porto, Polytechnic Institute of Porto, Vila Nova de Gaia, Portugal (Physicien, PHd)
Correspondence to: Jorge Teixeira , Center of Movement Studies and Human Activity, Superior School of Health Technology of Porto, Polytechnic Institute of Porto, Vila Nova de Gaia, Portugal (Physiotherapist, MSc).
| Email: |  |
Copyright © 2015 Scientific & Academic Publishing. All Rights Reserved.
Muscle strength of lower limbs is considered a key factor in handball, basketball, football and volleyball athletes’ performance, as support of specific motor skills and actions. One of the methods used to assess muscle strength is isokinetic dynamometry. Objective: This study aims to describe and compare the isokinetic profile of professional athletes in various sports and to analyze the relationship with the practiced sport. Methods: Through an observational, analytical and cross-sectional study were assessed 86 athletes (Handball=14; Basketball=27; Football=25; Volleyball=20) using an isokinetic dynamometer Biodex Medical System® 4. The assessed parameters were Peak Torque and Peak Torque to Body Weight at angular velocities of 60°/s (4 repetitions) and 180°/s (6 reps). Results: The basketball, football and volleyball athletes had higher Peak Torque and Peak Torque to Body Weight values in the dominant member in comparison to the non-dominant. Comparing sports, athletes from basketball and volleyball had higher values of Peak Torque in the Quadriceps of the dominant limb at 180°/s. Football players had Peak Torque and Peak Torque to Body Weight values higher than other sports in both members and angular velocities. Conclusions: The results seem to suggest that, in different sports, some muscle groups are more required than others.
Keywords: Sports, Muscle Weakness, Muscle Strength Dynamometer, Isokinetic Evaluation
Cite this paper: Jorge Teixeira , Paulo Carvalho , Camilo Moreira , Ana Carneiro , Rubim Santos , Muscle Strength Assessment of Knee Flexors and Extensors. Comparative Study between Basketball, Football, Handball and Volleyball Athletes, International Journal of Sports Science, Vol. 5 No. 5, 2015, pp. 192-200. doi: 10.5923/j.sports.20150505.04.
Article Outline
1. Introduction
- Competitive sports are becoming increasingly popular, simultaneously faster with a higher movement intensity and greater number of matches [1], [2]. Sports such as handball, basketball, football and volleyball require a greater usage of the lower limbs to perform the motor skills demanded from them [3], [4]. In football, quadriceps play an extremely important role in the execution of specific motor skills like shoot and pass [5], [6]. In handball, basketball and volleyball, this muscle is essential to perform vertical jumps, widely used in offensive and defensive actions [3], [7], [8]. Moreover, the hamstrings control the running activities and are needed in situations involving changes of direction or tackling the opponent, playing an equally important role in the stability of the knee joint [9-11]. The isokinetic assessment has proven to be a reliable tool for the assessment and measurement of the muscular function and its pathologies. The isokinetic instrumentation allows adapting both the resistance and range of motion to particular rehabilitation cases. It also allows to assess the amount of force or torque that a particular muscle or muscle group produces, and restores the same amount of force after an injury [5], [12-15].The functional pattern of strength is usually expressed in terms of Peak Torque (PT). However, if the goal is to compare individuals with different body mass it is pertinent to use Peak Torque to Body Weight (PTBW), since it corresponds to a more functional value as it represents the ratio of muscle strength and the subject’s body weight [1], [12], [16]. Having recognised the importance of the lower limb muscle groups in the athlete’s performance, many studies have been developed in the last decade with various objectives, always trying to achieve a better knowledge and understanding of its relevance[3-5], [17]. Thus, the measurement of lower limbs’ muscle strength has become a common practice not only in the assessment of training programs, but also as muscle imbalances screening tool, particularly associated with the occurrence of muscle-tendon injuries and rehabilitation after periods of inactivity motivated by injuries [13], [18].However, the absence of consensus among isokinetic studies assessing athletes from different sports requires more research in this area, since the various studies uses several different equipment’s and protocols for the isokinetic evaluation. Like different angular velocities, repetitions, ways of stabilizing the athlete [8], [18]. It is also important to understand the dominance of the dominant limb over the non-dominant, because it is a controversial subject. Some studies have been reported this dominance in football and volleyball, and others found no differences in basketball and volleyball [4], [11], [19], [20]. These points makes studies that address this subject relevant. Therefore, the main objective of this study was to describe and compare the isokinetic profiles of muscle strength in professional handball, basketball, football and volleyball athletes by analysing the PT and PTBW.
2. Methods
- This study is characterised as being of observational, analytical and cross-sectional typology. The study sample was formed by 86 male individuals, divided according to the practiced sport (14 1st division Handball athletes, 25 of Zon Sagres Football League, 27 of the Portuguese Basketball League and 20 of the A1 Volleyball Portuguese National Championship (Image 1).Were defined as inclusion criteria: athletes aged between 18 and 32 years who practice sports for at least five years at a rate of 6 to 7 training sessions per week and a weekly session of strength training [4]. Were excluded Individuals who showed: (1) any injury in the moment of the assessment (pain, swelling and inflammation) or in rehabilitation of the lower limbs [1], [21]; (2) history of surgery and instability on the lower limbs [3], [22]; (3) pain sensation during the isokinetic assessment [12], [21]; and (4) any limitation that could affect the performance or the measurements during the study [22].The demographic (age) and the anthropometric data (weight and height) of the participants are described in table 1, separated by the respective sports.
|
 , standard deviation (S), median (me), interquartile deviation (ID), minimum, maximum, p value and F)
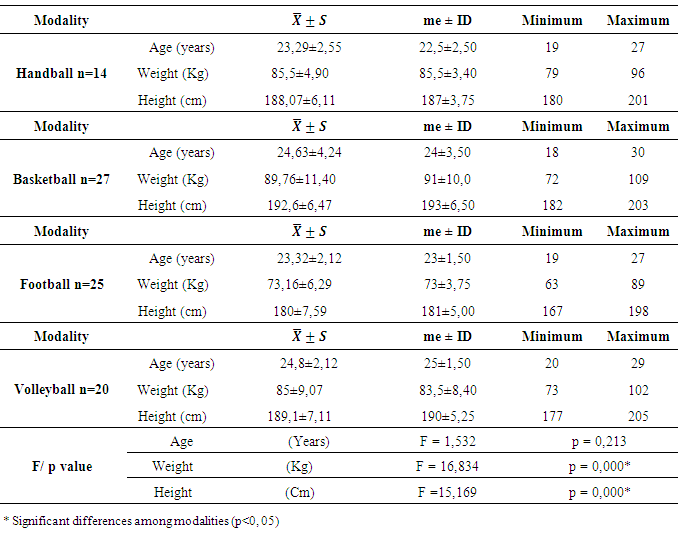
2.1. Instruments
- The isokinetic dynamometer Biodex System 4® (Biodex Medical Systems, Inc., Shirley, NY, EUA) was used for the assessment of the variables Peak Torque and Peak Torque to Body Weight. This instrument was tested and validated for the quantitative mechanical assessment of muscular performance, showing also high reliability [23].Regarding the anthropometric measurements, to assess the body mass was used the digital scale Soehnle Fitness Scale 7850® (Soehnle Professional GmbH & Co., established in Backnang, Alemanha). Moreover, to measure height was used stadiometer Seca 214® (Seca, established in Vila Verde, Sintra, Portugal).
2.2. Procedures
- Previously to the assessment, it was determined the dominant limb of each participant according to the protocol of Iga et al. [24] having been questioned the preferred limb used to shoot a ball or to perform a drop jump. Next, the athletes performed a 5 minute warm-up in a Monark Ergomedic 894E Peak Bike® (Monark Sports and Medical, established in Sweden), with a load equivalent to 2% of the body weight and subsequently, stretching exercises were performed for the involved muscles in 4 series with a duration of 20 seconds each [5], [11].Afterwards, participants were placed on the dynamometer’s chair (image 1) with a 100º inclination and the drive shaft of the equipment was aligned by sight with the lateral epicondyle of the femur. The resistance application point was placed at the level of the tibia malleolus (about 2cm above), to eliminate the influence of the athletes height. The subjects were stabilised at the level of the torso, pelvis and thigh (distal 1/3) to avoid compensatory movements [5], [11], [21]. Knee motion range was set at 100º of flexion to active maximum extension. Before starting the test, athletes performed three previous sub-maximum repetitions to get familiarised with the procedures. During the test, the athletes performed 4 maximum repetitions of knee flexion and extension in the concentric-concentric mode at 60º/s and 6 repetitions at a speed of 180º/s [9], [12]. The gravitational factor of the dynamometer lever arm and the leg weight was calculated by the dynamometer and was automatically compensated during the measurements [1], [5], [20].This procedure was performed bilaterally, and the choice of the first limb to be tested was random [11]. All athletes received verbal stimulation during the assessment [21]. The results will be expressed to body weight, since the differences found in table may influence the results, according to the literature [19], [25].
2.3. Ethics
- This study was approved by ESTSP ethics commission and each athlete read and signed the Informed Consent, according to the Declaration of Helsinki, dated of 1964.
2.4. Statistics
- For all statistics procedures it was used the software (do) PASW® Statistics 18 (Predictive Analytics Software) for Windows 7, considering a level of significance of 0.05 (confidence interval of 95%) across all study.In the characterisation of the sample were used descriptive statistics taking into account the analysis of the mean and median as measures of central tendency and the standard deviation, semi-interquartile range maximum and minimum as measures of dispersion. The homogeneity of the variables was assessed with one-way ANOVA [26]. In the intra-subject inferences was used the Student t-test for paired samples, in particular to analyse the differences in variables between limb [26].In the inter-subject comparisons, meaning to investigate the differences between sports, was used analysis of variance using one-way ANOVA, except for the variable "bilateral differences" where the Kruskal-Wallis test was used. To investigate the trend of the differences we used Tukey’s test for multiple comparisons [26].
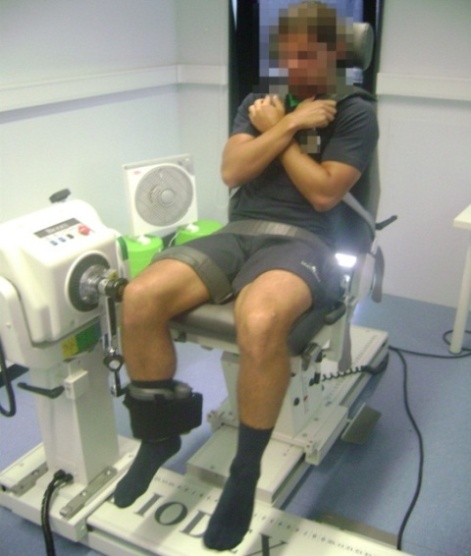 | Figure 1. Positioning in isokinetic dynamometer Biodex System 4 Pro® |
3. Results
3.1. Quadriceps
- Through the analysis of Table 2, it was found that volleyball athletes had a significantly greater dominance of the dominant limb (D) compared to the non-dominant limb (ND), at both speeds, either in Peak torque (PT) (60/s - p = 0,002; 180/ sp = 0,001) or the Peak Torque to Body Weight (PTBW) (60/s - p = 0.000; 180/s - p = 0,002). On the other categories there were no significant differences between limbs.
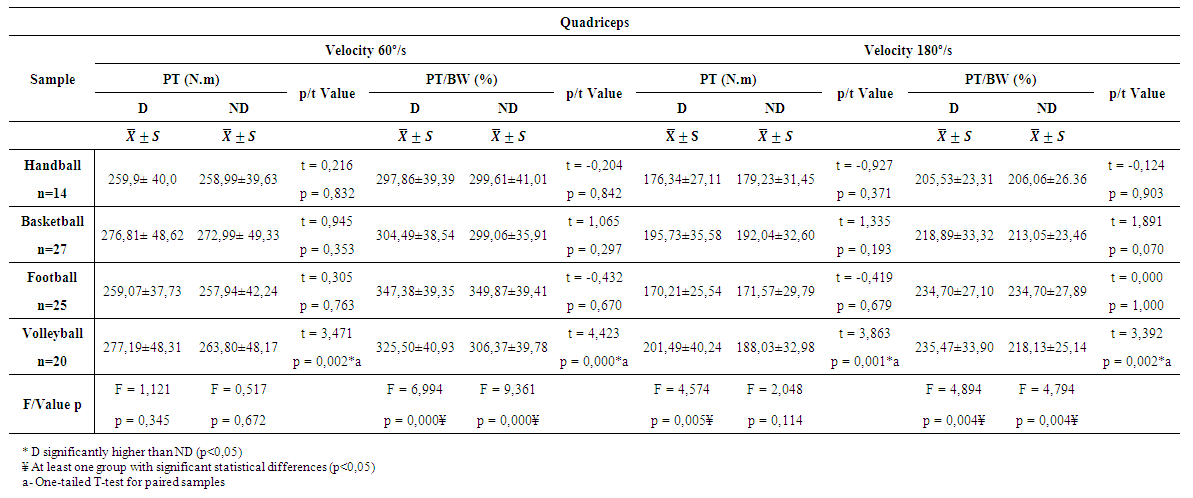 | Table 2. Peak Torque (PT), Peak Torque to Body Weight (PTBW) of the quadriceps muscle’s dominant limb (D) and non-dominant limb (ND) at 60º/s and 180º/s of the different sports practitioners (mean results ( ), standard deviation (S), t and p value) ), standard deviation (S), t and p value) |
3.2. Hamstrings
- The results of table 3 show that in the assessed speeds, basketball players have a significant dominance of the D limb in comparison to the ND at PT levels (60º/S - p=0,008; 180º/s - p=0,006) and PTBW (60º/s p= 0,005; 180º/s - p=0,005).
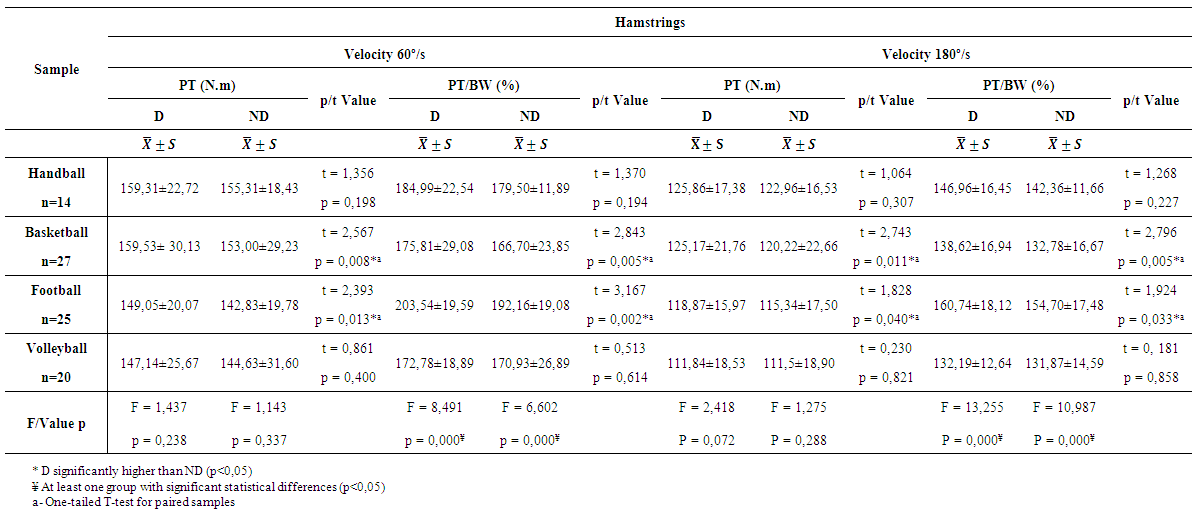 | Table 3. Peak Torque (PT), Peak Torque to Body Weight (PTBW) of the hamstring muscles’ dominant limb (D) and non-dominant limb (ND) at 60º/s and 180º/s of the different sports practitioners (mean results ( ), standard deviation (S), t and p value) ), standard deviation (S), t and p value) |
4. Discussion
- This study focused on the comparison of the isokinetic knee flexors’ and extensors’ muscular strength and in handball, basketball, football and volleyball athletes’. The mechanical and physiological restrictions associated with these procedures may result in changes related to the development of muscle quality and consequent muscular demand may result in different levels of power relatively to the lower limbs [17].The literature suggests that factors such as age, weight and height can bias the results [19], [27], [28], [25]. Thus, in order to avoid the influence of the different anthropometric characteristics presented by subjects in the study, results were also expressed as a function of body weight. To eliminate the influence of height it was considered the application point of resistance to three centimeters above the tibia malleolus, thus normalising the distance of the lever arm relatively to the drive shaft. Regarding age, the results showed that the different groups showed no differences.The fact that there is no standardised protocol to assess the strength in athletes and the isokinetic equipment differs between studies may become more complex and questionable comparisons [5], [8], [12].
4.1. Laterality
- The common usage by athletes of specific tasks of the different sports with a clear lateral component can induce a marked increase in strength on the dominant limb (D) and consequently, a marked bilateral difference with the non-dominant limb (ND)[3], [4], [17], [29]. In this study, it was found that volleyball players showed higher levels of strength on the quadriceps in the D limb relatively to the ND. The same was observed in relation to basketball and football athletes for the hamstrings.Volleyball actions are almost exclusively limited to the performance of vertical jumps and training is based predominantly in plyometric exercises [30], [31]. Although it is not as frequent as in volleyball, basketball players also resort to this motor skill [8], [32].Ruiter et al. [33] showed that the height of the vertical jump is strongly correlated with the strength of the lower limbs. This technical gesture requires a constant high intensity of D limb muscles activity, having a higher demand than the ND limb, which may be one of the possible reasons for the differences observed [4], [8], [17], [34], [35].For its part, the differences found in football can be justified by the specific actions of the modality, especially the pass and shoot, which are held mostly at the D limb instead of the ND [2], [19].The dominance of the D limb over the ND has been reported in football studies by Fousekis et al. [19]; O'Sullivan et al. [11]; Rahnama et al. [20] and in volleyball by Hadzic et al. [4]. However, in this aspect, the literature is controversial. Some studies find no differences between limbs in the case of basketball, football and volleyball [5], [6], [20], [32], [36]. These differences among the several studies to the same modalities could be assigned to the various protocols and equipment used. Relatively to the different modalities, the differences found could be allocated to the various specifics motor skills used to perform the specific sport.Based on the above-mentioned, the training programs and/or technical capabilities of the athletes assessed in this study may have resulted in an imbalance of power between limbs.
4.2. Comparison of PT and PTBW between Sports
- The PT and PTBW values are related to the particular requirements of each sport and it is expected that a certain motor pattern of a sport can influence the athletes’ functional profile [5], [34].The relationship between the sport and PT values only show differences in the quadriceps of the D limb when measured at 180°/sec. These differences showed a superiority of basketball and volleyball athletes compared to footballers. The absence of these differences at 60º/s is due, possibly, to neural inhibition that may occur at this speed given the required high muscle tension [14].One possible explanation for these differences is that athletes in explosive and faster sports which involve continuous performance of maximum power activities, such as basketball and volleyball, the muscles involved in these activities have a higher percentage of type II fibers [13], [37]. Being quadriceps predominantly a phasic muscle, it has a higher proportion of such fibers, thus, it is expected that with the increase of the angular velocity is found greater force production in these athletes, which was observed in this study [28]. These results can also be attributed to body mass differences, since volleyball and basketball athletes had higher weight and height values in comparison to footballers. Athletes with increased body mass have usually a greater physiological cross-sectional area, which consequently has a higher percentage of sarcomeres and/or larger areas of muscle fibers, resulting in production of higher levels of strength [17], [28], [38]. There were no significant differences between basketball and volleyball players on all variables. These results are also found in a study by Bamaç et al. [3] which assessed using an isokinetic dynamometer: 26 volleyball players, 20 basketball players and 20 healthy subjects at angular velocities of 60°/s, 180°/s and 300°/s, in which there were no differences between these sports as well.The results indicate that the sports in which are frequent the performance of vertical jumps, the values of PT are higher regardless of body weight. On the other hand, assuming that the PTBW is the ratio between the applied force and the body weight of the individual, it is expected that athletes with lower body weight have higher strength values [17]. As expected, the analysis of the isokinetic torque showed a superiority of footballers compared to handball and basketball players for the quadriceps and hamstrings and in relation to basketball and volleyball practitioners in both members and assessed speeds.There are other studies which also found a superiority of footballers in relation to volleyball players as is the case of Magalhães et al. [34] which isokinetically assessed 28 volleyball and 47 football players at speeds of 90º/s and 300º/s, having found that superiority in the knee flexor muscles when assessed at slower speeds. However, the angular speeds used by these authors differed from those used in this study. In the study by Zouita et al. [17] which assessed 36 handball, 35 volleyball and 36 football athletes using instruments and procedures similar to those on the present study, at 60°/s, handball athletes showed higher values in the quadriceps compared to football and volleyball players in both knees. However, at 180°/s, PTBW values were higher in handball only in comparison with volleyball players. In the same study, for hamstrings, handball and football players had higher PTBW values compared to volleyball in all assessed speeds. These results contradict the evidenced of this study because football athletes always showed higher values in relation to the other sportsmen.Thus, PT and PTBW results allow affirming that each sport implies a particular isokinetic profile in accordance with the various motor skills related to the specific sport practiced.
4.3. Limitations
- One of the limitations that may be pointed to this research is the fact that some of the technical actions of these sports are performed at much higher speeds than those assessed. However, the literature reports that the usage of velocities greater 180/s is questionable, because in these speeds, the contraction is not purely isokinetic and consequently the acceleration and deceleration phase occupy most of the motion range [12].
5. Conclusions
- The lower limbs’ isokinetic profiles of the assessed athletes showed a dominance of the dominant limb compared to the non-dominant in basketball, football and volleyball athletes. The analysis and interpretation of results allowed also concluding that volleyball and basketball players had higher power levels compared to handball and football athletes when analyzed without correction for body weight. However, in the values of Peak Torque to Body Weight, footballers have higher strength values in comparison to other sports athletes.