Gang Shen, Su Hua, Xiao Zhang, Yingfei Mu, Rhonda Magel
Department of Statistics, North Dakota State University, Fargo, USA
Correspondence to: Rhonda Magel, Department of Statistics, North Dakota State University, Fargo, USA.
| Email: |  |
Copyright © 2015 Scientific & Academic Publishing. All Rights Reserved.
Abstract
This paper proposes a new bracketing tool for all the 63 games in the last 6 rounds of the NCAA Men’s Basketball Tournament. Our new method is based on a binomial generalized linear regression model with Cauchy link on the conditional probability of a team winning a game given its rival team. It uses publicly available team ratings and game statistics prior to the March Madness. The new method is compared to three existing methods currently used to help complete March Madness brackets. The three existing methods include bracketing based on RPI ratings (RPI, 2014); bracketing based on Pomeroy ratings (Pomeroy, 2014) which use the Pythoagrean winning expectation; and bracketing based on estimated probabilities from a model developed using the restricted OLRE method proposed by West (2006, 2008). It is expected that our method will do better than West’s method since the OLRE method does not take into account which teams actually play each other. It is also expected that the proposed method will do better than using Pomeroys’s ratings or RPI ratings since Pomeroy’s ratings have done better than RPI ratings (Pomeroy, 2014) and our method also uses the Pythgorean winning expectation in which Pomeroy’s ratings are based. Nine years of March Madness data from 2002 to 2010 is used to develop models for both the OLRE method and our new proposed method. The four methods are tested using data from March Madness 2012, 2013, and 2014. Overall, our method did better than the other three methods in predicting March Madness winners, particularly when the double scoring system is used.
Keywords:
Conditional probability, Generalized linear model, Ratings, Sports statistics, NCAA men’s basketball
Cite this paper: Gang Shen, Su Hua, Xiao Zhang, Yingfei Mu, Rhonda Magel, Predicting Results of March Madness Using the Probability Self-Consistent Method, International Journal of Sports Science, Vol. 5 No. 4, 2015, pp. 139-144. doi: 10.5923/j.sports.20150504.04.
1. Introduction
The annual National Collegiate Athletic Association (NCAA) Division I men’s basketball tournament, also known as March Madness, is the most-wagered-upon sport event in the United States. Since 2011, the tournament has been expanded to 68 teams playing during March and April. After the first four games are played (First 4 Round), 64 teams are finally determined and seeded with a single seed number from 1 (strongest team) to 16 (weakest team) within their regions (East, South, West, and Midwest) by the NCAA selection committee. The tournament is then left with 6 rounds (Round 64, Round 32, Sweet 16, Elite 8, Final 4 and Championship Round), in a 64 team single-elimination tournament played over three consecutive long weekends (late March-Middle April) on neutral courts so that no team plays on its own home court. (March Madness (2014)) [1]. Teams whose seed numbers add up to 17 are paired off in Round 64 within their regions. Teams winning in each round go on to the next round. The winning teams from each region are then paired to compete for a spot in the Final (East vs South, West vs Midwest). Breiter and Carlin [2] explain how the bracket works.In most other sporting events in the United States, bets are generally placed on each individual game or series of games between a pair of teams. In contrast, a popular way to bet on the March Madness is to predict the results of all 63 games (after First 4) before any of the games have been played. A 63 game prediction of this sort is often referred to as a bracket and has turned into the focus of both fun and serious gambling on the result of the basketball tournaments. The primary purposes of this work is to introduce a novel bracketing method for all the 63 games in March Madness based on a generalized linear model for the conditional probability of the win/lose result given the two rival teams and their publicly available ratings and game statistics before the March Madness. Our proposed method provides an estimate for the winning probability of each participating team in each round, and the expected number of wins for each participating team in March Madness.Kubato, Oliver, Pelton, Rosenbaum [3] provide some basic basketball statistics to consider when analyzing or making inferences about basketball games. Some of these statistics include field goals attempted, field goals made, free throw attempted, free throw made, offensive rebounds, defensive rebounds, and turnovers, among others. Each of these in-game statistics measures a different dimension of the performance of a team in a game, hence is useful in the diagnostics of the performance of a team and helpful for the team to prepare a future game. Magel and Unruh [4] developed models to determine which in-game statistics were significant in determining the outcome of a basketball game and how much weight these statistics had in determining the outcome. However, in-game statistics cannot be used as predictors in bracketing since they are simply not observable prior to the games. Seasonal averages of these in-game statistics could be used since they could be calculated for each team using all the regular season games played by the team. These would be available before the beginning of March Madness. In addition to the seasonal averages of various game statistics, publicly available ratings may provide useful guidance in predicting a game outcome between the two rival teams. The ratings percentage index (RPI), for example, is based on the winning percentage of the team and the winning percentage of the opponents of a team. The formula is given by RPI = (WP*0.25)+(OWP*0.50)+(OOWP*0.25)where WP is Winning Percentage, OWP is Opponents’ Winning Percentage and OOWP is Opponents’ Opponents’ Winning Percentage.RPI [5]Pomeroy derived a ratings system for college basketball based on the Pythagorean winning percentage formula given in Kubatko et al. (2007) [3] The Pythagorean winning percentage is an equation involving an estimate of the adjusted offensive efficiency (AdjO) (points scored per 100 possession) that a team would have against the average Division I defense, and an estimate of the adjusted defensive efficiency (AdjD) (points allowed per 100 possessions) that a team would have against the average Division I offense. Pomeroy ratings may be found at Pomeroy’s website [6].Jeff Sagarin’s Ratings (SAGARIN) have been published in USA TODAY since 1985. Exact details for these ratings are not known, but the ratings are readily available on the USA Today website [7]. The ratings take into account team wins and losses in addition to the team’s scoring performance [8]. Jeff Sagarin also computes a strength of schedule metric (SASGOS).
2. March Madness Betting
It has been estimated that in 2014 approximately 50 million people participated in office polls for betting on March Madness with the cost to American industry being more than $1.2 billion due to workers completing their brackets while at work (Barra) [9]. The amount of money bet on March Madness was estimated to exceed the amount of money bet on the Superbowl by approximately $2 billion [9].The competition of filling out the basketball brackets has turned into a focus of both fun and serous gambling. Points are awarded to the correct prediction of each game. Any office pool can customize their own scoring system, but we mention two types of scoring systems that are often used. The first scoring system is the doubling points system and the other is the simple scoring system. Under the simple scoring system, each correct prediction as to the team winning the game is awarded one point. An individual betting in this system could receive up to a maximum of 63 points since there are 63 total games after the First 4 Round. Under the doubling points system, each correct prediction as to the team winning the game in Round 64 is awarded 1 point; each correct prediction in Round 32 is awarded 2 points; each correct prediction in Sweet 16 is awarded 4 points, and so on. The doubling system puts more weight on the later rounds, with the focus being on correctly predicting the winner of the tournament. An individual betting in the doubling system could receive up to a maximum of 192 points; 32 points in Round 64; 32 points in Round 32; 32 points in Sweet 16; 32 points in Elite 8; 32 points in Final 4 and 32 points in the Championship Round.
3. A Probability Self-consistent Model
Using the publicly available ratings, West [8] [10] proposes a multinomial proportional odds model (restricted OLRE) for the probability of team i has k winnings in the tournament, namely, 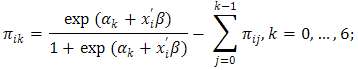 where αk is the intercept for k winnings, xi is the vector of predictive variables for team i, and β is a vector of coefficients associated with xi. The last term in the right hand side of the equation above presents the cumulative probability of team i winning j games (j=0,…,k-1), which would be equal to 0 for k=0. To make his multinomial model legitimate, West [8] further requires a constraint on the πik ‘s, namely the sum of the πik,’s equals to 32, 16, 8, 4, 2, and 1, for k=1, …, 6, respectively. However, this constraint is still insufficient to guarantee its legitimacy. For instance, by this model, though
 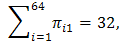 it is possible that π11 + π21≠1. This makes no sense if teams 1 and 2 are paired in the first round.Actually, any probability model should satisfy some basic probability requirements, e.g., probability self-consistency requirement, which for this case is defined as below:Definition 1. First let Zi be the total number of winning games of team i, where Zi is a random polynomial variable taking integer values in {0,1,…,6}. Let Oi(k) be the index set of all the possible competing teams against team i in the kth round and Ui(k) be the index set of all the possible competing teams against the team i up to the kth round, i.e., Ui(k) = ∪ kj=0 Oi(j) with Oi(0) = {i}. For instance, O2(3) = {5,6,7,8}; U2(3) = {1,2,3,4,5,6,7,8}. Clearly, for
  i=1,2,…,64 and k=1,2,…, 6, Oi(k) and Ui(k) are fully determined before the start of Round 64 in the tournament. The so-called probability self-consistency requirement is that P(Zi≥k) must satisfy
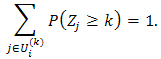 This requirement is necessary because of the single elimination rule adopted in the last 6 rounds of the tournament.Clearly, the restriction
 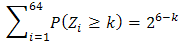 in the restricted OLRE model is only necessary but not sufficient for the probability self-consistency requirement being observed. Therefore, the restricted OLRE model doesn’t necessarily satisfy the probability self-consistency requirement, which is a fatal flaw of this model. Here we propose a new statistical model for bracketing the NCAA Men’s Division I Basketball Tournament.Let Zi be the total number of wins by team i in the tournament, the restricted OLRE model actually can be put into an equivalent form
 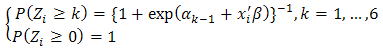 subjected to
 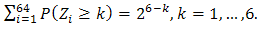 Note that αk in the restricted OLRE model necessarily increases with k, since P(Zi ≥ k) decreases with k. In view of the single-elimination competition rule, instead of modelling Zi directly, we consider a binomial generalized linear model (binomial GLM) for the game result between team i winning j in the kth round of the tournament, i.e.,
 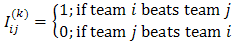 and pij(k) be the conditional probability of team i winning team j in the kth round given both entering the kth round i.e.,
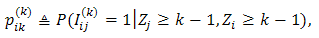 We consider a binomial GLM with Cauchy link as follows:
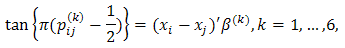 Where (xi – xj) is the vector of the spread between team i and team j, and the β(k) are the associated coefficients in the kth round. Our model specification satisfies pij(k) + pji(k) =1, which make sense because in the game played between team i and team j, the summation of the probability of team i wins and the probability of team j wins, must be 1.Observe that
 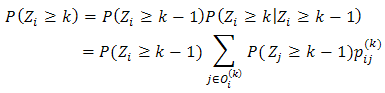 where Oi(k) is the set of all the rival teams that team i may encounter in the kth round and P(Zi ≥ 1)=pij(1), then P(Zi ≥ k), k ≥ 2, can be computed iteratively based on pij(k) in the binomial GLM as above.Once all the P(Zi ≥ k), i=1, …,64 and k=1,…,6, are obtained, bracketing of the winner in Ui(k) of the kth round is as simple as picking team j with the largest P(Zj ≥ k) in each Uj(k). The expected number of wins for team i is then simply EZi=∑6k=1 P(Zi ≥ k).Proposition 1. Every conditional probability model satisfying pij(k)+ pji(k)=1 for
  i,j,k must satisfy the probability self-consistency requirement, i.e.,
 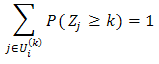 For
For  i,k.Proof. This proposition is proved by induction. 1. When k=0, Ui(0)=i. Then The result is trivially true.2. Suppose the result holds when k=s, i.e., Then by Eq(2).
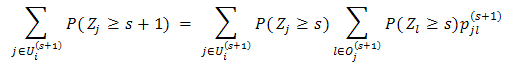 Observe Ui(s+1) has a partition consisting of Ui(s) and Oi(s+1), then
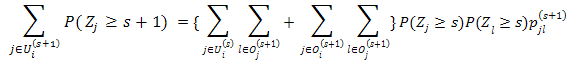 Note that (j,l)
  Ui(s) X Oj(s+1)if and only if (j,l)
  Ui(s) X Oi(s+1) ; (j,l)
  Oi(s+1) X Oj(s+1) if and only if (j,l)
  Oi(s+1) X Ui(s), so
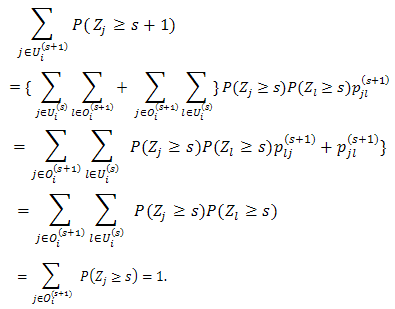 The last equation is due to the fact Oi(s+1)= Ui(s),
  Oi(s+1).
4. Description of Study Comparing Four Methods of Bracketing March Madness
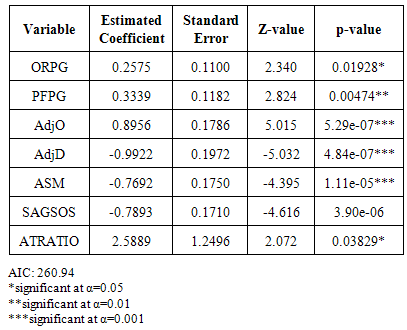
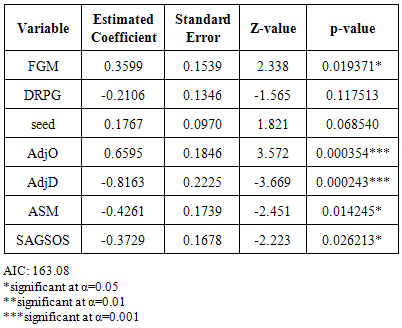
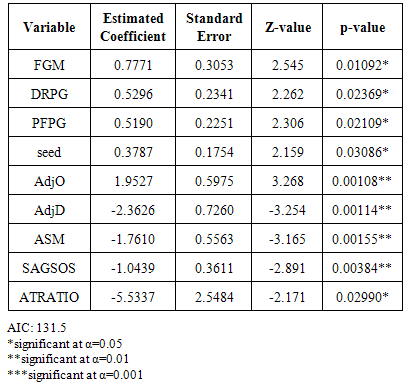
In this work, we will compare four possible ways used to complete brackets for March Madness. These methods will be compared using the simple scoring system and the double scoring system and include the following: Probability Self Consistent (PSC) method (proposed in this research); restricted OLRE method (West [8] [10]); using RPI ratings [5]; and using Pomeroy ratings [6]. The methods will be used to predict the results of the games for 2011-12, 2012-13, and 2013-14 Men’s NCAA Division 1 Basketball Tournaments. Two of the existing methods in the comparison study, RPI ratings and Pomeroy ratings, are known each year before March Madness begins. Both the RPI ratings and Pomeroy ratings calculated before the beginning of each tournament (for 2011-12, 2012-2103, and 2013-2014) are used to form brackets for each of the tournaments to determine how well these ratings would have predicted the winners. This work will require no further modelling because just the existing ratings (before tournament begins) are used.The third method to be compared with the PSC method is the restricted OLRE method proposed by West [8] [10]. When West [8] first proposed the method, he used a set of five possible variables as predictor variables to form a model using this method, but noted that any set of game statistics could be used to make predictions. Any set of game statistics could also be used in the PSC method proposed in this paper to develop a set of models to complete basketball brackets. In this research, the same set of game variables are used to develop a model based on the OLRE method and models based on the PSC method so that we will be able to equally compare both methods.Fourteen variables are considered for possible usage in the PSC method and the restricted OLRE method. This set of fourteen variables includes both seasonal averages of in-game statistics (calculated at the end of the regular season before March Madness started) and various ratings for a team. The fourteen variables are the following: FGM (average field goals made per game); 3PM (average number of 3 point field goals made per game); FTA (average number of free throws attempted per game); ORPG (average number of offensive rebounds per games); DRPG (average number of defensive rebounds per game); APG (average number of assists per game); PFPG(average number of personal fouls per game); ASM (average scoring margin: Seed number; SAGSOS (Sagarin strength of schedule) [7]; ATRATIO (average assists to turnover ratio); AdjO (adjusted offensive efficiency - estimates average points scored by team per 100 possessions playing against an average D1 defense) [6]; AdjD (adjusted defensive efficiency - estimates average points allowed based on 100 possessions against an average D1 offense) [6]; and Pyth (a team’s expected winning percentage against an average D1 team) [6].Data on the fourteen variables mentioned is collected for the 2002-2003 season through the 2010-2011 season from teams playing in March Madness for each of those years in order to develop models using the PSC method and a model using the OLRE method. Akaike information criterion with a correction (AICc) is selected as a measure for model selection, since the data size is small. An exhaustive search based on the AICc in the space of all the 214 possible candidate models is done to find the best logistic conditional probability model for the games in each round. The preferred model is the one with the minimum AICc value.The formula for AICc is: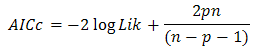 where logLik is the log likelihood of the fixed model, p is the number of parameters in the model, and n denotes the sample size, [12].Three models are developed using the PSC method to predict results in a March Madness tournament. The first model developed is for predicting the results from Round 64 games. The second model developed is for predicting results from Round 32 games. The third model developed is for predicting the results for the remaining games in a tournament from Sweet16 to the championship game. (See Tables 1-3)
Table 1. Variables and Estimated Coefficients for PSC Round 64 Model
 |
| |
|
Table 2. Variables and Estimated Coefficients for PSC Round 32 Model
 |
| |
|
Table 3. Variables and Estimated Coefficients for PSC Rounds Sweet 16-Championship Model
 |
| |
|
The results obtained from the PSC method are compared to the results obtained from the restricted OLRE method, [8] [10]. The variables to be used in the OLRE method are any variables found to be significant in Models 1, 2, or 3 using the PSC method. The results from these two methods are also compared to the results obtained from using Pomeroy’s ratings [6] and then using RPI ratings [5]. The accuracy for bracketing all 63 games in each of the 2012, 2013, and 2014 is tested and the results are compared based on the single scoring system and the double scoring system described in Section 2. The data is collected from the following websites: NCAA [11]; Pomeroy [6]; and Sagarin [7].
5. Results
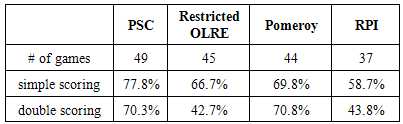
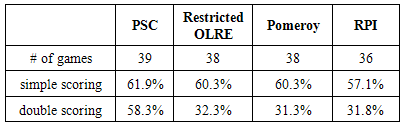
The PSC method, restricted OLRE method, RPI ratings, and Pomeroy ratings were used to predict the results of the 2011-2012, 2012-2013, and 2013-2014 NCAA March Madness tournaments. Tables 4-6 compare the four methods based on the number of games predicted correctly, the percentage of total points earned under the simple scoring system, and the percentage of total points earned under the double scoring system. Table 4. 2011-2012 NCAA March Madness Bracketing Accuracy Rate Comparison
 |
| |
|
Table 5. 2012-2013 NCAA March Madness Bracketing Accuracy Rate Comparison
 |
| |
|
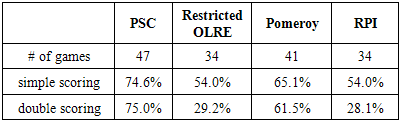
Table 6. 2013-2014 NCAA March Madness Bracketing Accuracy Rate Comparison
 |
| |
|
The PSC method predicted more games correctly for each of the three years of tournaments considered than any of the other methods. Unlike the restricted OLRE method proposed by West [8], the PSC method takes into account the teams that actually play each other and the entire set of teams competing for a given spot in the tournament. The PSC method gave the highest percentage of points possible under the simple scoring system for each of the three years. Except for the 2011-2012 year, the PSC method gave the largest percentage of points possible under the double scoring system by at least thirteen percentage points. For the tournament in 2011-2012, both Pomeroy’s ratings and the PSC method had about the same percentage of total points under the double scoring system. They both did considerably better than the restricted OLRE method and using RPI ratings.
6. Conclusions
The results obtained from the three seasons indicate the PSC is the best method to apply of the four methods considered to use for bracketing if either the simple scoring system or the double scoring system is used. Unlike the restricted OLRE method proposed by West [8] [10], the PSC method takes into account which teams actually play each other in addition to which teams are competing for the same spot in the tournament. The PSC method predicted more games correctly than the other methods for the three seasons considered. It generally did much better than each of the other methods under the double scoring system, with the exception of the 2012 year in which it did about the same as bracketing using Pomeroy’s ratings. If one’s goal is to predict the teams that will get to the more advanced rounds, the PSC method is recommended.
References
| [1] | March Madness (2014). Available: http://en.wikipedia.org/wiki/march_madness. |
| [2] | Breiter, D. and Carlin, B. (1997). How to Play Office Pools if You Must CHANCE, 10,1, p 5-11. |
| [3] | Kubatko, J. and Oliver, D. and Pelton, K. and Rosenbaum, D. T. (2007). A Starting Point for Analyzing Basketball Statistics. Journal of Quantitative Analysis in Sports, 3, 3, p 1-18. |
| [4] | Magel, R. and Unruh S. (2013), “Determining Factors Influencing the Outcome of College Basketball Games,” Open Journal of Statistics, Vol. 3, No. 4, August 2013. |
| [5] | RPI (2014). Available: http://www.collegerpi.com. |
| [6] | Pomeroy, K. (2014) Pomeroy’s ratings. Available: http://www.kenpom.com. |
| [7] | Sagarin, J. (2014). Basketball Statistics. Available: http://www.usatoday30.usatoday.com/sports/sagarin.htm. |
| [8] | West, B.T. (2006). A Simple and Flexible Rating Method for Predicting Success in the NCAA Basketball Tournament. Journal of Quantitative Analysis in Sports, 2, 3, p 3-8. |
| [9] | Barra, A. (2014). “Is March Madness a Sporting Event-or a Gambling Event?” Available: www.theatlantic.com (March 21, 2014). |
| [10] | West, B.T. (2008). A Simple and Flexible Rating Method for Predicting Success in the NCAA Basketball Tournament: Updated Results from 2007. Journal of Quantitative Analysis in Sports, 4, 2, p 6-8. |
| [11] | NCAA (2014). Basketball Statistics. Available: http://www.ncaa.com/. |
| [12] | Akaike, H. (1973). Information theory and an extension of the maximum likelihood principle. In B.N. Petrov and F Csaki (Eds), Second international symposium on information theory (pp. 267-287). Budapest: Academiai Kiado. |
 Abstract
 Reference
 Full-Text PDF
 Full-text HTML