-
Paper Information
- Previous Paper
- Paper Submission
-
Journal Information
- About This Journal
- Editorial Board
- Current Issue
- Archive
- Author Guidelines
- Contact Us
International Journal of Sports Science
p-ISSN: 2169-8759 e-ISSN: 2169-8791
2015; 5(2): 80-86
doi:10.5923/j.sports.20150502.06
Cardiorespiratory Responses to Continuously-Graded and Ramp Treadmill Protocols
 Abstract
 Reference
 Full-Text PDF
 Full-text HTML
José Moncada-Jiménez1, Alicen J. Grandjean2, Sofiya Alhassan3, Peter W. Grandjean4
1Human Movement Sciences Research Center (CIMOHU), University of Costa Rica, San Jose, Costa Rica, Central America
2School of Kinesiology, Auburn University, Auburn, Alabama, United States of America
3Department of Kinesiology, University of Massachusetts - Amherst, Amherst, Massachusetts, United States of America
4Department of Health, Human Performance and Recreation, Baylor University, Waco, TX, United States of America
Correspondence to: Peter W. Grandjean, Department of Health, Human Performance and Recreation, Baylor University, Waco, TX, United States of America.
| Email: |  |
Copyright © 2015 Scientific & Academic Publishing. All Rights Reserved.
Ramped treadmill protocols (RTP) are often used for stress testing in clinical and low-fit populations because small frequent adjustments in work rate are thought to reduce cardiorespiratory stress and elicit higher fitness estimates versus graded treadmill tests (GTP). It is not known if RTP are of similar utility in fit individuals. Our purpose was to compare cardiorespiratory responses to RTP and GTP in healthy middle-aged adults of different fitness status. Seventy-one men and women (higher-fit: n = 32, BMI = 24.2 ± 3.3 kg/m2, VO2peak > 69th percentile; moderately-fit: n = 13, BMI = 24.9 ± 2.3 kg/m2, VO2peak 50-69th percentile; lower-fit: n = 26, BMI = 27.5 ± 4.7 kg/m2, VO2peak < 50th percentile) completed RTP and GTP matched for work rates every 3 min in a randomized cross-over design. Differences in submaximal and peak heart rate, blood pressures, rate pressure product, oxygen consumption, ventilation, and perceived exertion were determined using mixed factorial ANOVAs. Submaximal heart rates and respiratory gas exchange variables were lower at equivalent work rates during the RTP (p < 0.05). Treadmill time, but not VO2peak, was greater with RTP compared to GTP across groups (p < 0.05). RTP elicited lower cardiorespiratory responses at equivalent submaximal work rates; however, RTP and GTP yield similar peak results and are equally tolerated across fitness categories in healthy adults.
Keywords: Aerobic Fitness Testing, Hemodynamics, Perceived Exertion, VO2peak
Cite this paper: José Moncada-Jiménez, Alicen J. Grandjean, Sofiya Alhassan, Peter W. Grandjean, Cardiorespiratory Responses to Continuously-Graded and Ramp Treadmill Protocols, International Journal of Sports Science, Vol. 5 No. 2, 2015, pp. 80-86. doi: 10.5923/j.sports.20150502.06.
Article Outline
1. Introduction
- Standardized exercise tests of increasing intensity are indispensable for the functional and diagnostic study of cardiopulmonary and perceptual responses to physical exertion [1-3]. Continuously-staged or “graded” treadmill protocols (GTP) – characterized by large, abrupt changes in the work rate at regular intervals – have traditionally been employed to determine hemodynamic responses and aerobic power in clinical and healthy populations [4, 5]. The unequal and large increments in work rate can overwhelm oxygen uptake kinetics in low-fit populations and disturb the well-known linear relationship between heart rate (HR), mean arterial pressure (MAP), oxygen consumption (VO2), ventilatory rate (VE), and work [6-10]. The large changes in work rate may seem insurmountable and cause individuals with poor fitness or exercise tolerance to terminate their exercise prior to allowing for adequate measurement of physiological responses and achieving a physiological ceiling [6].Programmable computer-driven ergometers and fast-response breath-by-breath respiratory gas analysis systems have facilitated the development of ramped protocols (RTP) [6, 11]. Ramped protocols, with smaller and more frequent increases in work rate, have steadily gained acceptance in clinical and fitness facilities because the gradual and steady increases in work rate are better tolerated by subjects; allow for measurements of hemodynamic and respiratory responses that are better matched with a given work rate, and; result in greater peak oxygen uptake (VO2peak) in clinical and healthy individuals with low cardiorespiratory fitness [6-9, 12].Different GTP and RTP have been compared in a variety of clinical settings and in healthy but unfit adults [7, 10; 13-18]. These studies have yielded equivocal results. For instance, in some studies aerobic power, as measured by VO2max or VO2peak, has been found to be higher, [15] equal, [14, 16] or lower [10, 13, 17] in RTP compared to GTP. These differences might partially be explained, among other factors, by the physiological characteristics of the participants, (i.e., gender, fitness status, current level of physical activity and exercise, neuromuscular limitations, body composition, the presence of cardiovascular and metabolic disease), the type of protocol being compared and testing modality.Comparisons of the hemodynamic and cardiopulmonary responses to similar work rates achieved through GTP versus RTP have not been made in healthy individuals of moderate or higher cardiorespiratory fitness. In one recent study of physically-active males, participants achieved higher VO2peak and VO2/HR values but shorter time to exhaustion in a ramp test versus the staged Bruce protocol [19]. However, direct comparisons of submaximal and maximal responses could not be made because the increments built into the ramped treadmill protocols were individualized and not matched to stages in the Bruce protocol. Maximal and submaximal physiological responses are often used to predict fitness levels and to construct exercise prescriptions for apparently healthy adults. Precise measurements of VE, VO2, HR, and blood pressure at specific work rates are important for establishing thresholds for exercise addressing primary prevention of chronic disease as well as enhancing training for improving fitness. It is also important to know if physiological responses to a particular protocol are influenced by fitness status among healthy adults. Therefore, the purpose of this study was to compare cardiorespiratory responses and subjective ratings of perceived exertion during RTP and GTP matched for work rate at the end of 3-min intervals in adults of different cardiorespiratory fitness levels. A second purpose was to determine differences in peak cardiorespiratory responses, work rates and exercise times elicited by the RTP versus GTP. Our first hypothesis was that the frequent and smaller increments in the RTP would result in attenuated submaximal responses to equivalent work rates compared to the GTP. Our second hypothesis was that peak responses in the lower-fit but not in higher-fit adults would be enhanced with the RTP versus the GTP. It is of tremendous importance for the clinician, health care practitioner and exercise physiologist to know if the type of treadmill test employed influences the cardiorespiratory and hemodynamic responses at equivalent work rates in individuals with different fitness status [19, 20].
2. Methods
2.1. Participants
- Apparently-healthy middle-aged adults were recruited from the Auburn-Opelika, Alabama area. All volunteers were screened to include only those who: 1) were not taking medications known to alter hemodynamic responses to exercise; 2) were free of contraindications to exercise and orthopedic problems that would limit their ability to walk or jog on a motor-driven treadmill; 3) were free of documented cardiovascular, metabolic and pulmonary disease, and; 4) classified as either "low-" or "moderate-risk" according to the American College of Sports Medicine (ACSM) cardiovascular disease risk stratification guidelines [5]. In addition, a standardized physical activity questionnaire was used to assess self-reported weekly physical activity habits over the previous six months. A sample size of 11 for each fitness group was calculated based on an average standard deviation of VO2peak values in healthy adults of 7 ml/kg/min; effect size of 0.5; alpha error probability of 0.05, and; statistical power of 50%. Volunteers were recruited to meet operationally-defined cardiorespiratory fitness and physical activity characteristics for “higher-fit”, “moderately-fit” and “lower-fit” healthy adults. Higher-fit individuals were defined as those reporting at least 30 min of aerobic activity on ≥ 4 days per week for the last 6 months and a VO2peak ≥ 69th percentile for their age and gender. Moderately-fit individuals were defined as those who reported 30 min of aerobic exercise on 3 to 4 days per week for the last 6 months and exhibit a VO2peak between the 50th and 69th percentile for their age and gender. Finally, lower-fit individuals were defined as those who report ≤ 30 min of aerobic exercise on ≤ 3 days per week over the last 6 months and exhibit a VO2peak ≤ 50th percentile for their age and gender [5, 21, 22]. The intent was to recruit an equal number of men and women into each fitness classification. Every effort was made to recruit individuals from racially-diverse backgrounds.This study was approved by our University Institutional Review Board for Research Involving Human Subjects and conformed to the Code of Ethics of the World Medical Association Declaration of Helsinki. Those who initially met the entry criteria signed an institutionally-approved consent form, underwent body composition assessment via a 7-site skinfold method described by others [23] and completed a preliminary, standard Bruce treadmill test in order to estimate VO2peak and monitor hemodynamics during exercise. All individuals who exhibited normal hemodynamics to exercise, and met group classification requirements (i.e., exercise frequency, duration and VO2peak estimates) were included in the experimental protocol.
2.2. Design
- All participants completed a second Bruce treadmill test, referred to as the GTP, and a RTP treadmill test on separate occasions in a randomized crossover design. We utilized a RTP that was designed before [11] to increase work rate incrementally such that the speed and elevation were matched during the last 30 seconds of each 3-min interval for direct comparisons with the staged Bruce protocol [4].
2.3. Experimental Data Collection
- During each of the treadmill protocols, VE, VO2 and VCO2 were measured on a breath-by-breath basis using an automated metabolic system (Cardio2 Metabolic System, Medical Graphics Corp., St. Paul, MN). HR was measured continuously using a commercially available heart rate monitor (Polar Electro Inc., Woodbury, NY). Systolic (SBP) and diastolic (DBP) blood pressures were measured manually during the last 20 seconds of each 3-min period throughout exercise. Ratings of perceived exertion (RPE) were assessed for the last 20 seconds of each 3-min period after blood pressure measurements using the classic Borg Exertion Scale (6–20 scale) [24]. Responses of MAP and rate pressure product (RPP), a surrogate marker of myocardial oxygen consumption, were calculated from HR, SBP, and DBP. Submaximal measurements are defined as those obtained at equivalent work rates during the two treadmill tests and below the work rate achieved at peak effort. Total treadmill time was recorded and VO2peak responses were defined as meeting at least two of three criteria: a) participant’s request to stop the test, b) respiratory exchange ratio (RER), VO2/VCO2 ≥ 1.15, or c) a plateau of the VO2 curve < 2 ml·kg−1·min−1 with increased work rate [25].
2.4. Statistical Analysis
- Statistical analysis was performed with SAS software, version 9.2 (SAS Institute Inc., Cary, NC). All results are presented as means and standard deviations (mean ± SD). One-way ANOVA was used to determine significant differences in baseline demographic, anthropometric, physiological and perceptual variables between participants in different fitness categories. Cardiorespiratory and perceptual responses at matched submaximal work rates during the treadmill tests were analysed using 3 (fitness categories) x 2 (treadmill tests) ANOVAs with repeated measures for treadmill tests for the first two measurement windows during exercise (i.e., 2:30 to 3:00 minutes and again at 5:30 to 6:00 minutes). The lower-fit individuals were eliminated from analysis of submaximal measurements for the 8:30 to 9:00-minute window because measurements from these individuals did not meet our operational definition of submaximal. Thus, submaximal responses were compared using 2 (fitness categories - the higher-fit and moderately-fit groups) x 2 (treadmill tests) ANOVAs for the 8:30 to 9:00 minute measurements.Peak cardiorespiratory variables were analysed using 3 (fitness categories) x 2 (treadmill tests) ANOVAs with repeated measures for treadmill tests. Duncan’s multiple range post-hoc tests were used to follow-up significant main effects for fitness categories. A comparison-wise threshold for statistical significance was set a priori at p < 0.05.
3. Results
3.1. Participants
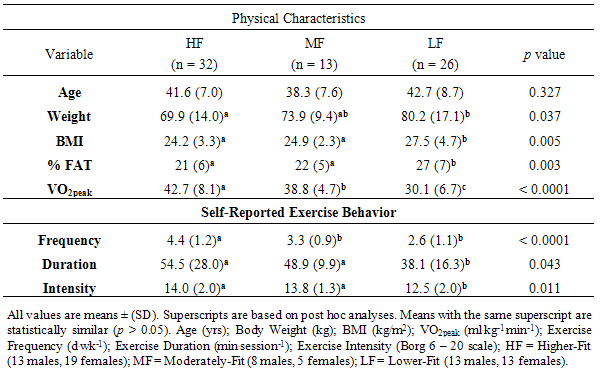
- Thirty four males and thirty seven females participated in the study (n = 71). Descriptive statistics for demographic, anthropometric, physiological and perceptual variables are presented in Table 1.
|
3.2. Resting and Submaximal Measurements
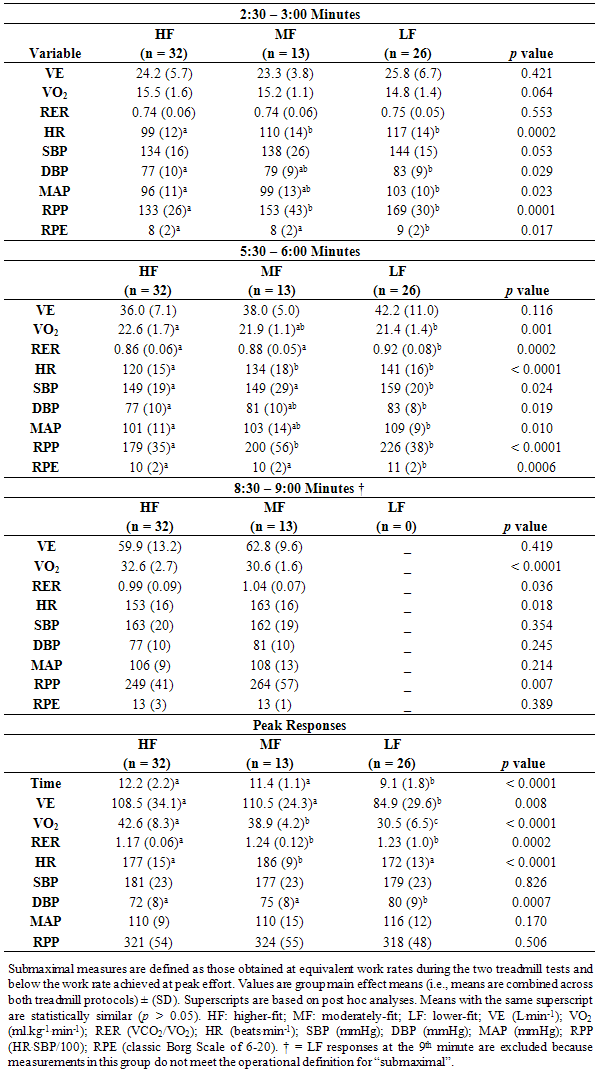
- Resting variables were not different between treadmill conditions (p > 0.05 for all). Resting heart rate (HF 64 ± 10; MF = 71 ± 11; LF = 74 ± 9; p < 0.0001) was slower in the higher-fit versus moderately- and lower-fit groups. Diastolic blood pressure (HF = 72 ± 9; MF = 74 ± 10; LF 76 ± 8; p = 0.0446) was lower in the higher-fit versus lower-fit group when combined across treadmill protocols. Resting systolic blood pressure was not statistically different between fitness categories (p > 0.05). There did not appear to be a learning effect from repeated treadmill tests, as physiological measurements between the initial screening and the experimental GTPs were not statistically different (p > 0.05).There were no fitness categories by treadmill protocol interactions for submaximal responses. Fitness category main effects were observed for some of the submaximal measurements at equivalent work rates. In general, the higher-fit group exhibited lower heart rates, respiratory exchange ratios and rate-pressure products than their counterparts at equivalent submaximal work rates. The higher- and moderately-fit groups reported lower ratings of perceived exertion than the lower-fit groups through the initial six minutes of the exercise test. The fitness category main effects (i.e., the means for each fitness group combined across both treadmill protocols) are summarized in Table 2.
|
|
3.3. Peak Measurements
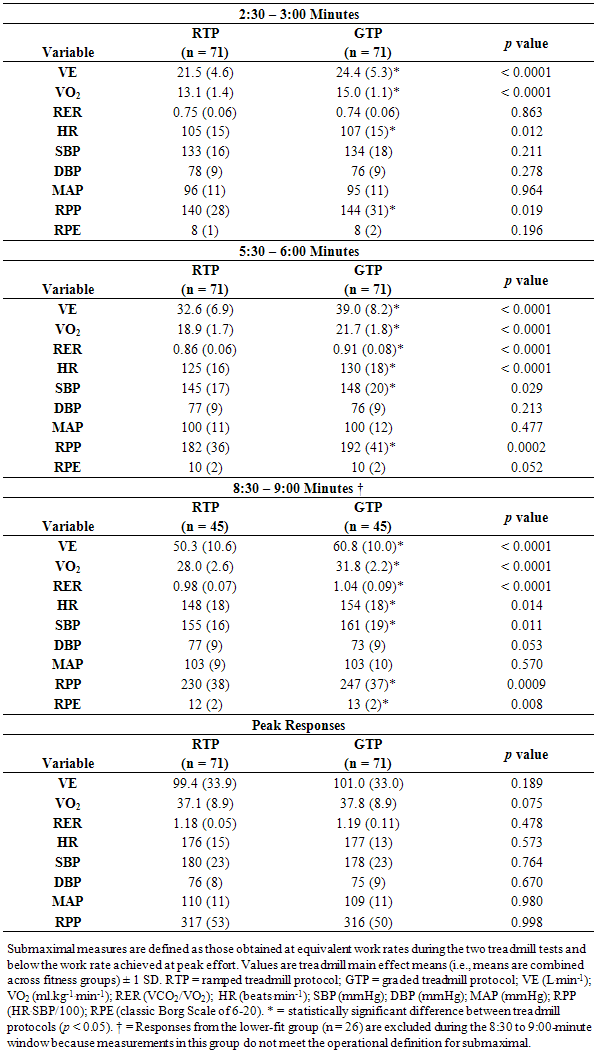
- There were no fitness categories by treadmill protocol interactions for peak measurements. Fitness category main effects were observed for treadmill time to exhaustion, VEpeak, and VO2peak (see Table 2 – Peak Responses). These measurements were greatest in the higher- and moderately-fit groups compared to the lower-fit group (p < 0.0001 for each variable). The higher-fit group exhibited greater VO2peak but lower peak HR versus the moderately-fit group. The greatest peak HR values were observed in the moderately-fit group and were significantly greater than those observed in the lower- and higher-fit groups (p = < 0.0001). Participants in the lower-fit group reached higher DBP values than participants in both the moderate- and the higher-fit groups (p = 0.0007); however, there were no significant peak differences between fitness groups in RPP (p = 0.506), SBP (p = 0.826) and MAP (p = 0.170) between fitness groups. The only treadmill protocol main effect was for time to exhaustion. The treadmill time to exhaustion combined across fitness groups was significantly higher in the RTP than in the GTP (11:42 ± 2:24 vs. 10:36 ± 2:20 min, respectively, p < 0.0001). The magnitude of this difference represents a moderate effect size (ES) = 0.46 [26]. Peak responses for the treadmill main effects are shown in Table 3 – Peak Responses.
4. Discussion
- Our objectives were to compare cardiorespiratory and hemodynamic responses to exercise at equivalent submaximal work rates and peak physiological responses that occur during RTP and GTP in healthy adults across different fitness levels. Our hypotheses were that: 1) more frequent and smaller increments in the RTP would result in attenuated submaximal responses to equivalent work rates compared to the GTP, and; 2) peak responses in the lower-fit but not in higher-fit adults would be enhanced with the RTP versus the GTP. A primary finding of this study supported our first hypothesis regarding submaximal measurements. In general, cardiorespiratory responses were lower at equivalent submaximal work rates during RTP as compared to the GTP. A second primary finding did not support our hypothesis regarding peak values. Treadmill times were longer but peak physiological variables and subjective RPE were similar with the RTP compared to the GTP. The absence of significant interactions would suggest that the responses to exercise of increasing intensity (i.e., the direction and rate of change) were similar across all fitness groups and that cardiorespiratory fitness did not alter the physiological responses to either of the two treadmill protocols. These findings are unique in that the submaximal and peak responses were consistent across all fitness levels in healthy middle-aged adults.
4.1. Submaximal Responses
- Direct comparisons of maximal treadmill results between RTP and GTP in samples of diverse individuals (e.g., healthy adults, physically-active, obese, coronary heart disease patients) have been published elsewhere [10, 14, 16, 19]. However, individualized RTP were utilized in those studies, which preclude valid comparisons of submaximal physiological responses. Instead, for the first time, we were able to demonstrate that submaximal cardiorespiratory and hemodynamic responses in healthy adults of different fitness levels were consistently lower during the RTP when treadmill protocols were matched at equivalent submaximal work rates. Specifically, VE, VO2, HR, and RPP were lower at equivalent submaximal work rates during the RTP versus the GTP. The gradual and steady increase in work rate used in the RTP might explain these findings [7]. Our subjective measures of perceived exertion (RPE) were not different at equivalent submaximal work rates between treadmill tests, suggesting that the difference in physiological stress was not perceptible in healthy adults. However, whether the attenuated physiological responses observed in RTP are related to lower reactive psychological stress to the treadmill test deserves to be investigated further.These subtle increases during an RTP facilitate the linear relationship between VO2 and work rate that has been reported to be lost during GTP [7]. Thus, the RTP may allow for additional physiological measurements (e.g., RPP, lactate threshold, HR) than what may be obtained during a GTP. This is accomplished by a more gradual increase in intensity and, in turn, opportunities to collect measures during the longer time a participant can sustain on the treadmill. The additional measures may subsequently aid the development of individualized exercise prescription. In clinical settings, RTP might have a positive impact on individual test tolerance, especially for sedentary participants. Indeed, RTP are considered the “gold standard” for determining exercise intensity assessment and prescription in this population [7]. The gradual adjustments made throughout the RTP might also be important in health and fitness settings were an increasing number of exercise prescriptions are currently given to participants to promote exercise adherence, for primary prevention of chronic heart conditions, and rehabilitation purposes [20, 27, 28].
4.2. Peak Responses
- We did not find significant VO2peak differences with the RTP versus GTP in healthy adults; however, treadmill time was significantly longer in RTP. The magnitude of the difference in treadmill time between protocols in this study can be considered moderate according to Cohen’s d (ES = 0.46) [26]. Although this is a unique finding for healthy adults across fitness levels, others have shown similar systematic differences between RTP and GTP treadmill times in clinical and low-fit individuals [10, 16, 18]. Therefore, prediction of VO2max based on equations from total treadmill time or submaximal HR developed from the staged Bruce protocol should not be used with these measurements obtained from RTP. Total treadmill times, which appear to be consistently longer with RTP, would systematically inflate VO2max estimates. In addition, the lower submaximal HR found with RTP would presumably overestimate VO2max because these equations are based on the assumption that submaximal responses to a given work rate are linear and related to the fitness status of a particular individual. The lower HR response at an equivalent work rate with the RTP versus GTP would alter estimates of VO2max and power leading to an overestimation. Therefore, caution is advised when using prediction equations for VO2max from treadmill times to volitional fatigue coming from GTP if RTP are to be used. Instead, if a Bruce RTP is used it would be appropriate to utilize equations for VO2max estimates based on ramped treadmill time and other demographics found elsewhere [11].
4.3. Application of Results
- The results from this study support the utilization of either the graded or ramped Bruce protocol to measure cardiopulmonary responses during physical exertion in healthy individuals of different fitness levels. It is important for the practitioner to remember that lower hemodynamic responses result at equivalent submaximal work rates when using the RTP. This may allow for those individuals with slower oxygen uptake or hemodynamic kinetics to achieve longer treadmill time to volitional fatigue during the test [8]. Others have postulated that reduced anxiety associated with ramped tests – due to smaller or imperceptible changes during the protocol - may contribute to the lower hemodynamic responses in unfit individuals and those unfamiliar with treadmill walking/jogging [9]. Our RPE findings do not suggest that perceived effort was a factor contributing to lower submaximal hemodynamic responses during the RTP compared to the GTP.The use of standardized treadmill tests is common practice and currently conducted as a “one type fits all” in laboratory and fitness settings. Multiple reasons appear to influence the choice for selecting a protocol; for instance, the estimated time to complete the test, technician training, routine and/or standards of the facility, and ease of comparing to previous results, among others. If maximum oxygen consumption is to be estimated from total test time, or estimated from submaximal heart rates, our results indicate that VO2max may be overestimated using a RTP. However, if maximal oxygen consumption is directly measured, our results would suggest that a GTP will yield similar results to a RTP when similar treadmill speeds and grades are used to achieve maximum efforts.
5. Conclusions
- Our results demonstrate that submaximal cardiorespiratory and hemodynamic responses to a ramped treadmill protocol are lower than during a staged treadmill protocol at equivalent submaximal work rates in healthy adults across a range of fitness levels. The lower cardiorespiratory and hemodynamic responses in the ramped protocol resulted in longer treadmill times to volitional fatigue in spite of no differences in submaximal ratings of perceived exertion. Practitioners should reasonably avoid predicting VO2max using equations derived from staged protocols when such predictions are based on total treadmill time or the submaximal hemodynamic responses obtained from ramped protocols. Because the total time on the treadmill during a RTP is systematically longer than a similarly structured GTP, VO2max may be routinely overestimated if the total treadmill time to volitional fatigue with ramp protocol is used to predict this parameter using equations derived from continuously-staged protocols. Likewise, VO2max will systematically be overestimated if submaximal heart rates – which are systematically lower when measured during the ramp protocol – are used to estimate VO2max using equations derived from continuously-staged protocols. However, when maximal oxygen consumption is directly measured, our results indicate that a GTP will yield similar results to a RTP when similar treadmill speeds and grades are used to achieve maximum efforts.
ACKNOWLEDGEMENTS
- The authors thank A.J. Cipperly for her valuable assistance during data collection for this project.