-
Paper Information
- Previous Paper
- Paper Submission
-
Journal Information
- About This Journal
- Editorial Board
- Current Issue
- Archive
- Author Guidelines
- Contact Us
International Journal of Sports Science
p-ISSN: 2169-8759 e-ISSN: 2169-8791
2015; 5(2): 65-72
doi:10.5923/j.sports.20150502.04
Physiologic and Metabolic Effects of a Suspension Training Workout
Wesley D. Dudgeon1, Judith M. Herron2, Johannas A. Aartun1, David D. Thomas1, Elizabeth P. Kelley1, Timothy P. Scheett1
1Department of Health and Human Performance, College of Charleston, Charleston
2Department Exercise & Sport Science, The Citadel, Charleston
Correspondence to: Wesley D. Dudgeon, Department of Health and Human Performance, College of Charleston, Charleston.
| Email: |  |
Copyright © 2015 Scientific & Academic Publishing. All Rights Reserved.
Suspension training is a combination of unique training movements aimed at improving strength, endurance, coordination, flexibility, power, and core stability within a single workout. Suspension training is marketed as a cardiovascular and resistance training exercise modality performed like a circuit-training workout, in which a series of exercises are performed in rotation with minimal rest time. Objective: The purpose of this study was to determine the effects of a suspension training workout on physiologic and metabolic markers of intensity and performance. Methods: Twelve male subjects (22.0 ± 0.7 years) participated in a 60-minute whole body interval-based suspension training workout while connected to a metabolic cart. Lactate was measured before, at mid point, and various times following exercise. Results: The average heart rate (HR) during the work out was 69±2 % of estimated max. Blood lactate levels rose to 8.0±0.5 mmol/L at mid point, and remained elevated during the work out. The caloric expenditure was 340.9±13.6 kcals, or 5.3±0.4 kcal/min with a respiratory exchange ratio1.03±0.01. Conclusions: These data indicate that a suspension training workout with a 30 sec: 60 sec work to rest ratio provides at least a moderate-intensity cardiovascular workout while some data suggest a higher intensity workout is achieved.
Keywords: Exercise, Unstable, Core, Intensity
Cite this paper: Wesley D. Dudgeon, Judith M. Herron, Johannas A. Aartun, David D. Thomas, Elizabeth P. Kelley, Timothy P. Scheett, Physiologic and Metabolic Effects of a Suspension Training Workout, International Journal of Sports Science, Vol. 5 No. 2, 2015, pp. 65-72. doi: 10.5923/j.sports.20150502.04.
Article Outline
1. Introduction
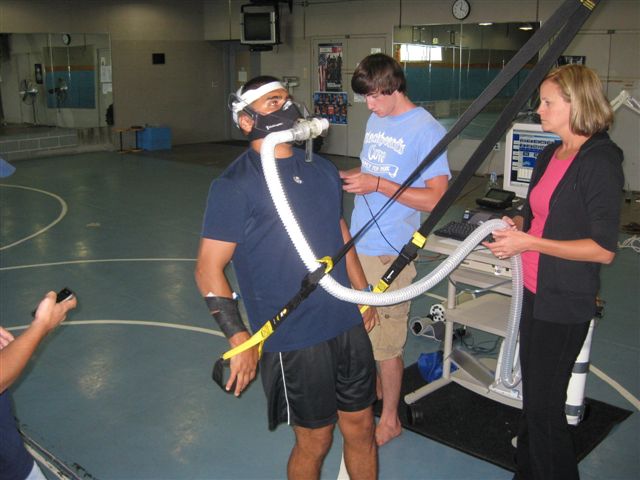
- The exercise industry continues to grow with new products, exercise machines, equipment, and programs that are being developed by researchers, coaches, and fitness franchises. The Sports and Fitness Industry Association (SFIA) reports that in 2013, Americans spent over $80 billion on the sporting goods industry with a majority of that money spent on product innovation and fitness gear [1] (SFIA, 2013). Most of these products and concepts are fads that come and go, but occasionally a new idea emerges in exercise training that shows promise. A comprehensive fitness program will encompass all components of physical fitness, including flexibility, body composition, muscular strength and endurance, and cardiovascular fitness. Suspension training is a novel form of exercise training that has the potential to train all components of physical fitness in one interval-style workout. Most suspension training systems use a combination of unique training movements where the user’s hands or feet are supported by a single anchor point while the opposite end of the body is in contact with the ground. (See Picture 1.) Suspension training provides support and mobility to potentially improve strength, endurance, flexibility, and core stability within a single workout. Suspension training can be utilized by all fitness levels and is currently being used in fields such as physical therapy, occupational therapy, sports training, coaching, recreational fitness, and the military. The popularity and portability of suspension trainers necessitates that research be completed so that they can be used to their fullest capacity in rehabilitation, fitness, or home settings. Suspension training was designed as a cardiovascular and resistance training exercise modality, most similar to a circuit training workout, in which a series of exercises are performed in succession with minimal rest between exercises [2]. Unlike other resistance training methods, resistance training movements using suspension trainers require prolonged static and/or dynamic contractions of core musculature in order to perform. Additionally, suspension training differs from traditional cardiovascular exercise because it is completed in an interval fashion, usually with a 1:2 work to rest ratio (30 seconds of exercise followed by 60 seconds of rest) completed over the course of 30 – 60 minutes. There is limited research available on the impacts of suspension training, with the majority addressing muscle activation and biomechanics of single movements [3, 4] while other literature suggests it is effective as a training tool at improving endurance and core strength [5]. Exercise elicits various physiologic and metabolic responses, all of which depend on the intensity and duration of the effort and the modality of choise. A few of these responses include substrate utilization, caloric expenditure, and lactate production. By measuring the changes in heart rate (HR), blood pressure (BP), blood lactate, oxygen consumption, and carbon dioxide production of the individuals performing a suspension training workout, the physiologic and metabolic stress placed on the body can be estimated. In the current study, HR, BP, lactate, and oxygen consumption were monitored for physiologic and metabolic changes throughout the training session using the 1:2 work to rest ratio (30 seconds exercise and 60 seconds rest) recommended by the manufacturer.Given the use of suspension training in elite athletes [6] and its popularity in the fitness world [7, 8] our purpose was to describe the physiologic and metabolic responses of a single suspension training workout. Caloric expenditure, heart rate, blood pressure, expired gas analysis and blood lactate was measured during and after a typical one-hour suspension training workout.
2. Methods
- The Citadel’s Institutional Review Board (IRB) approved all methods for the study. All training took place in the Human Performance Laboratory at The Citadel. All 12 male subjects (22.0 ± 0.7 years, 176.7 ± 2.3 cm, 79.4 ± 3.0 kg, 13.6 ± 1.3% body fat) who completed the study were active and self-reported that they participated in a structured exercise-training program for at least three days/week during the 12 months prior to the study. In the week prior to the study, subjects participated in two practice sessions with the suspension trainer to familiarize themselves with the 23 exercises that they would be asked to perform for the study. The practice sessions lasted one hour and were led by a trained research team member.
2.1. Statistical Analysis
- All data was entered into Microsoft Excel for data reduction. Data was analyzed (SigmaSat 3.5) using repeated measures ANOVA to assess changes within group means and over time. Tukey’s Test was used for post hoc analysis. The significance level was set at α = 0.05.
3. Results
3.1. Heart Rate
- As expected HR rose from rest (70 ± 4 bpm) to mid exercise (127 ± 5 bpm) and remained significantly (P<.05) higher than rest immediately post exercise (129 ± 3 bpm) and even out to 30 minutes post exercise (83 ± 3 bpm). However, by 60 minutes post exercise HR had returned to baseline and remained there out to 120 minutes. (See Figure 1) When looking at APMHR (expressed as % of APMHR using the equation 208 - 0.7 x age) during the exercise intervals, it was found that the HR average was 74% ± 2% and this dropped to 65% ± 2% during the rest intervals. For the overall 60-minute suspension training exercise session APMHR was 69.3% ± 2%. (See Figure 3)
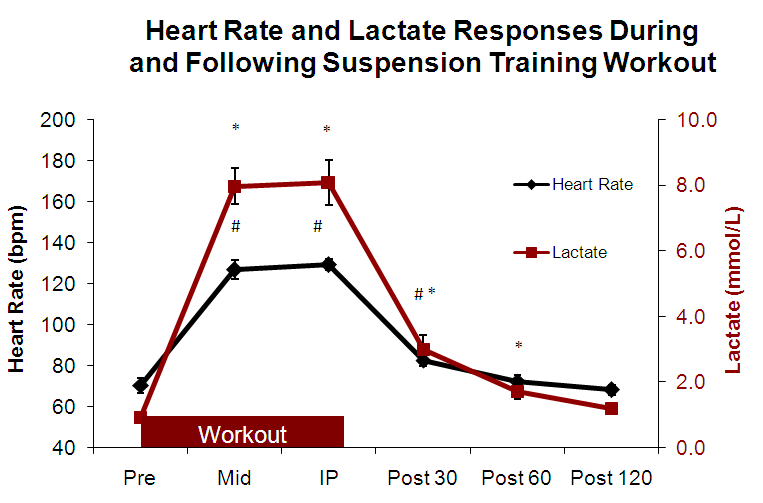 | Figure 1. Heart rate and lactate responses during and following a suspension training workout. Heart rate and lactate were measured immediately before the session (Pre), at the 30 minutes midpoint for the TRX® session (Mid), immediately after the session (IP), 30 minutes after the session (Post 30), 60 minutes after the session (Post 60), and 120 minutes after the session (Post 120). # Indicates difference from pre for HR. * Indicates difference from pre for lactate |
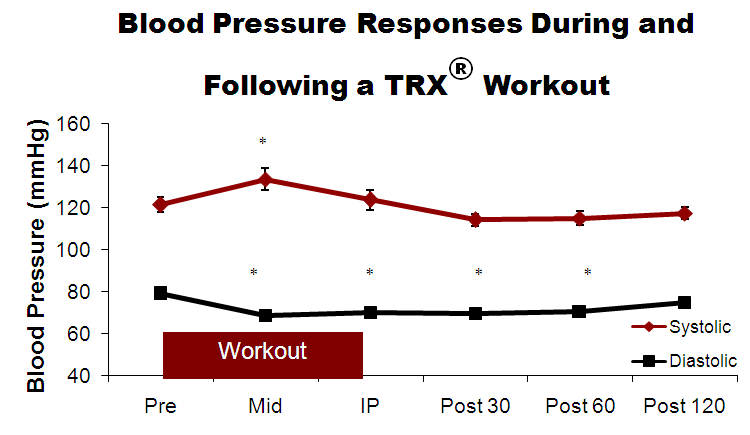 | Figure 2. Blood pressure response during exercise and recovery. Systolic Blood Pressure (SBP) and Diastolic Blood Pressure (DBP) were measured immediately before the session (Mid), immediately after the session (IP), 30 minutes after the session (Post 30), 60 minutes after the session (Post 60), and 120 minutes after the session (Post 120). * Indicates difference from pre |
3.2. Blood Pressure
- Predictably, the suspension training workout caused a significant (P<.05) increase in SBP from rest (121 ± 4 mmHG) to mid exercise (134± 5 mmHG) and rapidly returned to baseline levels at the remaining time points. Conversely, DBP was significantly (P<.05) lower than baseline (79 ± 3 mmHG) at mid (68 ± 3 mmHG), post (70 ± 2 mmHG), post 30 (70 ± 2 mmHG) and post 60 (71 ± 2 mmHG) and returned to baseline levels by post 120 (P>.05). (See Figure 3)
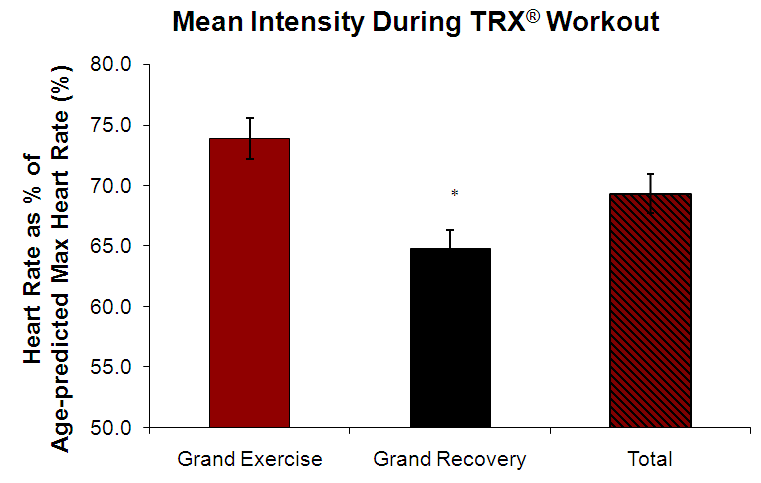 | Figure 3. Percentage of age-predicted maximum heart rate (208 - 0.7 x age) expressed during the 30 second suspension training exercise portions of the workout (Grand Exercise) and the 60 second recovery portions of the session (Grand Recovery). Total represents the 46 exercise and rest cycles (23 exercises each in set 1 and set 2. * Indicates difference from exercise |
3.3. Blood Lactate
- Resting blood lactate levels were below 1 mmol/L (0.9 ± 0.1) and were significantly (P<.05) elevated at the mid (8.0 ± 0.5 mmol/L) and immediately post (8.1 ± 0.7 mmol/L) time points. During seated recovery, blood lactate remained elevated over rest at post 30 (3.0 ± 0.4 mmol/L) and post 60 (1.7 ± 0.5 mmol/L) and finally returned to pre exercise levels at post 120 (P>.05). (See Figure 1)
3.4. Respiratory Exchange Ratio
- The average RER at rest was 0.85±0.01 and this rose to 1.03±0.01 during the suspension training workout. As expected RER dropped during the 120-minute post exercise rest period to 0.75±0.01). (See Figure 4)
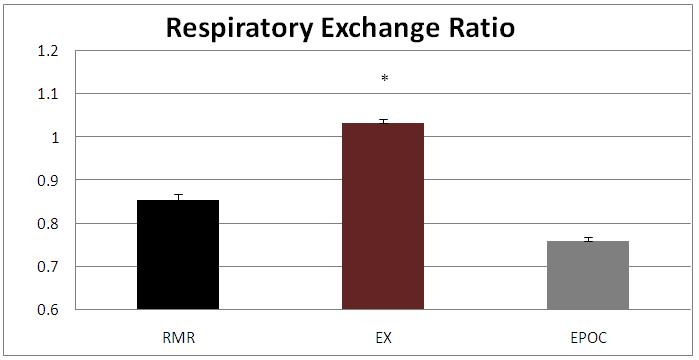 | Figure 4. Respiratory exchange ratio levels during rest, exercise, and recovery. Respiratory Exchange Ratio (RER) was measured for the Resting Metabolic Rate (RMR), the Exercise phase (EX) and for Excess Post-exercise Oxygen Consumption (EPOC). * Indicates difference from pre |
3.5. Caloric Expenditure
- Caloric expenditure was highest during the exercise portion of the test, in terms of both total calories burned 340.9±13.6 kcals and rate (5.4±0.02 kcal/min or 4.3±0.1 kcals/kg). Recovery showed an increase in calories burned per unit body weight compared to rest (2.13±1.1 kcal/kgvs0.53±0.02 kcals/kg), while both had similar expenditure rates per minute (1.41±0.07 kcals/min for recovery and 1.41±0.05 kcal/min for rest). Subjects did expend a total of 150.6±9.2 kcals during the recovery period. (See Figure 5)
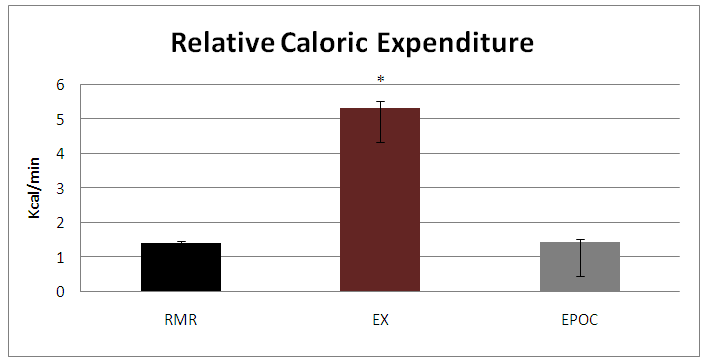 | Figure 5. Caloric expenditure (kcal/min) was measured during 1) a 30-minute rest phase obtain Resting Metabolic Rate (RMR), 2) the suspension training exercise session (EX), and 3) during the 2-hour recovery phase to obtain Excess Post-exercise Oxygen Consumption (EPOC). Open-circuit spirometry was used to determine RER. Caloric expenditure was determined using a flow-over indirect calorimeter metabolic cart (ParvoMedics®) * Indicates difference from pre |
3.6. Oxygen Consumption
- Oxygen consumption was 3.59±0.11 L/min during rest and increased to 13.8±0.4 L/min during the exercise session. Average consumption returned to baseline levels (3.76±0.19 L/min) during the 120-minute recovery. (See Figure 6)
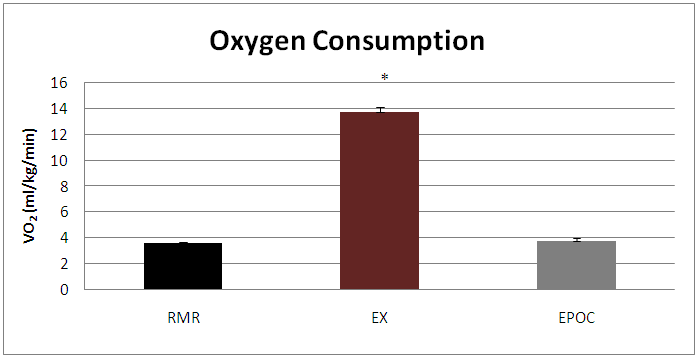 | Figure 6. Oxygen consumption levels during resting metabolic rate, exercise, and exercise post oxygen consumption. Resting Metabolic Rate (RMR) was measured for 30 minutes prior to the session. The Exercise phase (EX) was measured for 60 minutes. The Excess Post-exercise Oxygen Consumption (EPOC) was measured for 120 minutes post exercise session. * Indicates difference from pre |
4. Discussion
- The primary focus of this study was to describe the physiologic and metabolic changes caused by a single suspension training session. While this mode of exercise has become popular in recent years, scant evidence exists to support, or refute, the claims made about the physiologic and metabolic effects of suspension training. Changes in HR during exercise are dependent on the intensity of the exercise performed. According to the American College of Sports Medicine (ACSM), an APMHR of 55% - 80% max is indicative of a moderate intensity cardiorespiratory exercise [14]. During the suspension training workout portion of the study, the participants’ HR rose to 74% ± 2% APMHR, averaged 69.3% ± 2% for the total training session, and never dropped below ACSM-stated threshold for moderate intensity exercise. These data indicate a moderate intensity cardiorespiratory stimulus produced by this workout. Only modest decreases in HR were observed during the 60-second rest periods that followed each 30-second exercise bout.During cardiovascular exercise, systolic BP will increase progressively with intensity, whereas diastolic BP will increase only slightly. During strength training exercises, both systolic and diastolic pressures will rise [15]. The resting SBP of the participants was normal (121 ± 4 mmHg) and as expected increased during the workout (134± 5 mmHg) and immediately post (124± 5 mmHg). However, DBP responded differently in that it was lower during exercise (68 ± 3 mmHg), and didn’t return to baseline levels until 120 minutes post exercise (75 ± 1 mmHg). In attempting to classify the suspension training workout, the SBP results, as well as the HR data, strongly suggest more of a cardiovascular-type exercise, yet the DBP does not fit with this classification. The explanation for the decrease in DBP is that aerobic exercise results in an acute increase in cardiac output as well as a decrease in peripheral resistance due to vasodilation in the exercising muscle. Consequently, as aerobic exercise intensity increases, systolic BP rises, whereas diastolic BP remains stable or decreases slightly [16]. Pooling of blood in the visceral organs and lower limbs during recovery reduces central blood volume, further contributing to a reduced post-exercise BP [15].The amount of lactate produced from exercising muscles depends on the mode, duration, frequency, and intensity of the exercise [17], with high lactate concentrations indicating higher intensity exercise. Blood lactate levels that reach 8 to 10 mmol/L indicate surpassing the lactate threshold and reaching near maximal exercise effort [15]. Large muscle groups and small muscle groups tend to vary in the magnitude of lactate responses, and this can vary based on the intensity of the workout. Overall, blood lactate levels in this study peaked at ~8 mmol/L during the workout portion and took the full two-hour recovery time to return to resting levels. These results suggest a high intensity workload in which participants reached, or came close to reaching, lactate threshold. While the HR and BP data suggest a moderate-intensity workout, the lactate responses are more suggestive of higher-intensity work. The explanation for the apparent disagreement lies in the fact that suspension training workouts include not only resistance exercises, but also requires near continuous activation of core and stability musculature, which would lead to more lactate production than the HR data alone would suggest. Indirect calorimetry has been used for years to estimate the amount of heat produced during (energy utilized) exercise by measuring the amount of oxygen consumed and the amount of carbon dioxide eliminated [18]. Utilizing one liter of oxygen generates 4.82 kcal from a combination of carbohydrates, lipids, and proteins. Indirect calorimetry provides two valuable pieces of information germane to this study: a measure of substrate utilization as reflected by the respiratory exchange ratio (RER) and a measure of energy expenditure. The magnitude of the increase in oxygen consumption is dependent on the duration and intensity of the activity [15]. The average RER during exercise portion of the session was 1.03±0.01, indicating a high exercise intensity (as an RER of 1.1 is a secondary marker of VO2peak). During recovery, RER values decreased to 0.758, evidencing an increased reliance on fats and aerobic metabolism. The exercise portion of the protocol produced oxygen consumption levels as high as 1.09 L/min, which is 73% higher than resting values (0.29 L/min). During the recovery phase, oxygen consumption levels returned to 0.30 L/min after two hours of recovery. Muscles take longer to reach a steady rate of oxygen consumption following moderate- to high-intensity aerobic exercise, which elicits a considerably greater oxygen deficit than low intensity exercise. Elevated oxygen uptake following moderate intensity exercise sustains the slightly elevated levels of physiologic function by replenishing high-energy-phosphates depleted during the suspension-training workout [15]. The average caloric expenditure during the testing session significantly increased from 1.41 kcal/min at rest to 5.33 kcal/min during the workout, and returned to 1.44 kcal/min during the two-hour recovery phase. These results suggest that the suspension training workout used in this study was moderate intensity, given that caloric expenditure during moderate intensity physical activity for the college-age men generally ranges from 5.0-7.4 kcal/min [19]. Another variable of interest is excess post-exercise oxygen consumption (EPOC), which reflects the general disturbance in the body’s homeostasis caused by exercise. EPOC values indicate the magnitude of increased rate of oxygen intake following the suspension training workout that is intended to negate the body's oxygen deficit caused by the strenuous activity [15]. Elevated oxygen consumption post-exercise results in increased energy expenditure that contributes to the overall metabolic cost of an exercise bout [20]. During the two-hour recovery period, the average VO2 was 3.76 ml/kg/min, no different than rest (3.59 ml/kg/min), suggesting there was not an elevated metabolism post exercise. However, when looking at the first 30 minutes of recovery, the average VO2 was 4.05 ml/kg/min. The magnitude of EPOC values is proportional to the intensity of the exercise performed, thus higher intensity exercise will elicit a greater EPOC values and will increase the time it takes for oxygen consumption levels to return to resting values [20].
5. Conclusions
- Based on the data collected from this experiment, the suspension training workout performed in this study appears to provide a moderate (based on HR and caloric expenditure) to high (suggested by lactate data) intensity cardiovascular workout. The ACSM currently recommends that all healthy adults accumulate at least 150 minutes of moderate intensity activity (including cardiorespiratory and resistance exercise) each week [21]. This study certainly shows that a suspension training workout will elicit a moderate-intensity cardiovascular stimulus. Further, the authors theorize that suspension training can also provide a resistance training stimulus for most adults, thus making this a viable modality for achieving recommended physical activity goals.The benefits of interval training, both from a health and performance perspective, have been known to scientists for some time, and are now being realized by the general population [22]. Interval training leads to adaptive responses by the body, such as increased blood volume and capillary proliferation that aid in the delivery of oxygen to working muscles while muscles develop a higher threshold to lactate buildup and improve lactate removal [23]. Combined with stimulating weight loss, the argument can be made that a suspension-training exercise program can be a useful tool for weight loss and improved fitness. Both of which are directly related to improved health and decreased all-cause mortality.While more work is needed to determine the effects of prolonged suspension training programs on cardiovascular fitness, muscular strength, weight loss, and sport performance the results of this study lead us to conclude that suspension training is a simple and effective way for individuals to burn calories, stimulate cardiovascular adaptations and achieve a moderate-intensity cardiovascular workout.
References
| [1] | Sports & Fitness Industry Association: Sports and Fitness Industry Surpasses $80. [cited 2014 May 7th ]; Available from:https://www.sfia.org/press/631_Sports-and-Fitness-Industry-Surpasses-$80-Billion-in-Wholesale-Sales. |
| [2] | TRX Training. [cited 2015 January 15th]; Available from: https://www.trxtraining.com/. |
| [3] | Joaquin Calatayud, S.B., Juan C. Colado, Fernando F. Martin, Michael E. Rogers, David G. Behm, Lars L. Anderson, Muscle activation during push-ups with different suspension training systems. Journal of Sports Science and Medicine, 2013. 13(3): p. 502-510. |
| [4] | Ronald L. Snarr, M.R.E., Electromyographic comparison of traditional and suspension push-ups. Journal of Human Kinetics, 2013. 39: p. 75-83. |
| [5] | Li Jianchen, Z.K., SHI Yutao, FENG Guoqun, YUAN Huan, Suspension training in core strength training of skill dominated performing event- in view of diving events. Journal of Wuhan Institute of Physical Education, 2010(2): p. 53-57. |
| [6] | Anywhere, F. TRX: Drew Brees Workout. 2015 [cited 2015 March 10]; Available from:https://www.trxtraining.com/products/trx-performance-drew-brees-workout. |
| [7] | Burns, N. Suspension Training: How Risky Is It? Fashion & Style 2007 [cited 2015 March 11]; Available from: http://www.nytimes.com/2007/02/01/fashion/01Fitness.html?pagewanted=all&_r=0. |
| [8] | Schmitt, B. TRX Suspension Training. [cited 2015 March 12]; Available from:http://www.ymcacharlotte.org/branches/harris/healthyliving/hwf/personalfitness/trx.aspx. |
| [9] | Floyd, A.G., N.N. Stone, and R.G. Stock, The Effect of Adjuvant Hormone Therapy on Biochemical Control, Sexual Function, and Urinary Symptoms in Low Risk Prostate Cancer Patients Treated with Brachytherapy. International Journal of Radiation Oncology Biology Physics, 2009. 75(3): p. S324-S325. |
| [10] | Levine, J., et al., Tracmor system for measuring walking energy expenditure. European Journal of Clinical Nutrition, 2003. 57(9): p. 1176-1180. |
| [11] | Crommett, A.D. and S.J. Kinzey, Excess postexercise oxygen consumption following acute aerobic and resistance exercise in women who are lean or obese. Journal of Strength and Conditioning Research, 2004. 18(3): p. 410-415. |
| [12] | Hoffman, J.R., et al., Effect of nutritionally enriched coffee consumption on aerobic and anaerobic exercise performance. Journal of Strength and Conditioning Research, 2007. 21(2): p. 456-459. |
| [13] | Melanson, E.L., et al., Validation of the BodyGem (TM) hand-held calorimeter. International Journal of Obesity, 2004. 28(11): p. 1479-1484. |
| [14] | Franklin, B.A., ed. ACSM's Guidelines for exercise testing and prescription. 6 ed. 2000, Lippincott Williams and Wilkins: Philadelphia. |
| [15] | McArdle, W., Katch, F., Katch, V., Essentials of Exercise Physiology. 2006, Blatimore, MD: Lippincott Williams & Wilkins. |
| [16] | Hansel, B., et al., What is the most relevant definition of orthostatic hypertension: systolic blood pressure's drop, diastolic blood pressure drop, or either? Archives Des Maladies Du Coeur Et Des Vaisseaux, 2007. 100(8): p. 637-641. |
| [17] | Godfrey, R.J., Z. Madgwick, and G.P. Whyte, The exercise-induced growth hormone response in athletes. Sports Medicine, 2003. 33(8): p. 599-613. |
| [18] | Harris, C.L. Indirect calorimetry - practical applications. Clinical Window: GE Medical Systems Website, 2003. 15. |
| [19] | Darling JL, L.J., Laubach LL, Energy expenditure of Continuous and Intermittent Exercise in College aged males. JEPonline, 2005. 8(4): p. 1-8. |
| [20] | Townsend, J.R., et al., Excess Post-Exercise Oxygen Consumption (Epoc) Following Multiple Effort Sprint and Moderate Aerobic Exercise. Kinesiology, 2013. 45(1): p. 16-21. |
| [21] | Garber, C.E., Blissmer, B. The quantity and quality of exercise for developing and maintaining cardiorespiratory, musculoskeletal, and neuromotor fitness in apparently healthy adults: Guidance for health and fitness professionals on prescribing exercise. Medicine and Science in Sports and Exercise, 2011. 43, 1334-1359. |
| [22] | Weston, M., et al., Effects of Low-Volume High-Intensity Interval Training (HIT) on Fitness in Adults: A Meta-Analysis of Controlled and Non-Controlled Trials. Sports Medicine, 2014. 44(7): p. 1005-1017. |
| [23] | Rakobowchuk, M., et al., Sprint interval and traditional endurance training induce similar improvements in peripheral arterial stiffness and flow-mediated dilation in healthy humans. American Journal of Physiology-Regulatory Integrative and Comparative Physiology, 2008. 295(1): p. R236-R242. |
 Abstract
 Reference
 Full-Text PDF
 Full-text HTML