-
Paper Information
- Previous Paper
- Paper Submission
-
Journal Information
- About This Journal
- Editorial Board
- Current Issue
- Archive
- Author Guidelines
- Contact Us
International Journal of Sports Science
p-ISSN: 2169-8759 e-ISSN: 2169-8791
2014; 4(6): 212-217
doi:10.5923/j.sports.20140406.02
Obesity and Exercise-Induced Airway Obstruction Measured by Impulse Oscillometry
 Abstract
 Reference
 Full-Text PDF
 Full-text HTML
Mustafa Moradi1, Ismael Idani2, Mohsen Ghanbar Zadeh1, Mohammad Hossein Sepehri1
1Department of exercise physiology, Faculty of Physical Education and sports sciences, Ahvaz, Iran
2Department of Medicine, Respiratory Investigation Unit, Ahvaz, Iran
Correspondence to: Mustafa Moradi, Department of exercise physiology, Faculty of Physical Education and sports sciences, Ahvaz, Iran.
| Email: |  |
Copyright © 2014 Scientific & Academic Publishing. All Rights Reserved.
Background: the efficacy of impulse oscillometry (IOS) as an effortless technique for detection of different aspects of airway resistance in non-athlete obese men has not been fully appreciated. The objective was to evaluate concomitant airway responses induced by obesity and exercise pre and post an exercise bronchial provocation test and to recognize whether IOS variables relate to spirometry variables. Settings: 15 obese (BMI ≥ 35) and 13 lean (BMI ≤ 25) young men were enrolled in the study. Spirometry and IOS parameters were performed at baseline and for 20 mints after a treadmill exercise challenge of 8 minutes at 5-mint intervals. Heart rate (200 - 0.5 × age) was documented to verify exercise intensity. Obese subjects were screened based on the criteria of having a well-preserved FEV1/FVC ratio. Results: Correlations were found between resting FEV1 and IOS except for Ax (area of reactance) in the obese group. R5 at 5-min post-challenge was well correlated with the percent decrease in FEV1. Spirometry revealed significant differences in post-challenge percent changes only at 5-min after exercise; however, IOS identified differences in respiratory resistance at 5 and 10-min post-challenge time points. In obese group, sensitivity for X and R5 was 86% and 78%, respectively. Conclusions: obesity had no additive effects on proximal airway changes induced by exercise; however, IOS detected a difference in degree of small peripheral airway response to exercise in obese group, suggesting that IOS is a more sensitive measure of exercise-induced airway narrowing. IOS parameters, especially Ax may be more sensitive for detection of pulmonary function in obese people.
Keywords: Obesity, Impulse oscillometry, Spirometry, Exercise, Airway narrowing
Cite this paper: Mustafa Moradi, Ismael Idani, Mohsen Ghanbar Zadeh, Mohammad Hossein Sepehri, Obesity and Exercise-Induced Airway Obstruction Measured by Impulse Oscillometry, International Journal of Sports Science, Vol. 4 No. 6, 2014, pp. 212-217. doi: 10.5923/j.sports.20140406.02.
Article Outline
1. Introduction
- Obesity is a worldwide public health issue that affects resting and exercise-related respiratory physiology [1]. Most studies have demonstrated a reduction in lung compliance in obese individuals [2] which appears to be exponentially related to BMI [3]. Total respiratory resistance and workload, depending upon severity of obesity, increase in obese individuals [4]. In many studies conducted [5, 6], it was observed that the percentage and distribution of body fat have significant effects on pulmonary function. In the same line, Obesity may be also associated with a reduction in vital capacity (VC) and forced expiratory volume in one second (FEV1) [7]. Investigating of exercise-induced bronchoconstriction (EIB) in obese people is a more complicated issue. EIB has been defined as a transient narrowing of the airways during [8] or shortly after [9] exercise. The condition has been attributed to hyperosmolarity of the bronchial epithelial, release of some chemical mediators, and exchange of water and heat in the airway (reactive hyperemia). The osmotic theory holds that the airway drying as a consequence of exercise hyperventilation (hyperosmolarity) and then reestablishment of intracellular osmolarity on cessation of exercise is thought to cause the release of chemical mediators that result in smooth muscle contraction and EIB response [10].Since exercise is recommended as an effective effort of weight loss and maintenance programs, physical activity, especially more intensive physical endurance could have remarkable outcomes on obese men's pulmonary function. Unknown exercise-related breathing difficulties may be a factor discouraging obese individuals from engaging in exercise programs. In the support of this point, knowing the relation between exercise and obesity and their compound effects on lung function is very important.Despite the high prevalence of EIB, diagnosis is often symptom-based. This justifies the need for more objective testing methods. In obese subjects evaluated with spirometry, we need more sensitive techniques to assess exercise-related restrictive and obstructive abnormalities that hider an exercise program. Different studies [11-13] have already evaluated pulmonary function using the forced oscillation technique (FOT). They have utilized External pressure signals and their resultant flows in FOT to determine lung mechanical parameters. Impulse oscillometry (IOS) superimposing random pressure pulses in the range of 5 to 35Hz on the subject’s tidal breaths; effort-independently provides an estimate of total respiratory system impedance including two parts of resistance and reactance [14]. FOT is unlikely to alter airway smooth muscle tone; because FOT is performed without maximal or forced expiratory maneuvers [15]. The efficacy of IOS as an indirect measure to reflect pre- and post-challenge airway resistance in obese male subjects with intervention of an exercise bronchial provocation test has not been fully compared to spirometry. Therefore, the purpose of this study was to enter obesity debate, exercise and their concomitant effects on airway narrowing detected by IOS compared to spirometry results.
2. Main Body
2.1. Methods and Materials
2.1.1. Subjects
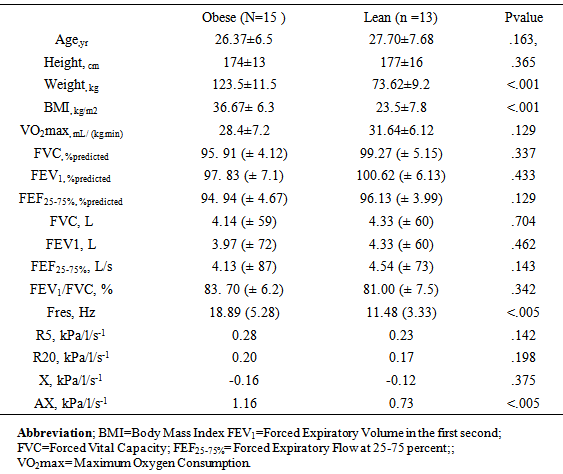
- 28 physically active individuals with probable EIB were enrolled to participate in the study. Descriptive data of participants are presented in table 1. The subjects were divided into 2 groups according to their BMI measurements: an obese group (OG) (those with BMI≥35) and a lean group (LG) (those with BMI≤25). The inclusion criterion was defined as the absence of any intermittent or mild persistent asthma as explained by the Global Initiative for Asthma guidelines [16]. Obese individuals were assessed for not having hypertension and taking any B-blockers. All details of the study were explained to the volunteers after the written consent was obtained.
|
2.1.2. Medical History
- A medical history questionnaire was completed by the participants prior to any testing. To eradicate any possible safety concern, specific exclusion criteria were reviewed, including: smoking or ex-smoking participants, participants who have cardiovascular disease, suffered an active upper airway infection within 5 weeks prior to study and those who have been regularly taking asthma medications [17]. The subjects were not allowed to take physical activity and caffeine consumption for minimally one day prior to testing. All subjects were examined for any pulmonary complaints during the course of the study.
2.1.3. Exercise Challenge
- All subjects completed a recommended-8-minutes- running test on treadmill. During the first 2 minutes, exercise was at such intensity that the heart rate would reach at least to 80% to 90% of the predicted maximum heart rate, and during the remaining 6 minutes it should continue at this heart rate [18]. VO2max index was assessed by modified Bruce tests [19]. To consider the intensity prescribed for our obese subjects, OG's Predicted HRpeak was assessed in relation to their VO2max values [20, 21]. For obese individuals, the equation (200-0.5 x Age) was used [21]. A wireless heart rate monitor was used to control exercise intensity (Polar Vantage XL; Finland) throughout the challenge. Exercise challenge and pulmonary function tests from pre to post exercise were performed at ambient temperature of 20˚C (Celsius) and RH <30. The protocol of the study was accredited by the scientific board of the Physical Education Department of Shahid Chamran University of Ahvaz.
2.1.4. Pulmonary Function Test Procedures
- IOS (Jaeger MS-IOS; Hoechberg, Germany; LAB Core Software version 4.61.0.1, 2003) was used to measure Raw and airway reactance in response to EIB-provoking challenge. Flow signals pulsed through 5- to 35-Hz range was superimposed on tidal breathing and real-time measurements were recorded. The data for Raw (R at 5Hz and R at 20 Hz), resonant frequency (Fres), reactance at 5 Hz (X), and Low-frequency reactance area (AX; area of reactance integrated from 5 Hz up to Fres) were collected for 20 minutes after challenge at 5-mint intervals. Pre and post challenge pulmonary function testing (PFT) was determined using a calibrated computerized pneumotachograph spiromtere (Jaeger MasterScreen PC; Hoechberg Germany; LAB Core Software version 4.61.0.1, 2003), immediately following the IOS manoeuvres. All subjects underwent pulmonary function testing in four interval time points (at 5, 10, 15 and 20-mint) following an exercise challenge in accordance with the American Thoracic Society guidelines [22]. FVC was measured by forced exhaling into spirometry lasting maximally for 6 seconds. Two reproducible manoeuvres within 3% of each other were performed before exercise and the best manoeuvre was used to calculate post-challenge falls in FEV1 [11]. Ten percent fall in FEV1 was considered as a significant reduction in spirometry indices [23, 11].
2.1.5. Statistical Analysis
- Descriptive statistics for baseline lung function were calculated for spirometry and IOS recordings. Values obtained were expressed as the mean ± SD. (Statistical Package for the Social Sciences, SPSS 16; Chicago, IL). The Post hoc paired t tests were used to compare airway calibre responses when significant F values were obtained. Sensitivity, negative and positive predictive values were evaluated by ROC curve. One way analysis with repeated measures on the last factor test was used to compare post-exercise values with baseline data. Pearson product-moment correlations were used to evaluate relationships between resting and post-challenge measurements determined by spirometry and IOS. The significance level was defined as P≤ 0.05.
2.2. Results
2.2.1. Baseline Lung Function
- Mean resting lung function values from spirometry and IOS are presented in table 1. There were no significant differences between the OG and LG in terms of baseline spirometry results. All lean and obese subjects' resting values were within normal expectations. Significant correlations were found between resting spirometry and IOS values (p<0.05). FVC and FEV1 obviously correlated to R5 (r = - 0.58 and r = - 0.59 for LG and r = - 0.55 and r = - 0.66 for OG respectively). FEV1 percentage of predicted value correlated to AX and Fres only for LG (r = - 0.57 and r = - 0.51 for LG, respectively). Baseline X5 (X at 5Hz) values were slightly higher in the OG group, however the differences were not statistically meaningful (table 1). Basic R5 and R20 data were significantly correlated to post-challenge peak fall in FEF25-75% (r = - 0.59 and r = - 0.44 for LG and OG respectively). No resting spirometric or IOS measures related to post-exercise falls in FEV1.
2.2.2. Airway Response to Exercise Challenge
- Mean post-exercise lung function values from spirometry are shown in figure 1. Peak heart rate during the challenge was 180±13 and 164±15 beats/min for LG and OG respectively. No Significant differences were observed between OG and LG, in post-challenge percent change for FEV1, (figure 1, bottom). Exercise resulted in a greater but statistically not significant difference in FEF25-75% between two groups. The FEV1/FVC ratio was significantly greater for OG after challenge (P<0.05). Figure 2 presents percentage changes in IOS parameters for 4 incremental post-challenge time points. The only non-significant post-challenge parameter between two groups were R5 and R20. A significant difference was observed between two groups in AX, X and Fres respectively (figure 2) especially at 5- and 10-min post-challenge time points (P<0.05).
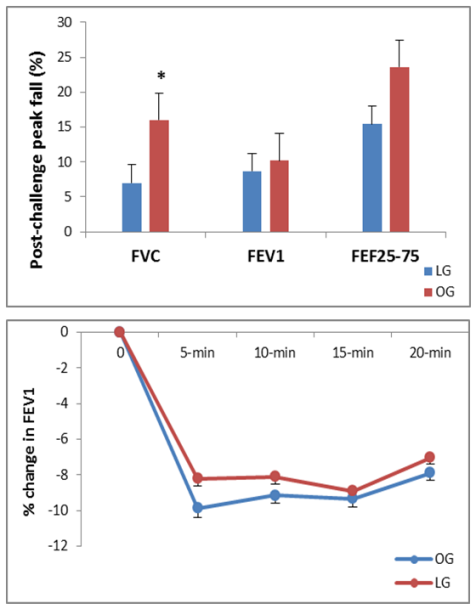 | Figure 1. Top: Post challenge peak falls in pulmonary function measured by spirometry. Bottom: post-challenge percentage changes in FEV1 for 20 min After challenge in 5min intervals. No significant difference was observed between two groups. Values are presented as ± SE |
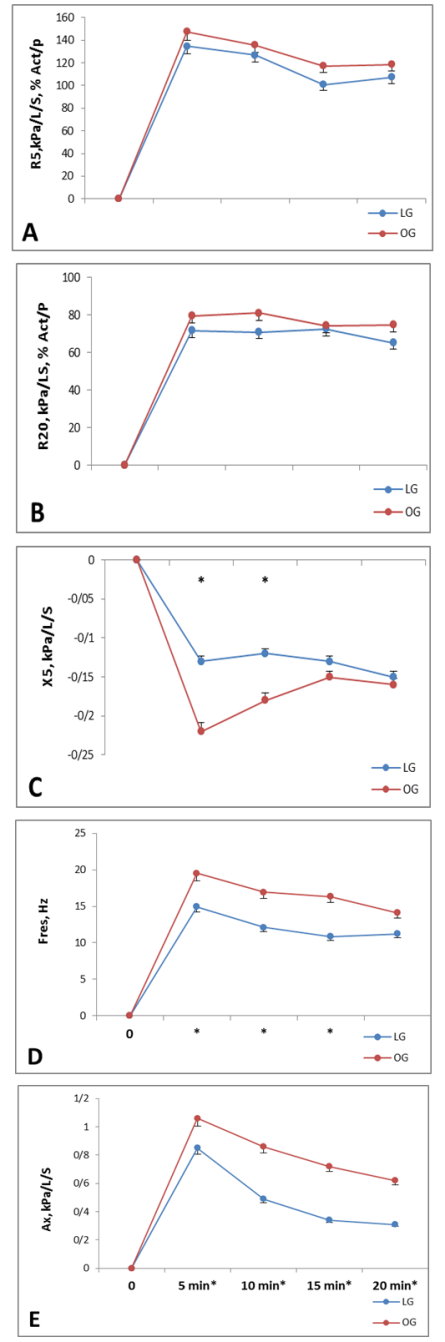 | Figure 2. Post-challenge serial changes in R5 (A) [kPa/L/S], R20 (B) [kPa/L/S], X (C) [kPa/L/S], Fres (D) [Hz] and Ax (E) [kPa/L/S] from baseline until 20 min after challenge in 5-min intervals. X, Fres and Ax were significantly greater for OG (p< 0.05). values are presented as as ± SE |
2.2.3. Relationship between Spirpmetry and IOS
- Strong correlations were observed within the pre- and post-exercise percentage change values for spirometry and IOS parameters in OG and LG. post-challenge peak fall in FEV1 was significantly correlated to peak increase in R5 (LG, r = 0.67; OG, r = -0.77; P<0.05). Peak decrease in FVC significantly correlated with peak increase in FEV1/ FVC (OG; r = -0.77; P<0.05). Peak increase in FEV1/FVC ratio was significantly correlated with Fres, AX and X, respectively (r = 0.81; r = 0.87; r = 0.91) for LG. Peak increase in R5 was significantly correlated to peak increase in Fres, AX and X (only at 5-min post-challenge time point) (OG, r = 0.79; r = 0.87; r = 0.80; respectively; and LG, r = 0.74; r = 0.81; r = 0.80; respectively; P<0.05). Peak increase in Fres was significantly correlated to peak increase in AX and X (OG, r = 0.87; r = 0.79 respectively; and LG, r = 0.90; r = 0.68; respectively; P<0.05). Peak increase in AX was significantly correlated to peak increase in X (OG, r = 0.91; respectively; and LG, r = 0.80; respectively; P<0.05).
2.3. Discussion
- The aim of the study was comparing the airway responses of two groups and to examine the effects of obesity accompained with exercise on airway narrowing following an exercise bronchial provocation test and also to examine whether resting and post-challenge IOS parameters correlated with resting and post-challenge spirometric parameters.8 minutes of exercise while running on the treadmill with 80-90% HRpeak was considered as a suitable challenge to provoke EIB response. High correlations were found between spirometric and IOS measures of change in airway function, suggesting a close equivalency of the two methods. IOS, interestingly, demonstrated a difference in the degree of peak response in two groups, whereas spirometry only detected a difference at the 5-min post-exercise time point, indicating that IOS is a more sensitive measure of change in airway responses. Post-challenge FEV1 as an exercise bronchial provocation criterion was considered the gold standard indirect measure of changes in airway responses. In comparison to the most widely accepted index of EIB [24], the results of post-exercise change in IOS parameters showed that IOS is a reliable measure of lung function, especially in obese subjects. The sensitivity for X (the best value in IOS measurements for determining restrictive abnormalities) was 81% and 86% in OG and LG, respectively, and the sensitivity for R5 (the best value in IOS measurements for determining obstructive abnormalities) were 78% and 75% in OG and LG respectively. Previous studies [12, 25] have demonstrated acceptable sensitivity and specificity for IOS in COPD, asthmatic patients and healthy people in conventional pulmonary function tests. In the same line, some other studies [26, 27] suggested that the frequency dependent measurements of IOS are more pronounced while accruing at the lower frequencies. Bisgaard et al [28] found X at 5Hz to be more sensitive than FEV1 in revealing subclinical bronchial obstruction. Evans et al [3] reiterated that IOS measurements over the range of low frequencies below fares (Ax) provide evidence of exercise-induced airflow obstruction beyond the sensitivity of spirometry. Our results indicate that Ax, demonstrating a statistically greater value for OG at the 5-, 10 and 15-min post-challenge time points, showed to be more sensitive than Raw in detecting obesity-related airway function following an EIB-provoking challenge. Our data support the finding of Buhr and Jorres [29] that revealed X to be more discriminative than Raw in detecting lung function abnormalities.Both the OG and LG were potent to EIB. Significant intermodality correlations were identified between resting spirometry and IOS measures; however, no resting spirometry or IOS correlated with the post-challenge peak fall in FEV1. In consistence, Moradi et al [30] found no relationship between EIB status and baseline lung function in asthmatic and non-asthmatic obese subjects. The observed difference in degree of response for IOS compared to spirometry, may be due to this fact that the forced expiratory manoeuvre may mask changes in airway tone. This is not unexpected, as Skloot et al [31] found that deep inspiration after methacholine by obese adults resulted in a deep inspiration-induced bronchodilation of similar magnitude to non-obese subjects. Other studies [32, 34] have reported similar findings in subjects with airway hyperresponsiveness and asthma.Although, EIB response may have been elicited by a similar mechanism in two groups, the higher values in peak fall in OG’s IOS and spirometric data may be related to restrictive abnormalities. In OG, the resistance spectrum was independent of frequency, but the resonant frequency (Fres) shifted to a higher value. In support of this, Smith et al [14] reported that the restrictive impairments of the distal respiratory tract caused Fres to be increased above normal range. Intense exercise heavily influences airway resistance [35] and obesity specifically abdominal and chest wall fat pushing in on the rib cage and lungs and abdominal load pushing up on the diaphragm and its downward motion, alter the mechanical properties of the lungs. In addition, exercise-related effects may be attributed to some factors such as the closure of some peripheral airways and dilated lungs due to exercise-induced increase in breathing rate that leads to a reduction in dynamic compliance and an inevitable reduction in peak expiratory flow. All the same, the exact percentage of this influence, individually, remains obscure to us. No significant difference in peak fall in FEV1 between two groups suggests that obesity may not influence large airway resistance.
3. Conclusions
- In conclusion, our results indicate that IOS is indeed sensitive to airway calibre changes following a sub-maximal exercise challenge and can be considered as a surrogate to spirometry in evaluating EIB in obese subjects. In addition, IOS is reliable for assessing both proximal and peripheral obstruction as well as pulmonary reactance. While obesity may affect small airway function, it may not affect large airways. In comparison to lean subjects, exercise along with obesity, may impose its powerful influence on reactive features of lung compliance.