-
Paper Information
- Previous Paper
- Paper Submission
-
Journal Information
- About This Journal
- Editorial Board
- Current Issue
- Archive
- Author Guidelines
- Contact Us
International Journal of Sports Science
p-ISSN: 2169-8759 e-ISSN: 2169-8791
2014; 4(5): 165-172
doi:10.5923/j.sports.20140405.03
Muscle Synergy during Wingate Anaerobic Rowing Test of Collegiate Rowers and Untrained Subjects
 Abstract
 Reference
 Full-Text PDF
 Full-text HTML
Shazlin Shaharudin1, 2, Damiano Zanotto3, Sunil Agrawal3
1Sport Science Unit, School of Medical Sciences, Universiti Sains Malaysia, 16150 Kota Bharu, Malaysia
2Biomechanics and Movement Science Program, University of Delaware, 19716 DE, USA
3Department of Mechanical Engineering, Columbia University, 10027 NY, USA
Correspondence to: Shazlin Shaharudin, Sport Science Unit, School of Medical Sciences, Universiti Sains Malaysia, 16150 Kota Bharu, Malaysia.
| Email: |  |
Copyright © 2014 Scientific & Academic Publishing. All Rights Reserved.
The purpose of this study was to evaluate the muscle synergies during Wingate anaerobic rowing test of collegiate rowers and physically active individuals who were not specifically trained in rowing. As a power-endurance sport, high anaerobic capacity is one of the determinants of rowing performance. Due to the close link that exists between the state of energy supply and types of muscle fibers being recruited, the relationship of muscle synergies and rowing economy during an anaerobic dominant activity was investigated. Method: Ten subjects were recruited for both groups. Muscle synergies were extracted from 16 rowing specific muscles using Principal Component Analysis (PCA) with varimax rotation. An all out Wingate anaerobic rowing test was performed on Concept 2 sliding ergometer. Rowing performance, muscle synergies and physiological variables were analyzed. Results: Rowers showed better rowing performance in terms of peak power output, mean power output, distance covered, maximal oxygen consumption and energy expenditure compared to the untrained subjects. Three muscle synergies were extracted from both groups with some variability of timing coefficients and muscle weightings. A significant association was found between Synergy #1 and rowing economy, although there was no difference among the groups. Discussion: Expertise in rowing was related to the ability to adjust the sequence of synergies activation and the muscle weightings activation level during intense anaerobic burst. The rowers could apply the results from this study to improve rowing economy especially during the start of the rowing race, where anaerobic metabolism is predominant.
Keywords: Rowing, Muscle synergy, Anaerobic
Cite this paper: Shazlin Shaharudin, Damiano Zanotto, Sunil Agrawal, Muscle Synergy during Wingate Anaerobic Rowing Test of Collegiate Rowers and Untrained Subjects, International Journal of Sports Science, Vol. 4 No. 5, 2014, pp. 165-172. doi: 10.5923/j.sports.20140405.03.
Article Outline
1. Introduction
- A distinctive attribute of the rowing activity is the unique pattern of energy utilization [1]. The rowing races typically begin with a surge of intense anaerobic activity, followed by sustained maximum effort at 90-95% of aerobic capacity until the final sprint to the finish [2]. In fact, many studies have investigated the energy contributions [1], [3], [4], [5] during ergometer rowing. They noted that during rowing races, the rowers derived about 12% - 30% of anaerobic metabolism [4], [5], [6] and about 70% - 86% of aerobic metabolism [4], [5], [7] from the total energy metabolism. Huge contributions from both energy pathways entitle the rowing to be called a power endurance sport [8]. Specifically on anaerobic metabolism, it is capable to yield faster energy compared to aerobic metabolism but it lasted for a short period of time. Therefore, the anaerobic contribution is the key metabolism during the starting section of a rowing race which aimed to overcome the inertia of the rowing shell [9]. Besides, in a 2000m indoor rowing test, 75.7% of the variance in rowing performance time was accounted for by the mean power during the Wingate test and only 12.1% of variance was related to VO2max [10]. Hence, the importance of great anaerobic capacity for rowers was further emphasized. Besides, rowing engages most of the principal muscle groups of the upper and lower body such that a larger fraction of total muscle mass is recruited when rowing compared to cycling (30 kg muscle mass compared to only 15 kg in a 70 kg male) [11]. The recruitment of greater muscle mass could potentially compromise muscle perfusion, particularly during heavy exercise [12] such as during all-out rowing, where a larger fraction of maximal cardiac output was utilized. Furthermore, a close relationship of the state of energy supply and types of muscle fibers being recruited [13] further complicate the performance factor. Hence, the importance of muscle synergy prevailed as the muscle coordination patterns could potentially limit the power output from a limb [14], and thus could be a determining factor of performance.Muscle synergy was defined as a specific and consistent spatiotemporal pattern of muscle activations that leads to similar joint trajectories [15] and has been proposed as a neural strategy for simplifying the neuromuscular control. These synergies can be identified from electromyographic (EMG) patterns recorded from numerous muscle decomposition algorithms (e.g principal component analysis, PCA) based on two components, (i) “muscle synergy vectors” which corresponds to the relative loading of each muscle within each synergy; and (ii) “synergy activation coefficient” which represents the temporal activity of the muscle synergy [16]. Synergy studies of human movement have been extensively studied in balance [17], cycling [18], [19], walking [20], running [21] and even rowing [22]. A number of movement studies showed the robustness of synergies through different mechanical load [19], speed [18], [20], force direction [17], effect of aging [23] and training [24], but currently there was no studies which have evaluated the muscle synergy relationship to energy metabolism particularly in anaerobic pathway. Therefore, the purpose of this study was to evaluate the muscle synergy during Wingate anaerobic rowing test and further investigate the relationship between muscle synergy and rowing economy.
2. Methods
2.1. Subjects
- Ten physically active males (age: 26.78 ± 2 years, mass: 76.56 ± 8 kg, height: 1.81 ± 0.1 m) and ten collegiate male rowers (age: 20.36 ± 3.4 years, mass: 79.47 ± 8.1 kg, height: 1.82 ± 0.1 m) volunteered to participate in the study. The collegiate team was recruited at the end of their competitive season and was significantly younger than the untrained group with similar height and mass. The untrained group consisted of physically active individuals who participate in various sports such as triathlon, cycling, running, swimming and rugby but not specifically trained in rowing. Subjects were physically healthy without any musculoskeletal injuries with at least three years of experience in competitive rowing for the rowers. A written informed consent was obtained from all subjects. All tests and scientific experiments complied with the ethical code of Declaration of Helsinki and University of Delaware Internal Review Board.
2.2. Experimental Setup
- Experiments were carried out on a Concept 2 model D ergometer (Morrisville, Vermont, USA). The slides system consisted of a pair of rails that was attached to the ergometer to simulate on-water (OW) rowing mechanics. Resistance was adjusted relative to the body weight of each subject to resemble the resistance effect during OW rowing [25]. Simultaneous visual feedback on heart rate, stroke length, stroke rate, power output and distance covered were provided to subjects through a monitor. Stroke-to-stroke data were assessed and averaged in 30s intervals by the RowPro v2.006 software (Digital Rowing) in conjunction with the Concept 2 interface. The muscle activity was recorded using wireless Noraxon Telemyo DTS Desk Receiver (Noraxon, Scottdale, AZ). 16 rowing-specific muscles were evaluated on the right side of the body: Soleus (SOL), Gastrocnemius Lateralis (GL), Tibialis Anterior (TA), long head of Biceps Femoris (BF), Semitendinosus (ST), Rectus Femoris (RF), Vastus Lateralis (VL), Erector Spinae (ES), Lattisimus Dorsi (LD), Trapezius Medialis (TRAP), Deltoid Medius (DM), Triceps Lateralis (TRI), Abdominis (AB), Pectoralis Major (PEC), Biceps Brachialis (BB) and Brachioradialis (BR). Pairs of surface Ag/AgCl wet gel electrodes (Noraxon, Scottsdale, AZ) were attached to the skin with a fixed 20 mm inter-electrode distance. Before the electrodes were applied, the skin was shaved and cleaned with alcohol to minimize impedance. Electrode placement followed the recommendations by SENIAM [26] for all muscles, except for LD and BR, which were not referenced by SENIAM. For LD, we followed the suggestion of [27] by positioning the electrodes on the muscular curve at T12 and along a line connecting the posterior axillary fold and the S2 spinous process. For BR, the electrode was placed at 1/6 of the distance from the midpoint between the cubital fossa to the lateral epicondyle of the ulna [28]. Raw EMG signals were recorded at sampling rate of 1500 Hz. The position and orientation of the wrist joint projected along the longitudinal axis of the ergometer (i.e., the rowing direction) was analyzed to define the rowing cycle. The three-dimensional trajectories were captured using ten infrared cameras (Vicon MX, Oxford, UK). The spatial accuracy of the system was better than 1 mm (root mean square). The points of local maxima and minima indicated catch and finish positions, respectively. These were used to identify the drive phase (i.e., from catch to finish position) and the recovery phase (i.e., from finish to catch position). The rowing cycle was defined as the time between two successive local maxima. The position data were sampled at 100 Hz, filtered (Butterworth filter, cutoff frequency: 5Hz) and synchronized to electromyography (EMG) data through Vicon Nexus Workstation v4.5 (Vicon, Oxford, UK). The metabolic variables such as oxygen consumption (VO2), carbon dioxide production (VCO2), ventilation (VE) and respiratory exchange ratio (RER) were measured by Cortex MetaMax3B portable metabolic system (MM3B, Leipzig, Germany). The system was determined to provide reliable and valid measurements of metabolic demands for rowing physiological tests [29]. The breath-by-breath MetaMax3B measurements were averaged over 30s interval. The heart rate was measured continuously (Polar, Electro Oy, Finland) in synchrony with the data from the ergospirometer system. Anaerobic threshold (AT) is defined as the point when the anaerobic component initiates the increment of lactate concentration, blood acidosis and respiratory CO2 [30]. High anaerobic threshold indicate the ability to perform optimal exercise intensity for extended period [30] and thus gauge athletes’ overall respiratory fitness. AT was automatically measured by the integrated ergospirometer system software (MM3B, Leipzig, Germany) and was expressed as percentage of VO2 max. The VO2 max was defined as the highest VO2 value that met two out of these three criteria [31], [32]: (i) 90% of age-predicted maximum heart rate; (ii) respiratory exchange ratio 1.2; and (iii) a plateau of VO2 (less than 0.15 L/min increase in VO2). Energy expenditure (kJ/min) was calculated following [33]:
 | (1) |
2.3. Protocol
- Subjects were asked to refrain from food and beverages (except water) for two hours before testing. They wore their own shoes and skin-tight Lycra shorts to facilitate markers and electrodes placement. The overall protocol took approximately 60 minutes including the preparation time. Separate familiarization session was carried out for the untrained group. The actual experiment consisted of: i) 5 minutes warm up with intermittent sprint, ii) 30s all-out Wingate anaerobic rowing test, and iii) 5 minutes cool down, on the ergometer following the protocol by [10] and [30]. However, unlike these studies which applied maximum resistance during Wingate anaerobic rowing test for all subjects, the resistance was adjusted relative to the body weight of each subject following the database provided by the manufacturer. This was because the performance of the Wingate anaerobic test was correlated to the body mass [37]. Care was taken to reduce the effect of inertia at the start of the sprint test by allowing the subjects to row without resistance at a constant pace for 10s followed by increment of the relative resistance to initiate the test. This step was taken following [30] suggestion to reduce the inertia at the start of the test. Subjects were told to attain maximal power output during the test. Verbal encouragement was given during the test.
2.4. Data Analysis
- EMG signals were band-pass filtered (20-400 Hz, zero-lag 6th order Butterworth filter), fully rectified and low-pass filtered (8 Hz, zero-lag 2-nd order Butterworth filter) to create linear envelopes. Then, the linear envelopes were recognized into individual rowing cycles and time-normalized to a 100-point time base. Next, a set of 15 consecutive rowing cycles from the start of the Wingate anaerobic rowing test was averaged to obtain a representative pattern for each muscle. These patterns were subsequently normalized to their peak value. All analyses were conducted using custom MATLAB code (The Mathworks, Inc., Natick, MA).
2.5. Factor Analysis
- Principal Component Analysis (PCA) was applied to extract the muscle synergy as suggested by [20]. PCA was chosen to analyze the underlying factors or associations in a huge dataset of muscle activity. Rejection of the hypothesis of the Bartlett’s test signifies latent factors in the data and was therefore a requirement for PCA [20], [38]. The Kaiser-Meyer Olsen (KMO) [39] test measured the adequacy of the sample size for the factor analysis and a value greater than 0.6 indicated a good sampling size for PCA [40]. PCA with varimax rotation was applied after all the prerequisite tests were met. Varimax was an orthogonal rotation method which constrained the analysis to uncorrelated factors and commonly adopted in factor analysis for muscle synergy studies [20], [21]. The robustness of the number of factors to be retained from PCA was ensured through several statistical methods: (i) to retain factors that have eigenvalues greater than 1 [40], (ii) to retain those eigenvalues that occurred before the inflection point of the scree plot [41], (iii) Parallel Analysis (PA) [42], which compared the obtained eigenvalues with randomly generated eigenvalues, thus the obtained eigenvalues must be larger than the random data, and finally (iv) Minimum Average Partials (MAP) [43] which was an iterative procedure that examined successive partial correlation matrices. In muscle synergy studies, an additional important aspect to decide the number of factors to retain was the interpretability [20], [21] of the factors related to the physiological function.
2.6. Statistics
- The inter-group indices of similarity were computed on Z-transforms of individual EMG patterns and synergy activation coefficients [21], [22]. Independent T-test was used to compare the subjects’ characteristics, rowing performance, physiological variables and each muscle weightings between the groups. The association of muscle weightings from Synergy #1 and rowing economy was tested using non-parametric Friedman’s test because the data violated the assumption of homogeneity of variance. Wilcoxon post-hoc test with Bonferroni correction was applied when any significant was detected. Significance value was set to α = 0.05. All statistical tests were carried out in IBM SPSS Statistics v20.0 (IBM Corp., Armonk, NY).
3. Results
3.1. Rowing Variables
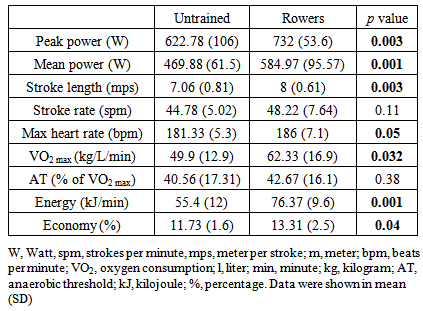
- Overall, rowers exerted significantly greater energy expenditure, peak and mean stroke power with better rowing economy compared to the untrained subjects during the rowing Wingate anaerobic test (Table 1).
|
3.2. EMG Patterns
- All muscles showed high inter-group index of similarity with Pearson r ranging from 0.874 to 0.96 (except for TA, r = 0.75). The ensemble averages of the EMG linear envelopes for 16 muscles investigated for both groups were presented in Figure 1.
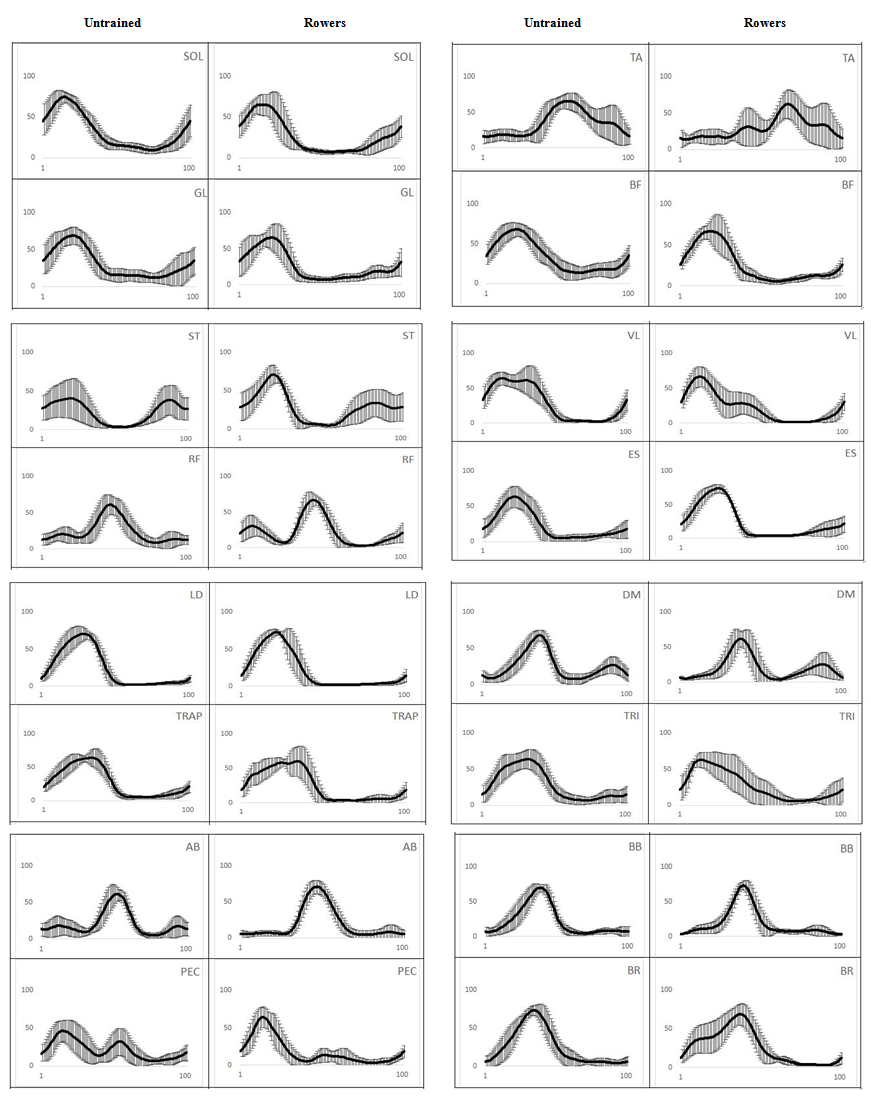 | Figure 1. Ensemble averages of normalized EMG patterns of the 16 recorded muscles during Wingate rowing test for untrained subjects and collegiate rowers. Rowing phase from 0% to 50% indicates drive phase and from 51% to 100% signifies the recovery phase. Muscle abbreviations are described in text |
3.3. Muscle Synergy
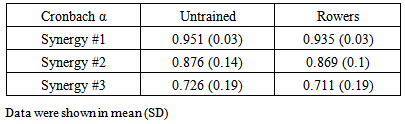
- Both groups yielded acceptable KMO statistics (untrained: 0.606 ± 0.03; rowers: 0.609 ± 0.04), indicating that the data were adequate for PCA. PCA with varimax rotation was applied, and following Kaiser’s criterion, scree plot, PA and MAP analysis, we observed that three synergies were sufficient to explain 90% of total Variance Accounted For (VAF) in both groups. The indices of similarity for synergy waveform between groups were acceptable for all the synergies (synergy #1 = 0.832; synergy #2 = 0.854; and synergy #3 = 0.676). High Cronbach’s α value showed the repeatability of data (Table 2). Synergies activation coefficients and muscle loadings were depicted in Figure 2 and Figure 3, respectively. Muscles with loading factor greater than 0.55 [42] were considered as contributors for a specific synergy.
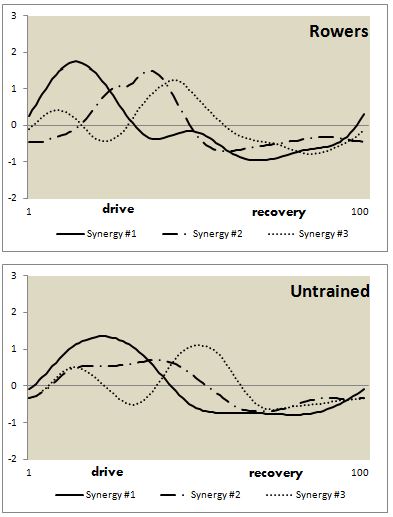 | Figure 2. Synergy activation coefficients and muscle synergy vectors depicted for Wingate rowing test of untrained subjects and collegiate rowers. Synergy activation coefficients were averaged across the subjects for the three extracted synergies and expressed as a function of percentage of the rowing cycle (0% to 50% represent drive phase and 51% to 100% represents recovery phase) |
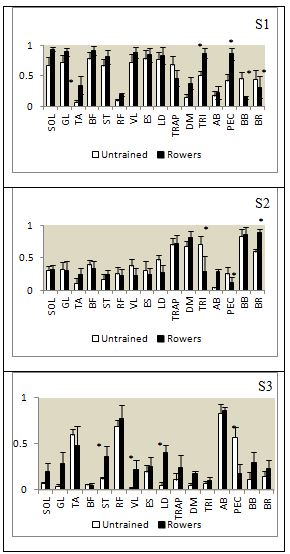 | Figure 3. Muscle synergy vectors depicted for Wingate rowing test of untrained subjects and collegiate rowers. The muscle synergy vectors were averaged across the subjects for the three extracted synergies. Individual muscle weightings are depicted for each muscle within each synergy. Asterisks indicate significant difference of muscle loadings between groups (paired T-test, p < 0.05) |
|
3.4. Muscle Synergy and Rowing Economy
- The effect of muscle weightings of Synergy #1 on rowing economy was tested using Friedman’s test. As Synergy #1 accounted for almost half of total VAF synergies (54.17 ± 6.9 for untrained; 50.3 ± 6.1 for rowers), we hypothesized that the effect of Synergy #1 on rowing economy would be apparent. Friedman’s test was utilized instead of ANOVA (suggested by Wakeling et al., 2010) because our data violate the assumption of homoscedasticity (Levene’s test p < 0.05). Post-hoc comparisons were carried out with Wilcoxon signed-rank tests (Bonferroni correction) where appropriate. We found that Synergy #1 of both rowing groups showed significant association between muscle loadings and rowing economy (untrained and rowers, p = 0.001). Post hoc analysis (with Bonferroni correction) revealed significant association of each muscle loadings to rowing economy for untrained subjects (p < 0.007), but not all muscle loadings showed significant association to rowers’ economy (p > 0.005).
4. Discussion
- It is important for the rower to develop an effective coordination between upper and lower body [45], since a non-optimal strategy could limit the power output and the efficiency of the limb motion [14], [46]. These observations suggest a fundamental role of muscle synergy during rowing. Our basic finding, namely, that three component factors (e.g. muscle synergies) were accounted for the activation of muscles during Wingate anaerobic rowing test, was reported earlier by [22] who extracted synergies from 23 muscles in nine subjects. They observed the same basic patterns across varying expertise level [22], power outputs [47], and fatiguing condition [48]. We have extended these results by showing that the basic patterns were conserved during anaerobic dominant activity across different skill levels. Besides, by including the physiological variables, our study showed that the association of muscle synergy to rowing economy was substantial. The similarity in the composition of three extracted synergies in both groups was accompanied by slight emphasis on particular muscles. For Synergy #1, both groups recruited SOL, GL, BF, ST, VL, ES and LD which were the main force generator during drive phase. In addition, the TRI and PEC muscles were included for Synergy #1 of the rowers group. Next, the force generated was transferred to the upper limb muscles of Synergy #2. In terms of timing, the rowers were able to recruit the Synergy #1 and #2 successively during drive phase which ensured efficient force transferred. Also the small fraction of time between the peak of Synergy #1 and #2, showed the opportunity for the rowers to utilized bio-compensation strategy in terms of muscle recruitment. The term was coined from a study of muscles frequency pattern by [49] where the strategy of alternately emphasized different major muscle groups indicated the ability to share the workload between muscles without compromising the power output. However, the same temporal pattern was not observed in untrained subjects, where the force was generated simultaneously by the muscles from both Synergy #1 and #2 during the whole drive phase. The lack of distinction in terms of the synergy recruitment timing indicated the inability to utilize the bio-compensation strategy and further hampered the power output. Our observations agreed with [49] where the bio-compensation strategy was the hallmark of expertise in rowing. Meanwhile, the Synergy #3 was comprised of TA, RF and AB which occurred during the transition of rowing phase. These muscles controlled the posture during the changing of stroke position. The untrained subjects recruited PEC as an additional muscle for Synergy #3. This was probably due to the second burst of this muscle during the transition period. Regarding the rowing performance variables, the rowers exhibited greater power output compared to the untrained subjects despite similar level of physiological fitness. They also exerted more energy expenditure than the untrained group. The stroke rate was not differed between the groups although the rowers had longer stroke. Longer and slower strokes could generate greater impulse because the torque elevated in proportion to the square of movement frequency, hence low cycle frequency is more mechanically efficient [50]. The rowers exhibited greater rowing economy compared to the untrained subjects, although both groups showed high association between the rowing economy and Synergy #1. Therefore, we concluded that there was a substantial relationship of muscle synergy and rowing economy in collegiate rowers and untrained subjects. The exclusion of blood analysis was the main limitation of this study as the specific energy profile [51] was failed to be developed. Although anaerobic Wingate rowing test was a valid and reliable measurement [10], it only assumed that the anaerobic capacity was fully exhausted, due to the intensity and duration of the test [37]. The peak power output which was generated during the first 5 seconds of the test indicated the turnover of phosphagens while the mean power output estimated the energy contribution from the glycolytic system [37]. However, it should be noted that the aerobic component supplies about 20-30% of the total energy [30], [51] during a Wingate anaerobic cycling test. Therefore, Wingate test was only a reflection of anaerobic capacity rather than the exact quantification.The strength of this study was the exclusion of the physiological fitness of the subjects as a confounding factor for the synergies extracted. We also improvised the robustness of muscle synergy extraction by applying PA and MAP tests following PCA. The Wingate anaerobic rowing test was enhanced following the suggestion by [30] and [37] to reduce the inertia at the start of the test and applying relative resistance to the ergometer.
5. Conclusions
- We concluded that the muscle synergy was robust during rowing Wingate anaerobic test as three muscle synergies were extracted from 16 rowing-specific muscles across different skill levels. The small variability of timing coefficients and muscle weightings across groups indicated the effect of training on muscle synergy. The ability to recruit the muscle synergy successively during the sprint part of rowing event distinguished the collegiate rowers from the untrained subjects.
ACKNOWLEDGEMENTS
- The authors wish to thank all the subjects for their enthusiasm. The first author was founded by Ministry of Higher Education Malaysia and Universiti Sains Malaysia.