-
Paper Information
- Next Paper
- Previous Paper
- Paper Submission
-
Journal Information
- About This Journal
- Editorial Board
- Current Issue
- Archive
- Author Guidelines
- Contact Us
International Journal of Sports Science
p-ISSN: 2169-8759 e-ISSN: 2169-8791
2014; 4(5): 152-164
doi:10.5923/j.sports.20140405.02
Improving the Tournament Performance of ATP Players from the Perspective of Efficiency Enhancement
 Abstract
 Reference
 Full-Text PDF
 Full-text HTML
Chia-Hui Tsai1, Duen-Yian Yeh2, Ching-Chyuan Chang3
1Sports Teaching and Research Center, Transworld University, Yunlin 640, Taiwan
2Department of Information Management, Transworld University, Yunlin 640, Taiwan
3Office of Physical Education Affairs, Taipei Medical University, Taipei 110, Taiwan
Correspondence to: Duen-Yian Yeh, Department of Information Management, Transworld University, Yunlin 640, Taiwan.
| Email: |  |
Copyright © 2014 Scientific & Academic Publishing. All Rights Reserved.
This study analysed efficiency changes in the intertemporal tournament performance of tennis players in the Association of Tennis Professionals (ATP) and proposed improvement suggestions to assist these players in improving their tournament performance from the perspective of efficiency enhancement. Nine tournament performance indices were used to evaluate the data collected from 45 ATP players between 2007 and 2010. Data envelopment analysis approach and Malmquist production index were adopted to determine efficiency measures. We used a strategic management map to locate the players in various characteristic groups according to their efficiency measures and provided inefficient players with a distinctive proposal for improving their tournament performance. The proposal had the characteristics of benchmarking learning, hierarchy (including macro-level and micro-level) and customization (for each inefficient ATP player).
Keywords: Tennis, Intertemporal efficiency evaluation, Strategic management map, Evaluation index
Cite this paper: Chia-Hui Tsai, Duen-Yian Yeh, Ching-Chyuan Chang, Improving the Tournament Performance of ATP Players from the Perspective of Efficiency Enhancement, International Journal of Sports Science, Vol. 4 No. 5, 2014, pp. 152-164. doi: 10.5923/j.sports.20140405.02.
Article Outline
1. Introduction
- It has been well-known that a tennis player could successfully improve his/her tournament performance from several perspectives, including technical skill, physiology, psychology, tactics, etc. [1-7]. In practice, tennis players who had poor rankings (or poor performance) would customarily try to enhance their experience and ranking by participating in more tournaments. Thus, the achievement of higher ATP points or ranking might come from the high number of tournament participation, not completely come from the improvement of tournament performance. In fact, hidden in this situation was the perspective of the efficiency regarding player’s tournament performance. The attempt proceeding from the managerial perspective-efficiency enhancement was rarely tried, but might be an alternative way to improve the tournament performance of tennis players.Actually, business enterprises have conducted efficiency enhancement of their staff for many years. “Efficiency” is defined as the comparison of what is actually produced or performed with what can be achieved with the same consumption of resources. “Efficiency enhancement” consists of two parts, efficiency evaluation and performance improvement proposal [8-9]. In practice, most of decision-makers want to know how far a staff can be expected to produce or perform more outcomes with no further resources wasted by efficiency enhancement [10-12]. Basically, the evaluation results provide the enterprise with substantial benefits regarding staff’s job performance [8, 13].On the other hand, numerous studies have explored the application of efficiency evaluations in the field of sports, for example, applications of evaluating the efficiency of nations at summer Olympics [14], of major league baseball players [15], of basketball players [16] and of professional golfers on the PGA, LPGA and SPGA tours [17-18]. In fact, among these past study works, only a few ones proposed concrete suggestions regarding efficiency enhancement for the objects evaluated. For example, in the research of Cooper et al. [16], one of the inefficient centers was advised to raise the number of rebounds per game for enhancing his game efficiency and, however, another was advised to raise the number of free throw goals per game.In tennis competition, each player will tentatively employ various battle strategies to display his strength(s) and hide his weakness(s) and then try to beat his opponent. Although opponents may differ, each player usually follows a specific pattern of battle, which is designed to make full use of his own strengths. For this reason, identifying the strengths and weaknesses of tennis players is vital, particularly for top tennis players. However, from one perspective, the strengths or weaknesses of a tennis player are relative to his opponent and, accordingly, should not be identified barely from his own raw tournament statistics. From another perspective, it is noted that with the raw statistics a given player cannot know either how or how much to improve his tournament in order to perform efficiently. For example, a given player in the Association of Tennis Professionals (ATP)can compare himself with Berdych regarding the maximum percentage of 1st Serve Points Won (79%), with Nadal regarding the maximum percentage of Break Points Saved (70%), with Roddick regarding the maximum percentage of first serve (69%), with Hewitt regarding the maximum percentage of Break Points Converted (49%), etc., but this would mean to use as benchmark a player that in each dimension of the game performs like the best, which is very unrealistic and is not a feasible option for achieving efficient performance. More specifically, in respect of ascertain extent, “efficient performance” is a relative viewpoint [8, 19]. Each tennis player may have his own way to achieve the efficiency of tournament performance.Until recent years, “efficiency evaluation of tournament performance” was applied to appraise the tournament statistics of professional tennis players by using several famous methods, including statistical methods, data envelopment analysis (DEA) and 2-tuple fuzzy linguistic computing model [20-24]. However, the results of extant literature have given rise to numerous issues that require further investigation. First, because the skills of tennis players improve or deteriorate over time, assessing changes in intertemporal tournament performance is essential when conducting comprehensive efficiency evaluations of the tournament performance of tennis players. According to Färe, Grosskopf, Norrisand Zhang [25], the following three efficiency measures for tennis players can be assessed based on changes in their intertemporal tournament performance: (1) shift in technology (SIT), (2)catching-up in efficiency (CIE)following the player’s technical (shift) improvement, and (3) the Malmquist productivity index (MPI) of intertemporal tournaments. Unfortunately, investigations related to changes in the intertemporal tournament performance of tennis players are lacking. In addition, to improve the tournament performance of tennis players, current extant literature only provides players with micro-perspective data references, for example, efficient or not and efficiency ranking. Few studies have been conducted that provide players with macro-perspective suggestions, for example, strategic information and determinants of winning. Thus, this is another issue requiring further research. Using the strategic management experiences of business enterprises, such as a usage of strategic management maps [26], we can develop and enhance the provision of efficiency strategies and assist tennis players in more rapidly identifying solutions for improving their tournament performance. Under this context, we endeavored to enhance the fundamental research of tournament performance improvements for tennis players by analyzing the two highlighted issues in the hopes of contributing academically to the field of tennis and providing tennis coaches and players with an alternative perception.It is well-known the ATP official webpage provides integral statistics regarding the tournament performance of players. Therefore, according to the previously mentioned research background and motivations, we investigated the single-year and intertemporal tournament performance of ATP players respectively using the DEA approach and the MPI. Subsequently, we used the obtained results to formulate micro- and macro- improvement strategies to enhance the efficiency of tournament performance of ATP players.
2. Literature Review
- As far as we know, the studies regarding the tournament performance improvement of tennis player were quite rare. By using the data of Wimbledon Open, Klaassen and Magnus [27] developed a model that explores both the questions of whether top tennis players in a top tournament employed an optimal (efficient) service strategy and whether economic agents were successful optimizers. They found that the answers are not positive. Tsai [20] used the DEA and super-efficiency models to evaluate efficiency of the 2007-season tournament performance of 50 ATP players by adopting one input and eight output measures as evaluation indices. The author conducted a series of analyses and discussions regarding the ATP players’ evaluation results, including efficiency score, returns of scale, peer reference, efficiency categorization and grade, slack analysis, sensitivity analysis. In addition, many suggestions were also proposed for future improvement. In Tsai & Chao [21], the authors evaluated the efficiency of tournament performance of professional players of the Women's Tennis Association (WTA) by using the basic DEA models and six input and output evaluation measures. Of 50 WTA players, 4 players were evaluated to be overall efficient, 11 players to be technical efficient and 5 players to be scale efficient. “Indoor game set win ratio” and “three set game win ratio” were the two measures that mostly affect the performance of WTA players. In addition, Ruiz, Pastor and Pastor [23] assessed the performance of ATP professional tennis players using DEA. In their work, the DEA benchmarking analysis allowed identifying strengths and weaknesses of the game of the players and ranking the players with help of cross-efficiency evaluation.On the other hand, using logistic model and longitudinal data between 1991 and 2008, Ma et al. [24] examined factors that lead to winning matches in men’s singles Grand Slam tennis. 16 variables were classified into three categories, player skills and performance, player characteristics and match characteristics, to predict match outcome. In summary, they recommended “more training in returning skills; to avoid overestimation of the positive impact of stature, left hand and professional experience; and a male player begins his professional tennis career by participating in the US Open or Wimbledon.”Being different from adopting the objective methods in the aforementioned studies, Tsai [22] attempted investigating the tournament performances of ATP players by using a subjective evaluation method. In her work, nine evaluation measures, experts’ assessment and2-tuple fuzzy linguistic computing constitute the evaluation model required. The two evaluation measures, “1stserve”and “2nd serve points won,” were assessed as the key ones significantly affect the performance of ATP players. Of the 11 players evaluated, Nadal had the best performance, while Lu had the worst.In summary, the extant literature missed two main tasks, i.e., efficiency enhancement proposal and analysis of intertemporal tournament performance of players. Based on the consideration that more application studies and experiences regarding the efficiency enhancement in the tennis field have to be continuously accumulated, this study would try to complete these two tasks.
3. Methods
3.1. Research Participants
- Based on the research in Tsai [20], we selected 45 ATP players as the study participants. The complete scores and statistical data of these 45 ATP players were collected from the official ATP Webpage. We collected data from 2 years, specifically 2007 and 2010. The main idea was to examine the performance changes of tennis players in a three-year period.
3.2. The DEA Approach
- The DEA analysis of relative efficiency provides very useful information regarding the strengths and weaknesses of each player, which may help them to improve their tournament performance toward the efficient level. The DEA approach is widely employed and has the following significant characteristics [9, 28]: (1) can simultaneously process multiple inputs and outputs, facilitating the use of various measurement units; (2) produces efficiency frontiers and comprehensive indices instead of mean values, and can evaluate efficiencies under varying environments; (3) the produced efficiency measures are relative efficiency indices; these indices show the subject’s resource usage conditions and can be provided as a reference for strategy formulators; (4) the weighted inputs and outputs are produced through linear programming and are not affected by subjective factors, thus, conform to fairness principles for each players evaluated; (5) quantitative and qualitative factors can be simultaneously processed; and (6) data regarding an insufficient input or excessive output of relative inefficient measures can be provided. The two DEA-based models used in this study are as follows [28-29]:
3.2.1. The Charnes, Cooper, and Rhodes (CCR) Model
- The DEA-based CCR model is a model that assumes constant returns to scale (CRS) and is used to calculate technical efficiency (TE) measures. Farrell [30] defines the CCR model as a model that can maintain existing production combinations when all inputs are reduced to the lowest ratio combination. That is, when TE is 1 and all other slack variables are 0, the player evaluatedis considered technically efficient; conversely, when TE is less than 1, the player evaluatedis considered technically inefficient and a portion of the input resources is wasted.
3.2.2. The Banker, Charnes, and Cooper (BCC) Model
- The DEA-based BCC model is a model that assumes the variable returns to scale (VRS). That is, it loosens the CRS constraints assumed for the CCR model, changing these assumptions to VRS and subsequently facilitating the measurement of pure technical efficiency (PTE).
3.3. The Malmquist Productivity Index (MPI) Method
- The DEA approach can only compare the efficiencies of a single year or period, and cannot longitudinally analyze efficiencies across several consecutive years. Using the extended MPI method, we can further measure the changes in overall efficiency in various periods. The MPI method was proposed by Caves, Christensen and Diewert [31]. Subsequently, Färe et al. [25] extended the MPI method by employing a geometric means model as a supplement, and established a DEA-based model that could measure intertemporal efficiencies. Färe et al. [25] further decomposed MPI into numerous source variations. In this study, we adopted the efficiency variation model developed by Färeand Grosskopf [32] to analyze intertemporal efficiency variations. Efficiency variations are comparisons of changes in the production possibility sets for various periods. According to the example of measuring MPI shown in Figure 1, when the production frontier
 of period t shifts toward period t+1 and results in production frontier
  , the MPI would be the variations that lead to the relative performance evaluation results. The relevant definitions are as follows:
 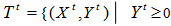 where
where  represents the production possibility sets (with production variables X and Y) in period t. Under the technical conditions of CRS, the production possibility sets
  can be presented as follows:
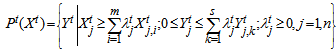 which is the technical variation measurement of a subject (i.e., Point A); n is the number of the players evaluated; m and s are respectively the numbers of inputs and outputs; λ is the intensity vector. Initially, the production distance functions for period t and period t+1 were defined as follows [33]:
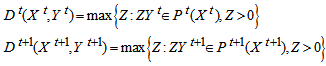
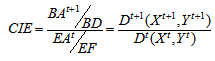
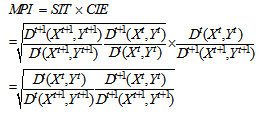
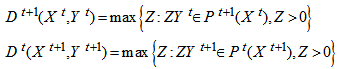 where Z is a lower bound parameter.According to the study by Färeand Grosskopf [32], MPI is the product of a shift in technology (SIT) and catching-up in efficiency (CIE). Eqns (1-3) respectively define SIT, CIE, and MPI (See Figure 1);1.SIT is represented by the geometric means of EG/EF and BD/BC, and is defined in eqn (1). SIT>1 represents technical advancement, SIT<1 represents technical deterioration, and SIT=1 represents invariance. In short, SIT>1 means that the tennis player achieved a technology breakthrough.
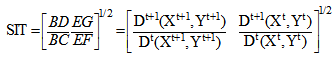 | (1) |
 | (2) |
 | (3) |
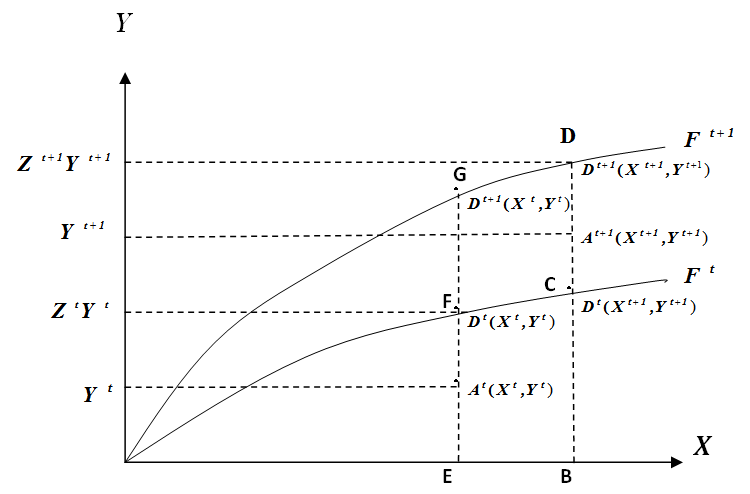 | Figure 1. An example of measuring MPI [32] |
3.4. The Strategic Management Map (SMM)
- Referencing the importance- performance analysis (IPA) framework proposed by Martillaand James [34], this study adopted the matrix concepts to formulate an analytical framework with two dimensions. In view of their respective unique significance, the SIT was taken as one dimension (vertical axis), while the CIEtaken as the other dimension (horizontal axis) (see Figure 2). According to the performance of these two intertemporal efficiencies, tennis players can be categorized into the four relevant quadrants to forma matrix for strategic management. From the results of this matrix, we can determine the strengths and weaknesses of a tennis player’s intertemporal efficiencies, and veritably provide improvement suggestions at a macro-level.
3.5. The Input and output Evaluation Indices
- Because different evaluation indices produce varying evaluation results, follow-up analyses, suggestions, and feedback, index selection must be a core focus, and the selected indices should reflect current issues. In addition, based on experiences of implementing efficiency evaluations in business enterprises, the principle that “The evaluation is according to the records” has been established. Therefore, regarding management content, the screening of indices was based on existing record systems [10]. The evaluation indices used in this study were primarily screened from the ATP Webpage. In a previous study, Tsai [20] adopted a rigorous screening process to obtain one input and eight output indices (game performance), which comprised the following:1. Input index: the number of ATP tournaments played (Tourn Played)2. Output indices: ATP points (Points), 1st Serve, 1st Serve Points Won, 2nd Serve Points Won, Break Points Saved, 1st Serve Return Points Won, 2nd Serve Return Points Won, and Break Points Converted.In the work of Tsai [20], these evaluation indices were established based on the recorded statistics of tennis players on the ATP official Webpage, and by the consideration of other published literature, the content validity was also established. In addition, correlation analysis was conducted to determine indices independence, where indices such as Aces, Double Faults, Break Points Faced, Service Games Played, Service Games Won, Service Points Won, Break Points Opportunities, Return Games Played, Return Games Won, Return Points Won, Total Points Won, Forced Errors, and Unforced Errors were disregarded because of excessively high levels of correlation. A significant correlation was not observed between the remaining nine indices. In fact, all the nine evaluation indices have been used in the work of Ma et al. [24].
3.6. The Methods and Designs for Efficiency Evaluation
3.6.1. Single-year Efficiency Evaluation
- To stimulate the tournament performance of ATP players, this study adopted output-oriented CCR and BCC models to evaluate the 2010 tournament performance data. The evaluation results included the following three static efficiency measures:1. TE: Obtained through the CCR model under the assumption of CCR.2. PTE: Obtained through the BCC model under the assumption of VCR.3. Scale efficiency (SE): Scale-efficient (SE=1) exists when the input and output data vary proportionally. Conversely, scale-efficient (SE<1) does not exist when variations are unproportional. Defined by Atkison [35], TE comprises PTE and SE. Thus, SE can be obtained by calculating TE over PTE.
3.6.2. Variation Analysis for Intertemporal Tournament Performance
- To focus the analysis, this study only shows variations in the intertemporal tournament data in2007 and2010. The MPI, CIE, and SIT measures (hereafter referred to as the three intertemporal efficiency measures) were calculated using eqns (1-3).
3.7. Data Analysis
- Originating from a management content perspective, we employed the following 4-level data analysis method:1. Single-year tournament performance analysis: Discussing and analyzing the three static efficiency measures obtained through the CCR and BCC models.2. Intertemporal tournament performance variation analysis: Discussing and analyzing the intertemporal tournament performance variation data calculated using eqns (1-3).3. Plotting the SMM: Because this study aimed to elucidate the intertemporal performance variations of ATP players, of the three intertemporal efficiency measures, MPI was the synergistic measure between the other two measures. Thus, we regarded the SIT and CIE of the ATP players as the vertical and horizontal axes, respectively. Consequently, according to the performance results for these two measures, we plotted the ATP players in their relevant quadrants to facilitate further strategy management proposals.4. Hierarchical and customized improvement proposals: From the results obtained in the third-level analysis, we formulated and proposed macro-level (comprehensive) improvement strategies based on the results obtained from the SMM. Furthermore, we provided micro-level (individual) improvement suggestions to the comparatively weaker ATP players based on the results obtained from the DEA model. All the proposals of tournament performance improvement were conducted by originating from the perspective of efficiency enhancement.
4. Results and Discussion
4.1. Single-year Descriptive Statistics
- Tables 1(a) and 1(b) show the descriptive data for the nine evaluation indices of the 45 ATP players for 2007 and 2010, respectively. The statistical variables in the data comprise the minimum (Min), maximum (Max), mean, standard deviation (SD), and coefficients of variation (CV). Only the mean of the ATP points index in 2010 (2011.9 points) and 2007 (1435.6 points) differed significantly (repeated-samples t = 2.32, p = .031), achieving a growth rate of over 40%. The remaining eight performance indices showed no significant differences.
4.2. The Static Efficiency Measures and Intertemporal Efficiency Measures
- Table 2 shows the results of the three static efficiency measures for 2010 and the comparative results of the three intertemporal efficiency measures for 2007 and 2010 of the 45 ATP players.
| |||||||||||||||||||||||||||||||||||||||||||||||||||||||||||||||||||||||||||||||||||||||||||||||||||||||||||||||||||||||||||||||||||||||||||||||||||||||||||||||||||||||||||||||||||||||||||||||||||||||||||||||||||||||||||||||||||||||||||||||||||||||||||||||||||||||||||||||||||||||||||||||||||||||||||||||||||||||||||||||||||||||||||||||||||||||||||||||||||||||||||||||||||||||||||||||||||||||||||||||||||
4.2.1. The Three Static Efficiency Measures for 2010
4.2.1.1. TE
- Table 2 shows that only Nadal and Moya were technically efficient, and the efficiency frontiers are determined by these two players. The mean value for the 45 ATP players was .5130, the standard deviation was .1662, and the coefficient of variance was .3240, which implies that the TE performance of the players varied considerably.
4.2.1.2. PTE
- Table 2 shows that 18 ATP players were efficient in PTE performance. The 45 ATP players exhibited a mean value of .9695, extremely close to 1. To a certain extent, this data set reflects the skill level of professional tennis players. In addition, the standard deviation was .0343, and the coefficient of variance was .0354. This shows an extremely small difference in PTE performance.
4.2.1.3. SE
- Table 2 shows that only Nadal and Moya were scale-efficient. The mean value for the 45 ATP players was .5268, the standard deviation was .1598, and the coefficient of variance was .3033, which implies that the SE performance of the players varied considerably.In summary, the PTE performance of the 45 ATP players in 2010 was more consistent and closer to efficiency. According to the definitions proposed by Atkison [35], PTE represents the skill-level performance efficiency of the players. Therefore, because the 45 ATP players were top professional, consistency between their PTE values was a typical result. Subsequently, SE and TE showed inverted performance trends, that is, inefficient players accounted for the majority, and efficiency measures were low and differed substantially. Based on these results, we could determine that the inefficiency of ATP players primarily resulted from low or no scale-efficient, which explores the phenomenon all the 43 ATP players (excluding Nadal and Moya) had an asymmetric performance between their game inputs and outputs. More specifically, all the 43 ATP players participated in many ATP tournaments (input index) but their game performances (output indices) were unable to match the upgrade. Accordingly, reducing the number of tournaments played may be the simplest method than the upgrade in performance. Furthermore, Nadal and Moya possessed perfect performance on the three static efficiency performance measures and, accordingly, were the most outstanding players in 2010. It especially deserves to be mentioned that Moya was not a top ATP player and was ranked only 507 in 2010. He achieved the efficient status of the competitions by means of the least number of tournaments played (8 tournaments). Therefore, it was found that each player has a different way to achieve the efficiency of tournament performance, which will depend obviously on his own characteristics or need.
4.2.2. The Three Intertemporal Efficiency Measures
4.2.2.1. SIT
- Overall, the mean value was 1.0614, the standard deviation was .3218, and the coefficient of variance was .3032. These values indicated that significant performance differences existed for the SIT of ATP players. Table 2 shows that 39 ATP players achieved technical advancement, with SIT measures greater than 1. Of these 39 players, Nalbandian scored 2.9858 for an improvement magnitude of 198.6%, followed by Federer, who scored 1.4765 for a magnitude of 47.7%, and Stepanek, who scored 1.1374 and achieved a magnitude of 13.7%. Conversely, six ATP players presented technical deterioration, with SIT measures of less than 1. Of these six players, Moya scored .3189 for a deterioration magnitude of 68.1%, followed by Roddick, who scored .8249 for a magnitude of 17.5%.
4.2.2.2. CIE
- Overall, the mean value was 1.1744, the standard deviation was 1.3977, and the coefficient of variance was 1.1901. These results indicated that significant performance differences existed among the CIE of ATP players. Table 2 shows that 19 ATP players achieved CIE measures greater than 1. Of these 19 players, Moya scored 10.2550, for an efficiency enhancement magnitude of 925.5%, followed by Roddick, who scored 1.6623 for a magnitude of 66.2%. Conversely, 26 players scored CIE measures of less than 1. Of these 26 players, Nalbandian scored 0.116, for a deterioration magnitude of 88.8%, followed by Federer, who scored 0.4514 for a magnitude of 54.9%.
4.2.2.3. MPI
- MPI is the synergistic measure of SIT and CIE. Overall, the mean value was 1.0469, the standard deviation was .3647, and the coefficient of variance was .3484. These results indicated that the overall performance of the players differed significantly. Table 2 shows that 26 players achieved an MPI measure greater than 1. Of these 26 players, Moya scored 3.2710, for an overall performance improvement magnitude of 227.1%, followed by Roddick, who scored 1.3712 for a magnitude of 37.1%. Conversely, 19 players scored MPI measures of less than 1. Of these 19 players, Nalbandian scored .3333, for an overall deterioration magnitude of 66.7%, followed by Federer, who scored .6665 for a magnitude of 33.3%.In summary, the 45 players’ mean values of the three intertemporal efficiency measures for 2007 and 2010 were greater than 1, indicating an overall improving condition. However, the performance differences between the players were considerable due to the large values of three coefficients of variation. On the other hand, regarding individual ATP players, several ATP players exhibited performance extremities. For example, Moya showed the best performance in CIE and MPI, and achieved efficient levels in all three static efficiency measures in 2010. However, he scored the worst for SIT; whereas Nalbandian exhibited the opposite performance condition to Moya. If we were to disregard Nalbandian and Moya, and recalculate the three intertemporal efficiency measures, we would find that the significant differences among the players resulted from the extreme performance measures of these two players. In addition, Roddick and Federer have critical yet similar performance deterioration conditions, which confirmed the present situations that Roddick has retired and Federer has lost the championshipaura. Nadal presents the best and most stable performance.
4.3. The Strategic Management Map
- Figure 2 shows the distributive results of the SMM for the 45 ATP players, where CIE=1 and SIT=1 were used as the horizontal and vertical dividing boundaries. These boundaries divided the SMM into four quadrants. The characteristics of the four quadrants and the number of ATP players distributed among these quadrants are explained below.1.Quadrant I:Technical advancement and improved CIE; the intertemporal tournament performance of 13 ATP players was plotted in this quadrant.2.Quadrant II:Technical advancement but deteriorating CIE; the intertemporal tournament performance of 26 ATP players was plotted in this quadrant.3.Quadrant III:Technical and CIE deterioration; no ATP players were plotted in this quadrant.4.Quadrant IV:Technical deterioration but improving CIE; the intertemporal tournament performance of 6 ATP players was plotted in this quadrant.
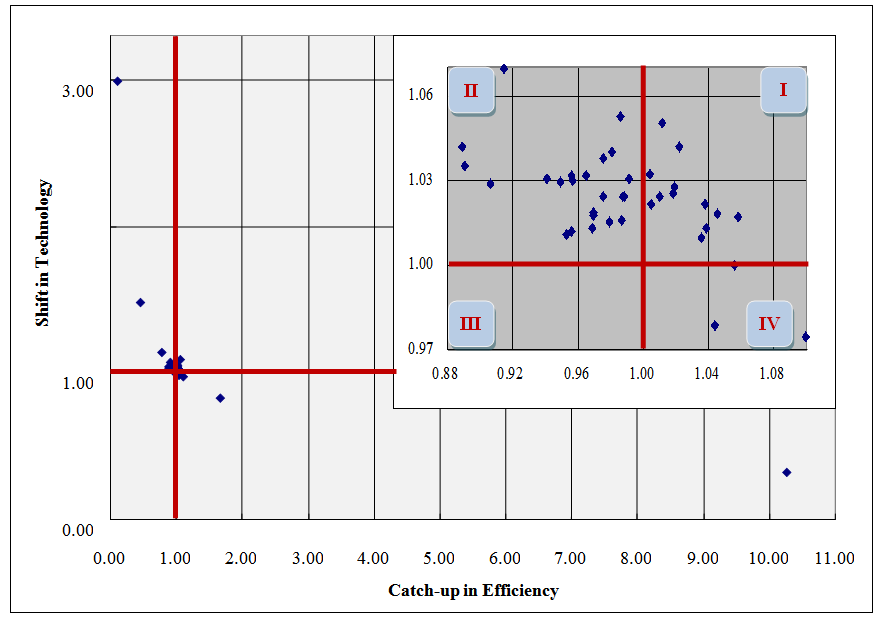 | Figure 2. Distributive results of the strategic management map for the 45 ATP players |
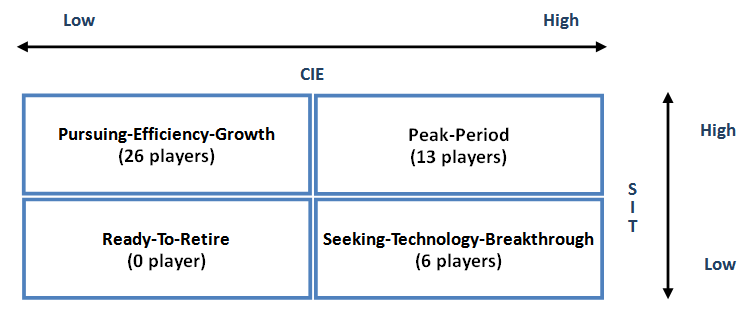 | Figure 3. The strategic management map for the 45 ATP players |
4.4. Hierarchical and Customized Improvement Proposals
4.4.1. Macro-level Improvement Strategy Proposals
- Considering the 45 ATP players plotted in the three quadrants, we adopted strategic management concepts and proposed the following improvement strategies:1.For ATP players in the “Peak-Period” quadrant: We suggest adopting typical conservative strategies (paradigm protection)and continuing each player’s current training program and game style to maintain optimal conditions. The SIT and CIE performance of ATP players in this quadrant improved only slightly (0%-9%), specifically Simon, Benneteau, Monfils, Kohlschreiber, Serra, and Korolev. These six players showed no efficiency for the three static efficiency measures for 2010 and backward ATP rankings from 2007 to 2010. Thus, the players in this quadrant should aim to surpass their personal best to improve performance.2. For ATP players in the “Pursuing-Efficiency-Growth” quadrant: We suggest adopting CIE improvement strategies, specifically Nalbandian, Federer, and Stepanek. These three players exhibited relatively low MPI performances and should adjust their individual competition conditions. The possible plans for this quadrant are explained in the following chapter.3.For ATP players in the “Seeking-Technology- Breakthrough” quadrant: According to previous tournament performance results and ATP rankings for the players in this quadrant, we found that most were former celebrities. Thus, we suggest adopting a strategy where these players can frequently compete and obtain more revenue, particularly Roddick, who was ranked tenth in the ATP rankings in 2010, which demonstrates his competitiveness. Partially adopting improvement strategies may also benefit these players’ “comebacks.”
4.4.2. Micro-level Input-output Performance Improvement Suggestions
- This study proposed micro-level input-output performance improvement suggestions to further and more comprehensively provide improvement plans for inefficient ATP players. This process involvedemploying 2010 data obtained from the CCR model using the DEA approach. The research participants were three inefficient ATP players plotted in the various quadrants explained in the previous chapter, specifically Serra (lowest TE) in the “Peak-Period” quadrant, Nalbandian (lowest MPI) in the “Pursuing-Efficiency-Growth” quadrant and Haas from the “Seeking-Technology-Breakthrough” quadrant.
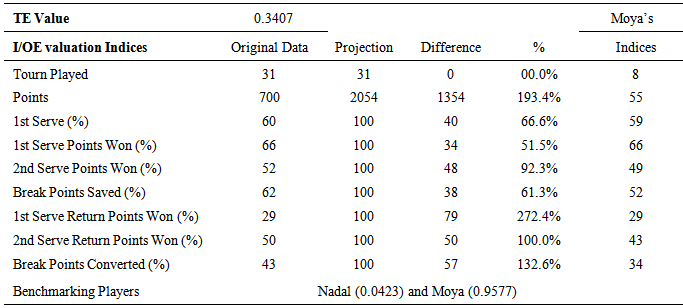
4.4.2.1. Serra
- Serra was considered a “Peak-Period” player, but had the lowest TE (.3407). Table 3 shows the input-output performance improvement suggestions for himto enhance his efficiency (TE = 1.0000). From Table 3, besides the target ATP point (2054 points), which can be obtained by winning good scores in matches, the remaining target output values are not easy to obtain (target value = 100). As shown in Table 3, Serra should break through the technology of return of serve. To be specific, although the three output indices, 1st Serve Return Points Won, 2nd Serve Return Points Won and Break Points Converted, belong to moderate performance, Serra should actively seek a technology breakthrough for improve the performance in the three indices.
|
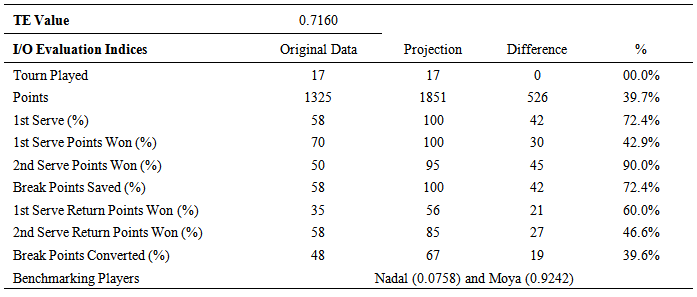
4.4.2.2. Nalbandian
- Nalbandian was considered a“Pursuing-Efficiency-Growth” player. Table 4 shows the input-output performance improvement suggestions for Nalbandian (TE=.7160) to enhance his efficiency (TE = 1.0000). Excluding the targets of four service game-related indices (a target value close or equivalent to 100), the targets for the remaining three return game-related indices are obtainable. Crucially, as shown in Table 4, Nalbandian should enhance his serve technologies or battle strategies to improve his CIE conditions. More specifically, he should mainly improve the performance on the four output indices, including 1st Serve, 1st Serve Points Won, 2nd Serve Points Won and Break Points Saved. In addition, the DEA model suggested that Moya could be the most suitable learning object for him.
|
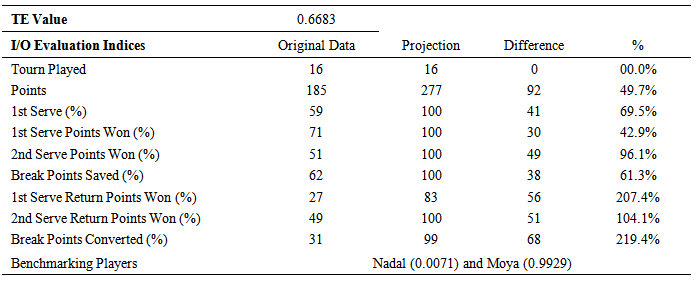
4.4.2.3. Haas
- Haas was considered a“Seeking-Technology-Breakthrough” player. His three static efficiency measures were TE=.6683, PTE=1.0000, and SE=.6683, while his three intertemporal efficiency measures were MPI=1.0217, CIE=1.0439, and SIT=.9787.Table 5 shows the input-output performance improvement suggestions for him to enhance his efficiency (TE = 1.0000). Basically, Haas had mediocre performance on the four service game-related indices, 1st Serve, 1st Serve Points Won, 2nd Serve Points Won and Break Points Saved, while had very bad performance on the three return game-related indices, 1st Serve Return Points Won, 2nd Serve Return Points Won and Break Points Converted. Specifically, besides the target ATP point (277 points), which can be obtained through effort, the remaining target output values are not easy to achieve (a target value close or equivalent to 100). In sum, for efficient tournament performances, Haas must consider how to improve his overall technology. In the process of enhancing efficiency, the DEA model suggested that Moya could be the most suitable learning object for him.
|
4.5. The Transformation of Management and Training
- The inference concept of DEA approaches adopts mathematical linear programming and is part of management science. Specifically, the series of data analyses conducted in this study originate from a management science perspective. Therefore, the results obtained from these analyses must be transformed into a training perspective for actual implementation; for example, the suggestions formulated for Nalbandian regarding increasing his output indices, and those formulated for Serra and Haas regarding improving their technology of return of serve (the same recommendation was also proposed for ATP players by MA et al. [24]). The methods for transforming these suggestions into actual training activities to improve tournament performance depend on the knowledge and experience of the ATP players and their coaches. According to previous experiences, viable options include benchmarking learning, applying sports science and computer-aided technology, or coach replacement.
5. Conclusions
- Based on the outcomes of the above, this study conducted a distinctive proposal for ATP players to improve their tournament performance from the perspective of efficiency enhancement. The proposal had the characteristics of hierarchy (including macro-level and micro-level), customization (for each inefficient ATP player) and benchmarking learning. In the static efficiency analysis, reducing the number of tournaments will be the most simple and effective method for many of inefficient ATP players towards enhancing their efficiency of tournament performance. In the process of proposing micro-level input-output performance improvement suggestions, many of the target values for inefficient players regarding output evaluation indices are close or equivalent to 100or the degree of effort exceeds 100%. For this group of inefficient players, the condition of their games indispensably needs a comprehensive exploration, which could include technology breakthrough and efficiency catching-up. On the other hand, this study also found that Moya was a unique ATP player by means of his own way to achieve the efficiency of performance and was a suitable learning object.The suggestion of reducing the number of tournaments played would bother part of the coaches and players. However, this study emphasized that the perspective of efficiency enhancement provides an alternative opportunity for the coaches and players to carefully consider how to improve their tournament performance. On the other hand, as a benchmarking analysis model, the DEA approach was in a special position that the analysis results obtained in this study were expected giving reference values only for the ATP players in this study. Therefore, when using the DEA approach, the target player and his major competitors should together be included into assessment. In the future, tournament data for the 45ATP players after 2010 should be continuously recorded to investigate and verify the long-term tournament results of these players. Furthermore, similar intertemporal performance investigations can be conducted on female players of the Women’s Tennis Association.
Note
- 1. The first number in the parentheses denotes the player’s ATP rank for 2007; the second number denotes their ATP rank for 2010.
References
| [1] | Collinson, L. and Hughes, M., 2000, Surface effect on the strategy of elite female tennis players, Conference Communications, 266-267. |
| [2] | Rees, T. and Hardy, L., 2004, Matching social support with stressors: Effects on factors underlying performance in tennis, Journal of Sport and Exercise Psychology, 5, 319-337. |
| [3] | Hornery, D. J., Farrow, D., Mujika, I. and Young, W., 2007, Anintegrated physiological and performance profile of professionaltennis, British Journal of Sports Medicine, 41, 531-536. |
| [4] | Reid, M., Crespo, M., Lay, B. and Bery, J., 2007, Skill acquisitionin tennis: Research and current practice, Journal of Science and Medicine in Sport, 10, 1-10. |
| [5] | O’ Donoghue, P. G. and Brown, E., 2008, The importance of service in Grand Slam singles tennis, International Journal of Performance Analysis in Sport, 8, 70-78. |
| [6] | Chiu, F. C., 2010, Comparative analysis on the skill characteristics of men’s singles matches in 2008 Grand Slam tournaments, Sports and Exercise Research, 12, 83-95. |
| [7] | González-Díaz, J., Gossner, O. and Rogers, B. W., 2012, Performing best when it matters most: Evidence from professional tennis, Journal of Economic Behavior & Organization, 84 (3), 767-781. |
| [8] | Pun, K. F., 2002, Development of an integrated total quality management and performance measurement system for self-assessment: A method, Total Quality Management, 13(6), 759-777. |
| [9] | Yeh, D.-Y., 2007, Monitoring performance of Taiwan coffee chain stores using a multidimensional performance management system, Asia Pacific Management Review, 12(2), 101-111. |
| [10] | Neely, A., Ed., Measuring business performance- Why, what and how, London: The Economist Books, 1998. |
| [11] | Neely, A., Mills, J., Platts, K., Richards, H., Gregory, M., Bourne, M. and Kennerley, M., 2000, Performance measurement system design: Developing and testing a process-based approach, International Journal of Operations and Production Management, 20(10), 1119-1145. |
| [12] | Lewis, P. S., Goodman, S. H. and Fandt, P. M., Ed., Management challenges in the 21st century, Ohio: South-Western College Publishing, 2001. |
| [13] | Bhagwat, R. and Sharma, M. K.,2007, Performance measurement of supply chain management: A balanced scorecard approach, Computers & Industrial Engineering, 53(1), 43-62. |
| [14] | Lozano, S., Villa, G., Guerrero, F. and Cortés, P., 2002, Measuring the performance of nations at summer Olympics using data envelopment analysis, Journal of Operational Research Society, 53(5), 501-511. |
| [15] | Sexton, T. R. and Lewis, H. F., 2003, Two stage DEA: An application to major league baseball, Journal of Productivity Analysis, 19, 227-249. |
| [16] | Cooper, W. W., Ramon, N., Ruiz, J. L. and Sirvent, I., 2011, Avoidinglarge differences in weights in cross-efficiency evaluations: Application to the ranking of basketball players, Journal of CENTRUM Cathedra, 4(2), 197-215. |
| [17] | Fried, H. O., Lambrinos, J. and Tyner, J.,2004, Evaluating the performance of professional golfers on the PGA, LPGA and SPGA tours, European Journal of Operational Research, 154, 548-561. |
| [18] | Hsu, M.-L. and Kuo, K.-P., 2014, A study of the performance and the determinants of winning for professional female golfers, International Journal of Trends in Economics Management and Technology, 3(1), 1-12. |
| [19] | Banker, R. D., Charnes, A. and Cooper, W. W., 1984, Some models for estimating technical and scale inefficiencies in data envelopment analysis, Management Science, 30(9): 1078-1092. |
| [20] | Tsai, C.-H., Ed., Evaluating the performances of ATP players, Taipei, Taiwan: Wunan, 2007 (in Chinese). |
| [21] | Tsai, C.-H. and Chao, F.-M.,2009, Performance evaluation for WTA players-An application of DEA, Journal of Physical Education in Higher Education,11(1), 29-41 (in Chinese). |
| [22] | Tsai, C.-H.,2012, Using a 2-tuple FLC model to evaluate the performance of ATP players, NTU Journal of Physical Education, 23, 1-11 (in Chinese). |
| [23] | Ruiz, J. L., Pastor, D. and Pastor, J. T.,2013, Assessing professional tennis players using data envelopment analysis (DEA), Journal of Sports Economics,14(3), 276-302. |
| [24] | Ma, S.-M., Liu, C.-C., Tan, Y. and Ma, S.-C., 2013, Winning matches in Grand Slam men’s singles: An analysis of player performance-Related variables from 1991 to 2008, Journal of Sports Sciences, 31(11), 1147-1155. |
| [25] | Färe, R., Grosskopf, S., Norris, M. and Zhang, Z., 1994, Productivity growth, technical progress, and efficiency changes in industrialized countries, American Economic Review, 84, 66-83. |
| [26] | Chakravarthy, B. S., 1986, Measuring strategic performance, Strategic Management Journal, 7, 437-458. |
| [27] | Klaassen, F. J. G. M. and Magnus, J. R.,2 009, The efficiency of top agents: An analysis through service strategy in tennis, Journal of Econometrics, 148, 72-85. |
| [28] | Cooper, W. W., Seiford, L. M. and Tone, K., Ed., Data envelopment analysis: Acomprehensive text with models, Applications, References and DEA-Solver Software, Boston: Kluwer Academic publishers, 1999. |
| [29] | Charnes, A., Cooper, W., Lewin, A. Y. and Seiford, L. M., Ed., Data envelopment analysis: theory, methodology and applications, Boston: Kluwer Academic Publishers, 1994. |
| [30] | Farrell, M. J.,1957, The Measurement of productive efficiency, Journal of the Royal Statistical Society- Series A, General 120, 253-281. |
| [31] | Caves, D. W., Christensen, L. R. and Diewert, W. E.,1982, The economic theory of index numbers and the measurement of input, output, and productivity, Econometrica, 50, 1393-1414. |
| [32] | Färe, R. and Grosskopf, S., 1992, Malmquist productivity indexes and fisher ideal indexes, The Economic Journal, 102, 158-160. |
| [33] | Shephard, R. W., Ed., Theory of cost and production functions, Princeton: Princeton University Press, 1970. |
| [34] | Martilla, J. A. and James, J. C., 1977, Importance- performance analysis, Journal of Marketing, 41 (1), 77-79. |
| [35] | Atkison, S. E., 2003, Measuring and decomposing productivity change: Stochastic distance function estimation versus data envelopment analysis, Journal of Bussiness & Economic Statistics, 21(2), 284-294. |