-
Paper Information
- Next Paper
- Paper Submission
-
Journal Information
- About This Journal
- Editorial Board
- Current Issue
- Archive
- Author Guidelines
- Contact Us
International Journal of Sports Science
p-ISSN: 2169-8759 e-ISSN: 2169-8791
2014; 4(3): 97-102
doi:10.5923/j.sports.20140403.04
Environmental and Socioeconomic Factors Associated with Nigerian University Students’ Participation in Physical Activity
 Abstract
 Reference
 Full-Text PDF
 Full-text HTML
Rufus A. Adedoyin1, Rukayat A. Ibrahim1, Taofeek O. Awotidebe1, Rita N. Ativie2, Adewale L. Oyeyemi3
1Department of Medical Rehabilitation, College of Health Sciences, Obafemi Awolowo University, Ile - Ife, Nigeria
2Department of Physiotherapy, University of Nigeria Teaching Hospital, Enugu, Nigeria
3Department of Physiotherapy, College of Medical Sciences, University of Maiduguri, Nigeria
Correspondence to: Rufus A. Adedoyin, Department of Medical Rehabilitation, College of Health Sciences, Obafemi Awolowo University, Ile - Ife, Nigeria.
| Email: |  |
Copyright © 2014 Scientific & Academic Publishing. All Rights Reserved.
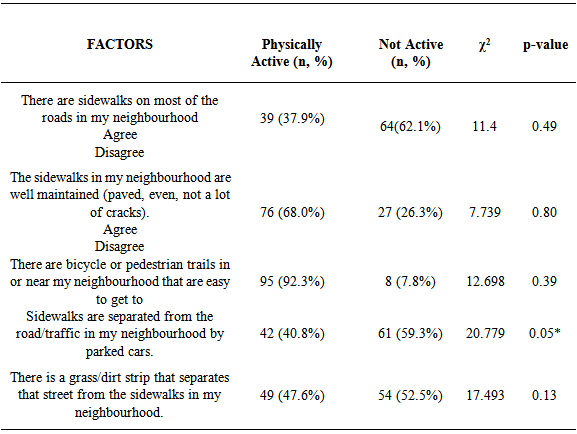
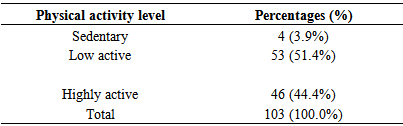
Background: This study assessed the physical activity level of university Students in relation to environmental and socioeconomic factors. Methods: One hundred and three undergraduate students of Obafemi Awolowo University, Ile-Ife, Nigeria participated in this study. Pedometer was used to measure physical activity level of the participants over a week period. Questionnaires were used to assess socioeconomic status and environmental correlates of active commuting. Results: The results showed that 29.1% of the participants were somewhat active, while 27.2% were highly active. Only 3.9% were sedentary. There were significant negative associations between physical activity level and socioeconomic status (r= -0.503, p< 0.001) and residential location (r= -0.207, p< 0.036). There were no significant association between physical activity level and environmental characteristics except for the variable that assessed presence of parked cars between sidewalks and the road traffic (χ2 = 20.779, p< 0.05). Conclusion: University students in Nigeria are somewhat and highly active. Socioeconomic status, residential location and barriers posed by parked cars between sidewalks and road traffic are important correlates of physical activity of Nigerian University students.
Keywords: Environmental, Socioeconomic factors, Nigerian university students, Physical activity
Cite this paper: Rufus A. Adedoyin, Rukayat A. Ibrahim, Taofeek O. Awotidebe, Rita N. Ativie, Adewale L. Oyeyemi, Environmental and Socioeconomic Factors Associated with Nigerian University Students’ Participation in Physical Activity, International Journal of Sports Science, Vol. 4 No. 3, 2014, pp. 97-102. doi: 10.5923/j.sports.20140403.04.
Article Outline
1. Introduction
- Physical inactivity is reported to be the fourth leading cause of death worldwide with most of these deaths in low and middle income countries [1-3]. Engaging in regular physical activities can prevent the risk of adverse health outcomes including diabetes, hypertension, hyperlipidemia, depression, asthma, adverse orthopedic conditions and fatty-liver disease [4-6]. International guidelines recommend that all healthy adults aged 18–65 years should engage in moderate intensity aerobic physical activities (PA) for a minimum of 30 minutes on five days each week, or in vigorous-intensity aerobic PA for a minimum of 20 minutes on three days a week [2]. Physical inactivity is becoming a major problem worldwide with prevalence declining sharply in developing countries [7, 8]. Evidence showed that advances in technology are making profound alterations in people's activity patterns including automobiles that have become the dominant form of transportation in most countries, severely reducing active modes of transportation [9]. Reports from multiple countries showed that the majority of American (60%) [1], Australian (43%) [3] and European (43–87%) [4] adults do not meet minimum activity level for health benefit. In Africa, prevalence of physical activity varied widely (46.8% to 96.0%) [7, 10] but the reason for this variation is not obvious. One strategy for understanding differences in populations’ physical activity behaviour is the use of ecological models of health behaviours that recognized multi-level influence on behaviour [11]. Ecological models posit that health behaviours including physical activity are influenced by the interaction of individual, sociocultural, built environment and policy dimensions [12]. Understanding built environment influence on physical activity is particularly important because physical activity is a behaviour that takes place in specific environment. In this context, research linking the built environment with physical activity has proliferated greatly in recent decades [13-17], and consistent findings that emerged that favourable designs of the built environment is associated with participating in sufficient health related physical activity behaviour [17-21]. Because intervention should be evidence based and country specific, there is need for country specific studies on the influence of the environment on physical active, especially in Africa where limited studies have been conducted [22, 23]. Because behaviours adopted while in the University may be important lifelong habits that may shape future health habits, it is important to understand environmental and socioeconomic correlates of physical activity in University students. Sisson and Tudor-Locke, [24] reported that commuting to university represents an opportunity to incorporate physical activity (walking or cycling) into students' daily routines. Students who have access to personal cars and motorbike are not likely to be stimulated for active commuting to campus [25].In Nigeria, parental socioeconomic status (SES) (income and occupation) was consistently found to be inversely associated with University students’ physical activity [26], environmental features of the University campus were inconsistently associated with physical activity and walking of the students [22]. In the previous studies of Nigerian University students, proxy socioeconomic status was used and only the campus environment with limited variations that increases the potential for constriction of full strength of physical activity-environment associations was explored [19]. Also, because a self-report measure of physical activity was used in the previous studies, there is potential for recall bias and overestimation of physical behaviours of the students [27, 28]. The purpose of the present study was to assess physical activity level of students of Obafemi Awolowo University, Nigeria using an objective measure (pedometer), and its relationships with environmental and socioeconomic factors. This study has potential to inform evidence base for physical activity promotion in Nigerian students and can contribute to the emerging evidence on environmental correlates of physical activity in Africa. Understanding environmental correlates of physical activity and other health behaviors in Africa has implications to inform international evidence-based and country-specific physical activity policies and interventions to help prevent obesity and other chronic diseases.
2. Method
2.1. Participants
- This study involved 106 undergraduate students of Obafemi Awolowo University, aged 17-28 years consisting of 54 students residing on campus and 52 students off campus. A purposive sampling technique was used to select participants for this study. Participants that live on campus were recruited from their hostels while those who live off campus were recruited from lecture theatres on campus.Ile-Ife is the traditional home of the Yoruba civilization. Yoruba tribe formed about 30 percent of Nigeria population. Ile-Ife, a city of about half a million, is situated at the geographical centre of the Yoruba city-states. To the west lies Ibadan, the largest city in sub-Saharan Africa and to the east lies Ondo, gateway to the eastern Yoruba city-states. Ile-Ife is about two hundred kilometres from Lagos, which was Nigeria’s coastal capital city for over a century.The Obafemi Awolowo University was established in 1962. It is one of the first generation Federal Government Universities with students’ population of over 35,000. The institution comprises the central campus, the student residential area, the staff quarters and a Teaching and Research Farm. The central campus comprises the academic, administrative units and service centers while the student residential area is made up of 10 undergraduate hostels and a postgraduate hall of residence. Many private hostels are situated outside the campus.Participants with musculoskeletal problems or other conditions which may prevent walking for long periods, or taking regular steps were excluded from the study. Pedometer was used to assess the physical activity level of the study participants by taking daily step counts. This study used the August multifunction pedometer (model: HPC907) to assess physical activity level of students. This pedometer has features such as step counter, distance display, time display and calorie counter.An adapted questionnaire from previous studies [25, 28] was used to obtain information on socio-demographics (e.g., age, sex and residence), active transport to university, socioeconomic status, and environmental attributes (perceived barrier). Also accessibility to public transport, access to cars, motorbike and bicycle were assessed with the adapted questionnaire. Participants’ residence was determined by a single item asking about residential address with response options of “on campus” or “off campus”. Active transport to university was assessed with a question on “what mode of transportation do you typically use on a usual day to go to and from the university (to attend lectures for those who are resident on campus)?.” Response options were “bicycle”, “bus”, “car”, “motorbike” or “walking”. Socio-economic status (SES) was measured by asking question: “In general, how do you define your socio-economic status?.” Response options were “low”, “below average”, “average”, “above average” or “high”. Access to car, motorbike and bicycle was assessed with questions “Do you have a car for personal use?”; “ Do you have a motorbike for personal use?’’ And “Do you have a motorbike for personal use?” respectively. Response options were never, sometimes or always. Access to public transport was measured with the question “How long does it take you to walk from your home to the nearest bus stop?” with participant responding in minutes. For assessing barriers to walking and cycling (environmental attributes), the 5 items from the “places for walking and cycling” subscale of the Neighbourhood Environment Walkability Scale (NEWS) [28].
2.2. Procedure
- August multifunction pedometer (model: HPC907) was used to record student’s step counts. The pedometer is worn level with the hip bone in line with the midpoint of the right knee, hence students were asked to attach the device to their belt or the top of the waist band and they were also instructed to position the device such that the display is upright. Students were instructed to wear the pedometers at all times, except when bathing and while sleeping, for seven consecutive days including weekdays and weekend days. The in-built memory function negates the need for students to press reset each day and manually record step counts at the end of the day. After seven days, the pedometers were collected and an average step counts per day was determined. A questionnaire was then administered to assess the socioeconomic status of the study participants, active transport to and from school. This questionnaire was also used to assess the various means of transportation accessible to the participants within and around the university, as well as barriers to it.Each participant’s step counts per day was deduced by calculating the average of the recorded step counts per day for the last seven days. As suggested by De Bourdeaudhuij et al, [29] physical activity was classified as sedentary (<5000 steps/day), low active (5000-7499 steps/day), somewhat active (7500-9999 steps/day), active (10000-12500 steps/day) and highly active (>12500 steps/day). Socioeconomic status was rated (1-2) low, (3) middle, (4-5) high.
2.3. Data Analysis
- Descriptive and inferential statistics were used to analyse the data. Pearson’s product moment correlation coefficient was used to determine relationship between socioeconomic status and physical activity level. Chi-square analysis was used to find association between perceived barrier items and physical activity level. T-test was used to compare physical activity level of students living on campus and those living off campus.
3. Results
- A total of 106 students of Obafemi Awolowo University, Ile- Ife, took part in this study. Three (2.83%) students did not wear the pedometer for up to seven days, leaving only 103 (97.17%) students with valid data. The mean age of the students was 22.74 ± 2.69 years, and 50 (48.5%) and 53 (51.5%) were male and female respectively. Fifty-three (51.5%) of the students reside on campus while 50 (48.5%) reside off campus. Majority of the participants were of middle socioeconomic status (53.4%), while 22.3% and 24.3% were of low and high socioeconomic status respectively (Table 1).
|
|
|
|

|

4. Discussion
- The objective of this study was to determine the association of socioeconomic and environmental faction with Physical activity level among the students of Obafemi Awolowo University. The results showed a significant negative correlation between physical activity level and their self-perceived socioeconomic status. Undergraduate students who are of low socioeconomic status were more physical active than those of the high socioeconomic status. This finding may be a reflection of the fact that students of low socioeconomic status group compared to high socioeconomic group have limited access to personal cars, bicycle, motorbike and commercial means of transportation due to affordability and financial constraint. Plausibly, they engage in more active transport than students of the high socioeconomic status group, who can afford personal cars and public transport. It has been documented that adolescents from low socioeconomic status group were more likely to walk or cycle for transport than those from high socioeconomic status [30]. Salmon et al, [31] also found that adolescent attending schools in low socioeconomic areas were more likely to walk to school than those in high socioeconomic areas.We found no significant difference in the physical activity levels of male and female. Contrarily, Caspersen et al, [32] reported male adolescents and adults to be more physically active than their female counterparts. Generally, prevalence of physical activity is considered to be reported to be higher in male than female [7, 33-37]. Similarly, male Nigerian students have been previously reported to be more physically active than female students 26. Perhaps, academic functions, routines and physical activity of male and female students in the present study were remarkably similar, hence the reason for the discrepant finding to previous studies. There was significant difference in the physical activity levels of undergraduate students residing on campus and those residing off campus, with those that reside on campus more physically active than those that reside off campus. Students on campus may commute more actively than those that reside off campus because environmental characteristics on campus appear more favourable for physical activity participation. Also, accessibility of facilities and proximity of destinations (e.g., lecture theatres, shopping centres and hall of residence eateries) could increase active transportation (walking) between destinations and decrease passive mode of commuting (e.g., cars and motor bike) among students that on campus compare to those off campus. Positive relationship between accessibility of destination and physical activity has consistently been documented in previous studies [13-16, 28]. The university authority may encourage building of hostels within the campus premises to encourage physical activity participation.Environmental characteristics such as availability of well-maintained sidewalks, availability of bicycle and pedestrian trails, and presence of grass/dirt strips on the street that were expected to be significantly associated with physical activity participation of students were not, It could be assumed that present study provided less supports for environmental correlates of physical activity than many other studies, as indicated by reviews [13-17]. Molina-Garcia et al [25] documented walking and cycling facilities are significant correlates of active commuting among University students in developed countries. There are some potential explanations for the discrepant findings in the present study. Perhaps, there are cultural differences between Nigerians and residents of other continents that lead to different perceptions of neighbourhood environments. It is difficult to examine cultural differences in perceptions, but this could be an important research direction that could help explain inconsistencies in findings across countries. Because perception of sidewalks being separated from the road/traffic in the students’ neighbourhood by parked cars was significantly associated with physical activity level in this study, urgent intervention for construction of car parks is highly necessary.The result of this study showed that participants who never own a car for personal use were likely to be highly active than those who sometimes or always have a car for personal use. While those who never own a motorbike were likely to be somewhat active than those who sometimes or always own a motorbike for personal use, those who never own a bicycle for personal use were also likely to be somewhat active than those who sometimes or always have a bicycle for personal use. Access to private transport (car, bicycle and motorbike) has been reported as the strongest correlate of active commuting among University students [25].This study has some important limitations that should be considered when interpreting the results. First, conducting the study among students of a University produced a sample of high educational status and young age, thus reducing generalizability to other Nigerian samples. Future studies should involve sample from a more heterogeneous Nigerian population. Second, the cross-sectional design used in this study does not allow inference to be drawn with respect to causal relationship among studied variables. Evidence is better strengthened by prospective or quasi-experimental studies. Third, conducting the study among residents of one a single city albeit, living in different locations campus severely restricted environmental variability. Restricted variability is a particularly serious problem for environmental studies, as has been documented for many years [38].
5. Conclusions
- This study concluded that a greater percentage of participants were, low active and somewhat active. Students that reside on campus have higher physical activity levels than those that reside off campus. Socioeconomic status has significant negative correlation with Physical activity levels of Undergraduate students of Obafemi Awolowo University, Ile-Ife.
References
| [1] | WHO. Global health risks. Mortality and burden of disease attributable to selected major risks. 2009. http://www.who.int/healthinfo/global_burden_disease/GlobalHealthRisks_report_full. pdf (accessed August 18, 2013). |
| [2] | Haskell WL, Lee IM, Pate RR, Powell KE, Blair SN, Franklin BA, Macera CA, Heath GW, Thompson PD, Bauman A: Physical activity and public health: updated recommendation for adults from the American College of Sports Medicine and the American Heart Association. Med Sci Sports Exerc 2007; 39:1423-1434. |
| [3] | Bauman A, Armstrong R, Davies J, Owen N, Brown W, Bellew B, Vita P: Trends in physical activity participation and the impact of integrated campaigns among the Australian adults, 1997–99. Aust N Z J Health 2003; 27:76-79. |
| [4] | Lobstein T, Jackson-Leach R: Estimated burden of pediatric obesity and co-morbidities in Europe. Part 2. Numbers of children with indicators of obesity-related disease. Int J Pediatr Obes 2006; 1:33-41. |
| [5] | Daniels SR, Arnett DK, Eckel RH, Gidding SS, Hayman LL, Kumanyika S, Robinson TN, Scott BJ, St Jeor S, Williams CL: Overweight in children and adolescents: pathophysiology, consequences, prevention, and treatment. Circulation 2005; 111:1999-2012. |
| [6] | Torrance B, McGuire KA, Lewanczuk R, McGavock J: Overweight, physical activity and high blood pressure in children: a review of the literature. Vasc Health Risk Manag 2007; 3:139-149. |
| [7] | Guthold R, Ono T, Strong KL, Chatterji S, Morabia A. Worldwide variability in physical inactivity: a 51-country survey. Am J Prev Med 2008; 34:486– 494. |
| [8] | Hallal PC, Andersen LB, Bull FC, Guthold R, Haskell W, Ekelund U. Physical Activity Series Working Group. Global physical activity levels: surveillance progress, pitfalls, and prospects. Lancet 2012; 380:247–257. |
| [9] | Sallis JF. Environmental and policy research on physical activity is going global. Res Exerc Epidemiol 2011; 13(2): 111-117. |
| [10] | Guthold R, Louazani SA, Riley LN, Cowan MJ, Bovet P, Damasceno A et al, Physical activity in 22 African countries: Results from WHO STEPwise Approach to chronic disease risk factor surveillance. Am J Prev Med 2011; 41: 52-60. |
| [11] | Sallis JF, Owen N, Fisher EB. Ecological models of health behavior. In: Glanz K, Rimer BK, Viswanath K (Eds): Health behavior and health Education: Theory, research, and practice, 4th edn. 2008. Jossey-Bass, San Francisco, pp. 465-486. |
| [12] | Sallis JF, Cervero R, Ascher WW, Henderson K, Kraft MK, Kerr J. An ecological approach to creating active living communities. Annual Review of Public Health 2006; 27: 14.1-14.26 |
| [13] | Owen N, Humpel N, Leslie E, Bauman A, Sallis JF. Understanding environmental influences on walking: review and research agenda. Am J Prev Med 2004; 27: 67-76. |
| [14] | Heath GW, Brownson RC, Kruger J et al, 2006; The effectiveness of urban design and land use and transport policies and practices to increase physical activity: a systematic review. J Phys Act Health 2006; 3(IS): S55- S76. |
| [15] | Gebel K, Bauman AE, Petticrew M. The physical environment and physical activity: a critical appraisal of review articles. Am J Prev Med 2007; 32:361–369. |
| [16] | Saelens BE, Handy SL. Built environment correlates of walking: a review. Med Sci Sports Exerc 2008; 40 (7) S:S550– 566. |
| [17] | Van Dyck D, Cerin E, Conway TL, De Bourdeaudhuij I, Owen N, Kerr J, Cardon G, Frank LD, Saelens BE, Sallis JF: Perceived neighborhood environmental attributes associated with adults' transport-related walking and cycling: Findings from the USA, Australia, and Belgium. Int J Behav Nutr Phys Act 2012; 9:70. |
| [18] | Van Dyck D, Deforche B, Cardon G, De Bourdeaudhuij I. Neighborhood walkability and its particular importance for adults with a preference for passive transport. Health & Place 2009; 15: 496-504. |
| [19] | Sallis JF, Bowles HR, Bauman A, Ainsworth BE, Bull FC, Craig CL, et al. Neighborhood environment and physical activity among Adults in 11 countries. Am J Prev Med 2009a; 36:484- 490. |
| [20] | Bauman AE, Reis RS, Sallis JF, Wells JC, Loos RJF, Martin BW on behalf of the Lancet Physical Activity Series Working Group: Correlates of physical activity: Why are some people physically active and others not? Lancet 2012; 380:31-44. |
| [21] | Parra DC, Hoehner CM, Hallal PC, Ribero RC, Reis R, Brownson RC, Pratt M, Simoes EJ: Perceived environmental correlates of physical activity for leisure and transportation in Curitiba, Brazil. Prev Med 2011, 52:234–238 |
| [22] | Oyeyemi AL, Adegoke BOA, Oyeyemi AY, Sallis JF: Perceived environmental correlates of physical activity and walking in African young adults. Am J Health Promot 2011;25 (5):e10-e19. |
| [23] | Oyeyemi AL, Sallis JF, Adegoke BOA, Oyeyemi AY, De Bourdeaudhuij I: Perception of neighborhood safety is related with physical activity among adults in Nigeria. BMC Public Health 2012, 12:294. |
| [24] | Sisson SB and Tudor-Locke C, Comparison of cyclists’ and motorists’ utilitarian physical activity at an urban university. Prev Med 2008; 46:77-79. |
| [25] | Molina-Garcia J, Castillo I, Sallis JF. Psychosocial and environmental correlates of active commuting for university students. Prev Med 2010; 51: 136-138. |
| [26] | Adegoke BO, Oyeyemi AL. Physical inactivity in Nigerian young adults: prevalence and socio-demographic correlates. J Phys Act Health 2011, 8, 1135 -1142 |
| [27] | Rzewnicki R, Vanden Auweele Y, De Bourdeaudhuij I. Addressing over-reporting on the international physical activity questionnaire (IPAQ) telephone survey with a population sample. Public Health Nutr 2003; 6:299– 305. |
| [28] | Sallis JF, Saelens BE. Assessment of physical activity by self-report: status, limitations, and future directions. Res Q Exerc Sport. 2000; 71(2 Suppl):S1-14. |
| [29] | De Bourdeaudhuij I, Teixeira PJ, Cardon G, Deforche B. Environmental and psychosocial correlates of physical activity in Portugese and Belgian adults. Public Health Nutr. 8, 888-895. |
| [30] | Tudor-Locke1 C, Bassett DR Jr . How Many Steps/Day Are Enough? Preliminary Pedometer Indices for Public Health. Current opinion Sports Med 2004; 34 (1): 1-8 0112-1642/04/0001-0001. |
| [31] | Spinks A, Macpherson A, Bain C, McClure R. Determinants of sufficient daily activity in Australian primary school children. J Paediatr Child Health 2006 42(11):674-9. |
| [32] | Salmon J, Timperio A, Telford A, Carver A, Crawford D. Association of Family Environment with Children’s Television Viewing and with Low Level of Physical Activity, Obesity research 2005; 13:1939-1951. |
| [33] | Caspersen CJ, Pereira MA, Curran KM. Changes in physical activity patterns in the United States, by sex and cross-sectional age. Med Sci Sports and Exer, 2000; 32, 1601–1609. |
| [34] | Sjostrom M, Oja P, Hagstromer M, Smith B, Bauman A. Health enhancing physical activity across European Union countries: the Eurobamoter study. J Public Health 2006;14: 291–300. |
| [35] | Al-Tannir M, Kobrosky S, Itani T, El-Rajab M, Tannir S. Prevalence of physical activity among Lebanese adults: across-sectional study. J Phys Act Health 2009; 6:315–320. |
| [36] | Bergman P, Grjibovski AM, Hagströmer M, Bauman A, Sjöström M. Adherence to physical activity recommendations and the influence of socio-demographic correlates—a population-based cross-sectional study. BMC Public Health 2008;8:367. |
| [37] | Trin OTH, Nguyen ND, Dibley MJ, Phongsavan P, Bauman AC. The prevalence of physical inactivity among adults in Ho Chi Minth city. BMC Public Health 2008; 8:204. |
| [38] | Giles-Corti B, Donovan RJ. The relative influences of individual, social, and physical environment determinants of physical activity. Soc Sci Med 2002; 54: 1793–1812. |