Rhonda Magel1, Yana Melnykov2
1Department of Statistics, North Dakota State University, Fargo, ND 58103, USA
2Department of Information Systems, Statistics and Management Science, University of Alabama, Tuscaloosa, AL 35487, USA
Correspondence to: Rhonda Magel, Department of Statistics, North Dakota State University, Fargo, ND 58103, USA.
| Email: |  |
Copyright © 2014 Scientific & Academic Publishing. All Rights Reserved.
Abstract
An analysis is done on soccer games played by three top European soccer leagues: England, Spain, and Italy during the first 33 rounds of soccer during the 2011-2012 year. Each league has 20 teams playing two games with each other. Two regression models are developed in an effort to predict the point spread of a game between two teams (Team A and Team B) based on the following variables: sum of differences in the number of cards received by Team A and their opposing teams for the last k rounds, sum of differences in the number of cards received by Team B and their opposing teams for the last k rounds, sum of differences in the number of goals received by Team A and their opposing teams for the last k rounds, and sum of differences in the number of goals received by Team B and their opposing teams for the last k rounds, with the value of k always being even. The models developed were used to predict winners of games for the last five rounds of the 2011-2012 season. The models correctly predicted the winner of a game at 73% to 80% of the time. Of particular interest in this research is whether the sum of the differences in the number of cards received by each team and their opponents in the last k rounds of soccer has a significant effect on which team will win the soccer match.
Keywords:
Logistic Regression, Least Squares Regression, Point Spread Models, Win Probability Models
Cite this paper: Rhonda Magel, Yana Melnykov, Examining Influential Factors and Predicting Outcomes in European Soccer Games, International Journal of Sports Science, Vol. 4 No. 3, 2014, pp. 91-96. doi: 10.5923/j.sports.20140403.03.
1. Introduction
The use of statistics in sports has drawn tremendous interest in the past several years. It has encompassed several sports and several different aspects of the sports. In this paper, we will focus our analysis on soccer games. Various aspects of soccer games have been studied. Hart, Hutton, and Sharot (1975) [1], for example, developed a model to estimate the attendance at particular soccer games in England using entrance fee, cost of alternative entertainment, and level of personal income as the independent variables. Kellis and Katis (2007) [2] conducted research on kicking biomechanics and studied the effects that may cause a successful kick. Rusu, Stoica, Burns, Hample, Mcgarry and Russell (2010) [3] designed a system that included visualization tools which can compare players from two different teams.Ridder, Cramer, and Hopstaken (1993) [4] studied the effects of red cards in a soccer match and the optimal uses of red cards. Ridder et al. (1993) felt that the use of red cards was significant in determining which team would win the soccer match. Parentos (2012) [5] developed a model to determine factors in a soccer game that influence the number of goals that a team scores. Two of the variables that he considered were ball possession percentage and the logarithm of the ratio between goals scored and goals conceded. Parentos (2012) found the number of yellow cards or red cards received by a team to be insignificant in the model. Due to the findings of both [4] and [5], we would like to further investigate the significance of receiving cards in winning or losing a soccer match.The purpose of this research is to develop models that can be used to predict in advance the outcome of European soccer games. Samples will be collected from three different European countries. The models will be applied to five rounds of soccer games in each of the three countries and correct prediction percentages will be given. As a secondary part of this research, since the sum of differences in number of cards received by each team playing in a game and their opponents during the last set of rounds are considered in the models, we would like to further investigate the distributions of cards given in games. In particular, we would like to compare the average number of cards that a team receives while playing a game at home with the average number of cards a team receives while playing a game away. We would also like compare the number of cards received by teams in different countries to determine if there is a significant difference.
2. Models Developed for Prediction
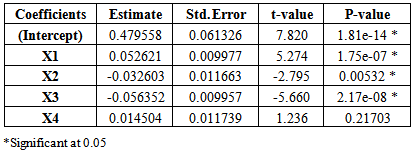
Data was collected from the 2011-2012 season for three countries: England, Spain, and Italy. There are 20 teams in each country. Each pair of teams from the same country would play two matches against each other, each team plays at home, and each team plays away for a total of 38 games.A soccer game consists of two halves, each lasting 45 minutes. Every soccer game was further divided into 15 minute periods: 0-15; 16-30, 31-45 (end of the first half); 46-60; 61-75; 76-90 (end of the second half). There were 38 rounds of soccer for each country during the regular season. We developed models based on the first 33 rounds of soccer played in each country to predict the results of the last 5 rounds using ordinary least squares regression. The dependent variable was the difference between gh and ga, gh-ga, where gh and ga are the number of goals scored by the home and away teams, respectively. For example, if the difference is 2, it means that the team playing at home won by scoring 2 more goals than the away team. If the difference is -1, it means that the home team lost with the difference in one goal. In all models, the following independent variables were considered:-X1-sum of the differences between the number of goals received by a home team and the number of goals received by its opponents in the last k rounds;-X2-sum of the differences between the number of goals received by away team and its opponents in the last k rounds;-X3-sum of the differences between the number of cards received by a home team and the number of cards received by its opponents in the last k rounds;-X4-sum of the differences between the number of cards received by away team and the number of cards received by its opponents in the last k rounds;-X5 and X6- two indicator variables to represent countries (England, Spain, and Italy).It is noted that the number of cards includes both yellow and red cards for a team. The values of k were 4, 6, 8, 10, 12, always even so that an equal number of prior home and away games that each team had played was included in the data. The parameters of the models were estimated based on the first 33 rounds of soccer games played. Different models were developed depending upon the value of k used. The sample sizes used to develop the models also varied with k. When k was equal to 4, 29 rounds of soccer games for each country were used to develop the model. When k was equal to 10, 23 rounds of soccer games were used to develop the models. Logistic regression was also used to develop models to predict results of the last five rounds. The dependent variable in logistic regression is binary with the value 1 indicating a win or draw for the home team, and the value 0 indicating a loss for the home team. The same set of independent variables as considered in the least squares models were also considered in this case. Results from the ANOVA tables constructed for all 5 of the least squares regression models (one for each different value of k) indicate that the variables for country (X5 and X6) are not significant (p>0.2). Therefore, the same models can be used for all three countries. The three variables found to be significant in all of the models considered were X1, X2, and X3. It was determined that X4 would be left in the model since it gave the same information for the away team as X3 did for the home team. The ANOVA table for the least squares regression model based on information from the previous 8 games for both teams (k=8) is given in Table 1. Table 1. ANOVA table of the linear regression model based on the last 8 games
 |
| |
|
Based on the least squares regression model, when k was equal to 8, we predicted the last 5 rounds of soccer for all of the countries by putting the values of the independent variables into the model and predicting the home team would win if this estimated goal difference was positive and predicting the away team would win if the goal difference was negative. We were correct for 76% of the games. Information as to how the model did with the various rounds in each country is given in Figure 1.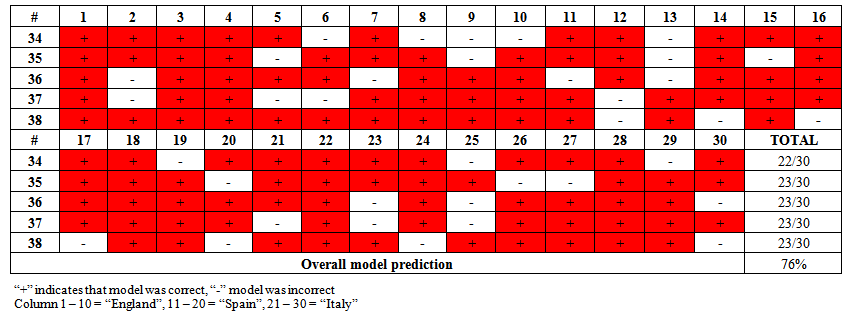 | Figure 1. Model prediction based on the last 8 games |
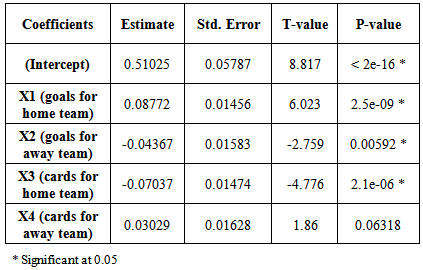
The worst prediction rate for all the least squares models was k was equal to 6. The correct prediction rate for the last 5 rounds using this model was 73%. The highest successful prediction rate was at 79% for the model with k equal to 10. The ANOVA table associated with the model when k was equal to 4 is given in Table 2. This model had a correct prediction percentage of 75%.From looking at the ANOVA table in Table 2, one can see that the home team has approximately a ½ goal advantage if all the X variables are 0 since the constant term is estimated to be .510. Therefore, if the sum of the differences in the last 4 games of goals between the home team and their opponents was 0, and the sum of the differences in the last 4 games of goals between the away team and their opponents was 0, and the sum of the differences in cards received by the home team and their opponents for the last 4 games was 0, and the sum of the differences in cards received by the away team and their opponents in the last 4 games was 0, the home team would have approximately a ½ goal advantage. The model is given by the following:  | (1) |
One can also see that the sum of the differences between number of goals a home team scores and their opponent scores in the last 4 games has about twice as much weight in determining the winner of the game, 0.88, as the sum of the differences between the numbers of goals an away team and their opponents scored, 0.44. Table 2. ANOVA table of the linear regression model based on the last 4 games
 |
| |
|
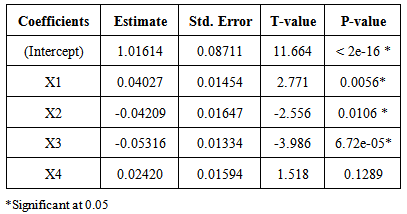
We found cards to have a negative impact on winning a game. We also found that the weight was about twice as much for the sum of the differences in numbers of cards that the home team and their opponents have received during the last 4 games, 0.070, as the sum of the differences in the numbers of cards for the away team and their opponents in the last 4 games, 0.030. The following is an example as to how the equation (1) can be applied:Team A – Home and Team B – AwayEstimate the difference between goals of Team A and Team B, namely estimate gA-gB.Team A has scored 1 more goal than their opponents during the last 4 gamesTeam B has scored 8 more goals than their opponents during the last 4 gamesTeam A has had 10 more cards than their opponents during the last 4 gamesTeam B has had 2 less cards than their opponents during the last 4 games (-2)Estimate the difference between goals using equation (1): = -0.69 (predict Team B will win since the estimated difference between goals scored by Team A and goals scored by Team B is negative)Logistic regression models were found based on the same variables as used in least squares regression and the same k values equal to 4, 6, 8, 10, or 12. The variables X1, X2, and X3 were the significant variables at alpha equal to 0.05 for all values of k, but X4 was kept in the model because it made more sense. The ANOVA table for the model when k is equal to 8 is given in Table 3.
 Table 3. ANOVA table of logistic regression model based on 8 last games
 |
| |
|
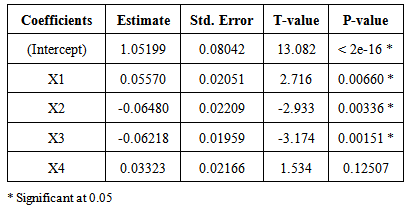
The values of the independent variables were placed into the models to predict the outcomes of games during the last 5 rounds. This was done for all the models with all the values of k considered. We predicted that the home team would win or tie if the value from the logistic model came back greater than or equal to 0.50, otherwise, we predicted the home team to lose. The correct prediction rates were all very close ranging from 74% to 80%. When k was 4, the correct prediction rate was 76%. The ANOVA for the model when k=4 is given in Table 4. When k was equal to 8, the correct prediction rate was 77%. It was 79% and 80% based on models using the last 10 and 12 games, respectively. Since there is not very much difference in the prediction rates when k=4 through when k=12; one may as well just consider the values of the four variables based on the previous four games each of the teams has played.Table 4. ANOVA table of the logistic regression model based on the last 4 games
 |
| |
|
The logistic model estimates the probability that the home team will win or tie the game by first calculating the value of Y using the estimated coefficients as given in Table 4. Namely, | (2) |
The logit transformation [6] is then used to get the estimate of the probability that the home team will win or tie the game. Namely, the probability is estimated by the equation | (3) |
In order to see how the logistic model works, we will consider the same example as in the goal margin model. Team A is the home team and has scored 1 more goal than their opponents during the last 4 games and has received 10 more cards than their opponents during the last 4 games. Team B is the away team and has scored 8 more goals than their opponents and has received 2 fewer cards than their opponents during the last 4 games. Applying the model, we obtain Next, doing the logit transformation to get the estimated probability Team A will or tie the game gives= e -.098/(1+e-.098)= 0.476 (predict Team B will win since the estimated probability of Team A winning is less than 0.50).Overall, our models did a fairly good job of predicting the winner of a soccer game with a correct prediction rate of 75%-76% when given the values of 4 variables based on the last 4 games played by the home and away teams. The 4 variables were the following: sum of differences of goals scored between the home team and their opponents; sum of differences of goals scored between the away team and their opponents; sum of differences in the number of cards received between the home team and their opponents; and sum of differences in the number of cards received between the away team and their opponents.
3. Testing for Difference in Number of Cards between Home and Away Teams
We used all 38 rounds of data from the 2011-2012 season from the championship series soccer games from England, Spain and Italy and tested whether or not there was a difference in the average number of cards received (red or yellow) between home and away teams in the countries of England, Spain, and Italy. Using paired t-tests, we tested whether the average number of cards received by teams playing at home was different than the average number of cards received by teams playing away. We first conducted this test for team in Spain and found that teams at home receive fewer cards on average with the mean difference being -0.27 (p-value=0.008). This was also true for teams in England (p-value<0.001) and teams in Italy (p-value=0.017)
4. Testing for Differences in Proportions of Cards Given between the Three Countries
We conducted a test to check if the proportions of cards given out are the same for all three countries where pi represents the proportion of cards given to teams in Country i. We first tested whether the proportions were the same for teams playing at home in the countries of Spain, Italy, and England. H0: p1=p2=p3 = 1/3Ha: H0 is not true where p1, p2, and p3 represent the proportion of the total number of cards given to all home teams in the countries of Spain, Italy, and England. The null hypothesis was rejected with a p-value less than 0.001. The proportion of cards given in soccer for home teams is not the same for all the countries. In our sample, the Spanish teams playing at home received 924 cards, the Italian teams received 761 cards, and the English teams, received 520 cards. We also tested whether the proportion of cards received by away teams in all three countries was the same. The null hypothesis in this case was also rejected with a p-value < 0.001. In our sample, the Spanish teams playing away received 1025 cards. The Italian teams received 832 cards while playing away and the English teams received 667. Cards. Figure 2 gives the histograms of the number of received for each game for home teams in the countries of England, Spain, and Italy. It is noted that the shapes of the histograms are similar, but the number of cards received by English teams does look smaller on the average than the number of cards received by Spanish or Italian teams when playing at home.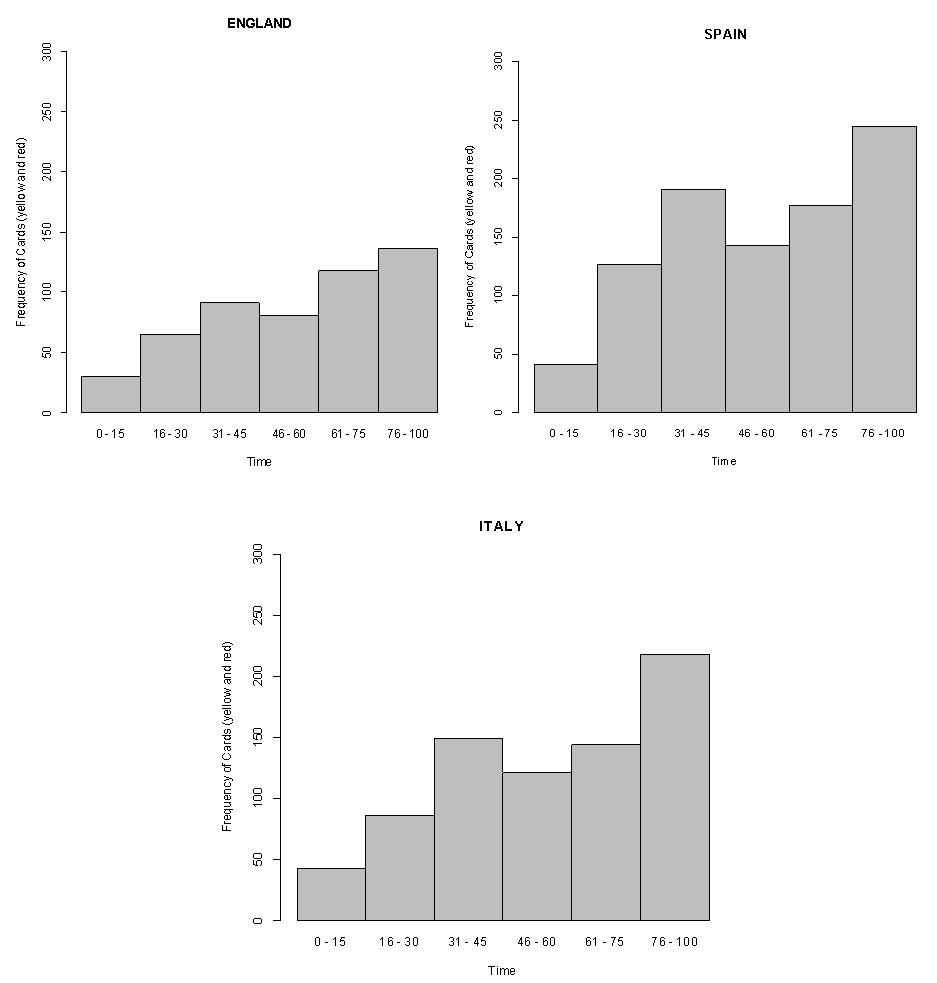 | Figure 2. Number of Cards Received per Game for Home Teams in England, Spain, and Italy During the Varrious Time Periods |
With further testing, it was found that the average number of cards received per game for an English team was 3.12, while the average number of cards received per game for a Spanish or Italian team was 4.66. Spanish and Italian teams were found to have received significantly more cards per game on average than English teams (p-value=0.001).
5. Conclusions
Least squares regression models were developed to predict the point spread of a soccer game by estimating the score difference between the team playing at home and the team playing away. These models were developed using data from the 2011-2012 season from the leagues in England, Spain, and Italy. The models correctly predicted 73% to 79% of the matches correctly using the values of four variables collected on the past k games of the teams involved in the match with k being 4, 6, 8, 10, or 12. Logistic models were also developed estimating the probability that the home team would win the match based on the same four variables that were used in the least squares regression models. The logistic models also had about the same correct prediction rate. From this study, it was found that using variables based on the last four rounds of games played by the two teams did about the same as when the last 6, 8, 10, or 12 rounds were used. Significant variables included the sum of the differences in cards between the home team and their opponents during the last k rounds, the sum of the differences in goals between the home team and their opponents in the last k rounds, and the sum of the differences in goals between the away team and their opponents in the last k rounds. The sum of the differences in cards between the away team and their opponents in the last k rounds was marginally significant (0.05﹤p-value<0.10) in the least squares regression model with k equal to 4. It was not significant in other models.A significant difference between the number of cards received by home teams and the number of cards received by away teams was found for all three countries with the number of cards received by teams playing away being significantly higher.A significant difference in the proportions of cards given to each of the countries was found when home teams were considered and then when away teams were considered. With further testing, it was found that teams in England received significantly fewer cards per game then teams in Spain or Italy.
6. Discussion
This research did find that if a team consistently received more cards than their opponents, this did have a negative impact on winning the game of soccer. However, the impact on the goal margin (difference in goals) of one additional card a home team received than their opponents in the last 4 games only amounted to reducing the estimated goal margin by 0.07 on the average for the home team. Therefore, unless teams ended up receiving a lot more cards in games than their opponents, this would not have very much of an effect. The home team had an advantage on the average of ½ of a goal if all the X variables in the model were 0. This effect would be taken away if the home team averaged 6 more cards than their opponents during the previous 4 games since 6 times .088 is equal to .528 (see Table 2). More weight in the goal margin model was on placed on what the home team had done in the last 4 games than what the away team had done when considering both cards and goals (see coefficients in Table 2). The models found the sum of the differences between the total number of goals between the home team and their opponents and then the away team and their opponents over the previous four rounds to be significant. This sum however, had about twice the weight in the goal margin model for the home team as for the away team. For example, if the home team scored 10 more goals than their opponents over the last 4 games, the model had the goal margin increasing in favour of the home team by 0.88. If the away team scored 10 more goals than their opponents over the last 4 games, the model had the goal margin difference decreasing for the home team by 0.44. If the home team received 10 more cards than their opponents over the last 4 games, the model had the goal margin decreasing for the home team by 0.703. If the away team received 10 more cards than their opponents over the last 4 games, the goal margin model had the goal margin increasing by 0.303 in favour of the home team.In the logistic regression model, more weight was placed on the sum of differences in goals in the last 4 games between the home team and their opponents than on the differences in goals between the away team and their opponents (see Table 4). The weights given to the differences in cards received by the home team and their opponents and the away team and their opponents were about the same.We did find that home teams received significantly fewer cards on average than away teams and this was true in Italy, Spain, and England. The models that were derived did use the results from an even number of previous games played by both teams, and therefore the results from an equal number of home games and away games were considered for both teams. This is good because if more away games were considered for a team, or more home games were considered for a team, this could skew the results of the estimates from the models. One limitation of the study is that it only considered games played within the same country. If teams from different countries played each other, these models would not work because the number of cards received by teams in different countries was found to be significantly different. Country was not found to be significant in our models, therefore, the results could be carried over to all three countries of Italy, Spain, and England. The results could possibly be carried over to other European countries as well, but one of the limitations in the model is that only the three countries mentioned were considered. It should also be noted that data for this study was only collected during the 2011-12 season. If rules change during another season, the results may not be applicable.
References
| [1] | A. Hart, J. Hutton, T. Sharot, 1975, A statistical analysis of association football attendances, Journal of the Royal Statistical Society – Series C, 24, 17. |
| [2] | E. Kellis, and A. Katis, 2007, Biomechanical characteristics and determinants of instep soccer kick, Journal of Sports Science and Medicine, 6, 154-165. |
| [3] | A. Rusu, D. Stoica, E. Burns, B. Hample, K. McGarry, R. Russell, 2010, Dynamic visualizations for soccer statistical analysis, Conference Publication, 207-212. |
| [4] | G. Ridder, J.S. Cramer, P. Hopstaken, 1994, Down to ten: estimating the effect of the red card in soccer, Journal of the American Statistical Association, 89, 1124-1127. |
| [5] | V. Panaretos, 2012, A statistical analysis of the European Soccer Champions League, Joint Statistical Meetings – Section on Statistics in Sports, 2600-2602. |
| [6] | W. Mendenhall and T. Sincich, 2012, A Second Course in Statistics Regression Analysis, 7th edition, p 465, Pearson Education, Inc., Boston, MA. |


 = -0.69 (predict Team B will win since the estimated difference between goals scored by Team A and goals scored by Team B is negative)Logistic regression models were found based on the same variables as used in least squares regression and the same k values equal to 4, 6, 8, 10, or 12. The variables X1, X2, and X3 were the significant variables at alpha equal to 0.05 for all values of k, but X4 was kept in the model because it made more sense. The ANOVA table for the model when k is equal to 8 is given in Table 3.

 Next, doing the logit transformation to get the estimated probability Team A will or tie the game gives= e -.098/(1+e-.098)= 0.476 (predict Team B will win since the estimated probability of Team A winning is less than 0.50).Overall, our models did a fairly good job of predicting the winner of a soccer game with a correct prediction rate of 75%-76% when given the values of 4 variables based on the last 4 games played by the home and away teams. The 4 variables were the following: sum of differences of goals scored between the home team and their opponents; sum of differences of goals scored between the away team and their opponents; sum of differences in the number of cards received between the home team and their opponents; and sum of differences in the number of cards received between the away team and their opponents.
 Abstract
 Reference
 Full-Text PDF
 Full-text HTML


