-
Paper Information
- Next Paper
- Paper Submission
-
Journal Information
- About This Journal
- Editorial Board
- Current Issue
- Archive
- Author Guidelines
- Contact Us
International Journal of Sports Science
p-ISSN: 2169-8759 e-ISSN: 2169-8791
2014; 4(2): 39-46
doi:10.5923/j.sports.20140402.01
Effects of Service Quality in Motor Boat Racing: Relationships among Perceived Value, Customer Satisfaction, and Word-of-Mouth
 Abstract
 Reference
 Full-Text PDF
 Full-text HTML
Min Kil Kim1, Donghun Lee2, Linda Schoenstedt3, Sunbok Lee4, Suk-Kyu Kim5
1School of Hospitality, Sport and Tourism Management, Troy University, Atlatna, GA, 30346, USA
2School of Physical Education, Sport and Exercise Science, Ball State University, Muncie, IN, 40736, USA
3Department of Sport Studies, Xavier University, Cincinnati, OH, 45207, USA
4Center for Family Research, University of Georgia, Athens, GA, 30602, USA
5Department of Sport Studies, Sangmyung University, Cheonan, 330-720, South Korea
Correspondence to: Suk-Kyu Kim, Department of Sport Studies, Sangmyung University, Cheonan, 330-720, South Korea.
| Email: |  |
Copyright © 2012 Scientific & Academic Publishing. All Rights Reserved.
This study examined the effects of service quality, perceived value, and satisfaction on user behavioral intentions of word-of-mouth. As a preliminary step, exploratory factor analysis (EFA) was performed to identify the underlying structure of items used in this study. In order to test the hypothesis of this study, the structural equation model (SEM) was conducted. Confirmatory factor analysis (CFA) was performed to check the validity of the measurement model. Results of the CFA provided evidence for construct-related validities (i.e., composite reliability; convergence validity; discriminant validity). The overall results of the SEM indicated that: effect of service quality on perceived value was significant; effect of service quality on satisfaction was significant; effect of perceived value on satisfaction was significant; effect of satisfaction on recommendation was significant. This study provides practitioners with meaningful managerial implications in boat racing.
Keywords: Motor Boat Racing, Service Quality, Perceived Value, Satisfaction, Word of Mouth (WOM)
Cite this paper: Min Kil Kim, Donghun Lee, Linda Schoenstedt, Sunbok Lee, Suk-Kyu Kim, Effects of Service Quality in Motor Boat Racing: Relationships among Perceived Value, Customer Satisfaction, and Word-of-Mouth, International Journal of Sports Science, Vol. 4 No. 2, 2014, pp. 39-46. doi: 10.5923/j.sports.20140402.01.
1. Introduction
- The opportunity for living very different lifestyles has escalated people’s desire to see and experience various kinds of sports (Branscombe & Wann, 1994). Motor boat racing is one of the modern sports that have been introduced by diversification of sports viewer demands. While participation in leisure sports has generally been increasing over the years, the number of boating participants has decreased from 31.9 million in 2007 to 17 million in 2012 in the U.S. (SBRnet, 2013). Conversely, there has been some evidence for increased interest in motor boat sports internationally. For example, the aim for the motor boat racing business in Korea was to efficiently utilize the infrastructure built for the 1986 Asian Games and 1988 Seoul Olympic Games, preventing insolvency of the assets and performing the business with minimal costs to achieve the optimal assignment of resources (Kim & Kim, 2006). Finding ways to grow spectatorship and maximize revenues is critical to the growth of this sport.Given the unique characteristics of motor boat racing, spectators’ needs for this sport vary widely (Kim & Kim, 2006). For example, motor boat racing is a gambling sport in Korea. In each race, six players compete with each other in different water fields (e.g., sea, river, lake), and spectators buy race tickets before the race starts. Spectators check players’ conditions and racing history to raise winning odds. A winning ticket purchaser then receives a dividend in relation to the winning odds. As a result, each race is exciting and thrilling while meeting the spectators desire to earn more dividends (Park, 2000). On the other hand, gambling in racing sports sometimes raises concerns among critics. Pro-gambling groups claim that a portion of profits earned by the racing business is used for societal benefits and thus contributes to increased tax revenues for local governments (Park, 2000). Likewise, while anti-gambling groups exist, many expect motor boat racing sports to continue as a healthy leisure activity (Lee & Kim, 2003). Since racing sports like motor boat racing include various features in satisfying healthy consumers’ service demands, it is necessary to pay attention to a customers’ perceived value as well as provide service quality, including price and differentiation. As spectators’ expectations in service quality goes up, entrepreneurs in recreation sports like motor boat racing will need to have a competitive edge and provide high service quality for consumers to meet their needs (Lee & Kim, 2003).To cultivate long-term relationships with customers, companies will need to understand customers’ varying needs and to operate their businesses based on this understanding (Peng & Wang, 2006). Analyzing service quality is important for companies to build good relationships with customers (Carlson & O’Cass, 2010; Cook & Thompson, 2000). Service providers in all types of sports should emphasize the original value of service quality and continually improve service quality in order to satisfy spectator needs (Lee, Kim, Ko, & Sagas, 2011). Currently, service demands have come to be more specialized and diversified than ever. Such trends distinctly appear in sports areas where service quality management has actively been introduced (Papadimitriou & Karteroliotis, 2000). Accordingly, the current study investigated structural relationships among key variables that affect spectators in motor boat racing: service quality of motor boat racing, perceived value, customer satisfaction, and word-of-mouth (Gallarza, Gil-Saura, & Holbrook, 2011; Howat & Assaker, 2013; Sloan, 1989; Zeithaml, Berry, & Parasuraman, 1996). More specifically, the objectives of the current study were to: first, examine the service quality of motor boat racing and perceived value; secondly, examine the relationship between service quality and customer satisfaction; thirdly, examine the relationship between perceived value and customer satisfaction; and lastly, examine the relationship between customer satisfaction and word-of-mouth.
2. Literature Review
- For the purpose of this study, it was necessary to look at the connections between and among service quality, perceived value, satisfaction and word of mouth through the lenses of other types of work organizations. Little has been written about these in the area of the sport industry in general and boat racing in particular. The research in these areas helped to formulate the goals of the current study. Service QualityService quality has been defined as “the consumer’s overall impression of the relative inferiority/superiority of the organization and its service” (Bitner & Hubbert, 1994, p. 77). Service quality is recognized as one of the primary research topics in service management and marketing (Gronroos, 1984). It provides the critical background and clues for customer-oriented marketing strategies in the sports business (Chelladurai, Scott, & Haywood, 1987; Ko, Zhang, Cattani, & Pastore, 2011; Lee et al., 2011; Shilbury, Westerbeek, Quick, & Funk, 2009). As the sports industry becomes even more global, success of a sport organization depends on the degree to which the sport organization can give satisfaction to their customers with quality service. It is also known that service quality in the recreational sport industry is evaluated by the customer’s overall impression about the service delivery systems, the service performance, and the whole consumption experience (Ko et al., 2011). Parasuraman, Zeithaml, and Berry (1994) developed an instrument called SERVQUAL that was designed to measure various aspects of service quality on the basis of the opinions in a focus group. Brady and Cronin (2001) pointed out that the survey tool emphasized that consumers’ perception of service quality is very complicated and that service quality consists of various dimensions. Additionally, several other scholars pointed out that there is a difference between basic provided service quality and perceived value (e.g. Backman &Veldkamp, 1995). Chelladurai et al. (1987) also separated objective perceptions of provided service quality with subjectively perceived service quality. The current study adopted this conceptual distinction by separating objective service quality from perceived value in order to investigate the service quality of motor boat racing. Recently, Howat and Assaker (2013) investigated the hypothesized relationships among perceived quality, perceived value, satisfaction, and loyalty. In their study, perceived quality had a strong influence on satisfaction and loyalty in their study. Perceived ValuePerceived value is defined as a “consumer’s overall assessment of the utility of a product (or service) based on the perception of what is received and what is given” (Zeithaml, 1988, p. 14). Perceived value has received increasing attention as one of the most significant factors in predicting perceived value, behavioral intention (for example to purchase a product), and loyalty in several different contexts including sports (Ko et al., 2011; Kwon, Trail, & James, 2007). In the context of the sport industry, perceived value plays a vital mediating role in the formation of customer satisfaction. This, in turn, influences future intentions. Kwon et al. (2007) also investigated how the effect of perceived value would predict the purchase of a team-licensed product. Conceptual DevelopmentRelationship between Service Quality and Perceived ValueThe relationship between service quality and perceived value has been studied in many disciplines. Hume and Mort (2010) examined the relationship between service quality and perceived value among the performing arts audiences. They found that core service quality influenced perceived value for time and money that art audiences invested for their leisure activity. Recently, Moon, Ko, Connaughton, and Lee (2013) investigated theoretical relationships among service quality, perceived value, destination image, and behavioral intention in sport events and found that service quality had a positive influence on perceived value. Howat and Assaker (2013) also found that perceived quality had a positive influence on perceived value among the users of public aquatic centers. Based on the review of literature, the following hypothesis was proposed.H1: Service quality of motor boat racing is positively related to perceived value.Relationship between Service Quality and SatisfactionIn explaining the relationship between service quality and customer satisfaction, researchers indicated that customers’ perceived service quality for provided services is a type of attitude, which is an enduring overall evaluation of the service and a precondition for customer satisfaction (Carlson & O’Cass, 2010; Howat & Assaker, 2013; Lee et al., 2011; Parasuraman et al., 1994). Kim and Kim’s (2006) research on pro cycling also supported the relationship between service quality and customer satisfaction. Accordingly, to look into the relationship between service quality and customer satisfaction for motor boat racing, the current study proposed the following hypothesis: H2: The service quality of motor boat racing is positively related to customer satisfaction.The Relationship between Perceive Value and Satisfaction Tam (2004) examined the relationship among perceived value, customer satisfaction, and post-purchase behavior in a chain of family restaurants and found that perceived value had a positive effect on customer satisfaction with a total of 73% of variance explained. Thus, if customers perceive that their desired or received value exceeds the constraints of obtaining the value, they tend to experience greater satisfaction (Tam, 2004; Woodruff, 1997). Lee, Yoon, and Lee (2007) identified multiple dimensions of perceived value for tourism and examined how the perceived value affected visitors’ satisfaction and recommendation to others. They found that tourists’ perceived value (i.e., functional, overall, and emotional value) had a significant effect on tour satisfaction and also lead to a recommendation of the tour to other people. Murray and Howat (2002) investigated the relationship between service quality, perceived value, satisfaction, and future intentions of customers by proposing two conceptual models: (a) one with satisfaction mediating the effect of value; and (b) one with value mediating the effect of satisfaction. The findings revealed that perceived value not only had a direct relationship with future behavioral intentions, but was also indirectly related to future intentions through satisfaction. To examine the relationship between perceived service quality and customer satisfaction, the current study proposed the following hypothesis:H3: Perceived value of motor boat racing is positively related to customer satisfaction. The Relationship between Satisfaction and Word-of-mouthOliver (1981) defined satisfaction as “the summary psychological state resulting when the emotion surrounding disconfirmed expectations is coupled with the consumer’s prior feelings about the consumption experience” (p. 27). The literature generally indicated that customer satisfaction affects customers’ word-of-mouth (Sloan, 1989; Zeithaml et al., 1996). It is common that satisfied customers are more likely to engage in word of mouth favorable to the object (Anderson, 1998; Maxham, 2001). In a broad sense, customer satisfaction has a close relationship with member loyalty and the behavioral aspect of customer loyalty is the repurchase intention of a product or service. Increasing customer satisfaction and customer retention have an effect on improving profits, word-of-mouth, and lower marketing expenditures (Anderson, 1998; Maxham, 2001; Reichheld, 1996). To investigate the relationship between customers’ satisfaction in motor boat racing and their intention for word-of-mouth, the following hypothesis was proposed:H4: Customer satisfaction with motor boat racing is positively related to word-of-mouth.
3. Method
- Participants and ProceduresA convenience sampling method was employed to survey individuals who have attended motor boat racing events. Participation in this study was voluntary and confidential. The questionnaire was distributed to 250 men and women who were at the boat racing field and 250 other individuals who were present at seven off-course places (Dongdaemun, Gileum, Nonhyeon, Sangbong, Gwanak, Olympic park, and Ilsan). The participants in the off-course places were asked whether they had attended motor boat racing events and only those who visited motor boat racing fields before were asked to complete the survey. A total of 462 copies were deemed usable, excluding 38 incomplete surveys. Table 1 presents the general characteristics of the subjects in the current study.
| |||||||||||||||||||||||||||||
4. Results
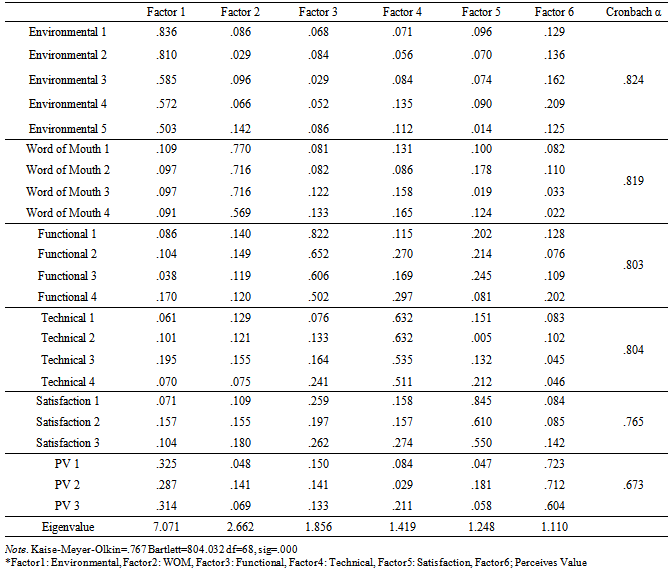
- Exploratory factor analysis (EFA) and ReliabilityTo identify a new factor structure using Varimax rotation in orthogonal analysis, the current researchers chose the items with factor loadings only greater than 0.4 that were not associated with more than one factor. As a result, six factors were retained with a total of 23 items: three factors related to service quality, one factor related to perceived value, one factor related to customer satisfaction, and one factor related to word-of-mouth. Cronbach’s alpha values ranged between .67 and .82. As a result, the internal consistency of the questions was validated. Table 3 presents the EFA results as well as Cronbach’s alpha for the six factors. Factors 1, 3, and 4 were associated with service quality. Furthermore, Factor 1 consisted of five questions and was named as ‘environmental service quality’ had an Eigen-value of 7.80 and explanatory power of 29.5% that was higher than the explanatory power of the functional service quality factor. Factor 3 was named as ‘functional service quality’ and its Eigen-value was 1.86 and its explanatory power was 7.73%. Factor 4 was named as ‘technical service quality’ and had Eigen-value of 1.42 and explanatory power of 5.9%. Factor 2 was named as ‘recommendation service quality’ and had an Eigen-value of 2.41 and explanatory power of 11.1%. Factor 5 was named as ‘customer satisfaction’ and had an Eigen-value of 1.25 and explanatory power of 5.2%. Lastly, factor 6 was named as ‘perceived service quality’ and had an Eigen-value of 1.11 and explanatory power of 4.63%. The overall EFA results revealed that all extracted items except for three showed more than 0.5 factor-loading, and their accumulative percentage was 64.0%. In conclusion, the overall results indicated that questions were measured in a relatively valid way.
|
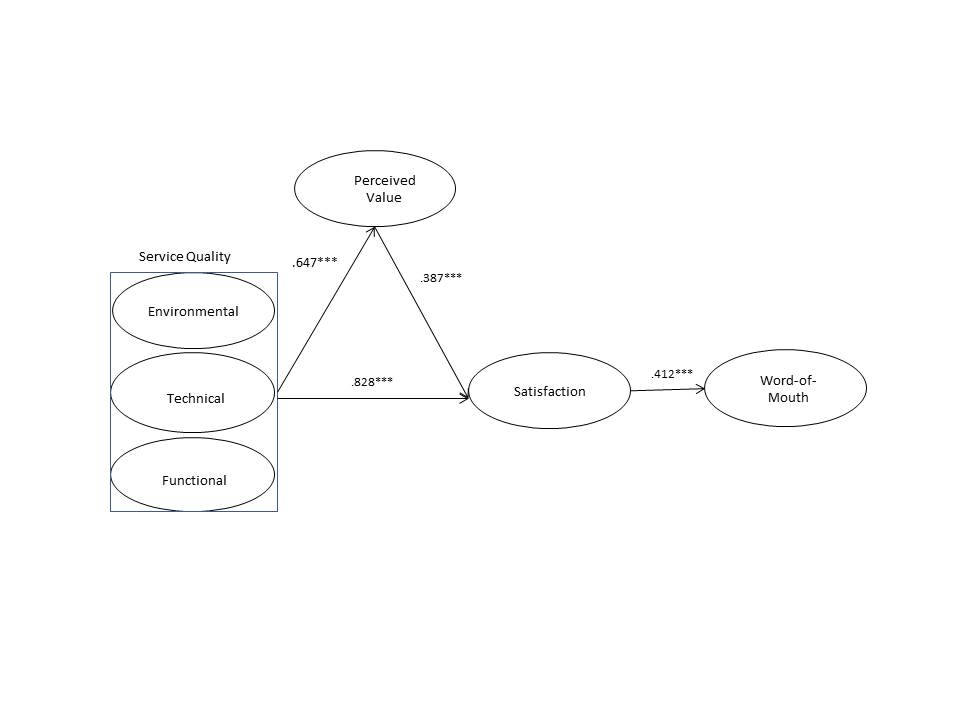 | Figure 1. The finalized model |
|
5. Discussion
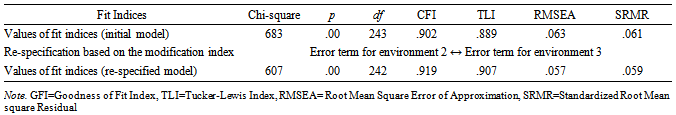
- This study aimed to examine the proposed relationships among service quality, perceived value, customer satisfaction, and word-of-mouth in the context of motor boat racing. Prior to examination of the study hypotheses through path coefficients of structural equation, suitability of the measurement part of the model was first checked through confirmatory factor analysis. The results suggest that the proposed structural relationships among service quality, perceived value, satisfaction, and behavioral intention (word-of-mouth) toward spectators of motor boat racing in Korea were empirically supported in the current study. In addition, just as modification indexes were used in confirmatory factor analysis to accept error terms, the error terms in environment 2 and environment 3 were accepted in the SEM. As a result, the suitability of the entire model increased and thus was found to be appropriate. Consistent with Howat and Assaker’s (2013) research, the findings support the direct effects that service quality has on satisfaction mediated by perceived value. Under the judgment that the study model has suitable measurement properties, the study hypotheses were further tested through the path coefficients of the structural equation modeling. Table 5 presents the path coefficients of the study model. The empirical analysis of the path coefficient between service quality and perceived value was statistically significant, supporting hypothesis 1: ‘Service quality of motor boat racing is positively related to perceived value.’ It was further found that the sub factors of service quality (i.e., environment, technique, and functionality) significantly affected perceived values of the spectators in motor boat racing. This result is consistent with the previous studies (Howat & Assaker. 2013; Hume & Mort, 2010; Moon et al., 2013). The literature generally indicated that service quality significantly and positively influenced perceived value. This result may suggest that the operating head office of motor boat racing needs to take into consideration the actual service quality for better customer perception of the overall service value. This can be achieved especially when the three sub factors (i.e., functional, environmental, and technical) in service quality are fully considered in enhancing the customer perception for current and future customers of motor boat racing. The empirical analysis on hypothesis 2 showed statistical significance, supporting the fact that service quality positively affected customer satisfaction in the context of motor boat racing. This finding is also consistent with the previous studies (Carlson & O’Cass, 2010; Howat & Assaker, 2013; Parasuraman et al., 1994). Confirmation of the hypothesis 2 generally indicates that when the service quality provided by a company is high, customers’ loyalty toward the company increases, which subsequently enhances the relationship between the company and its customers (Parasuraman et al., 1994). This type of result implies that the operations office of motor boat racing will need to constantly maintain a high level of service quality to maintain a favorable outlook by customers’ towards motor boat racing, as well as achieve customer satisfaction and improve word-of-mouth advertising. Hypothesis 3 was also empirically supported in the current study, indicating that the perceived value of motor boat racing spectators affects overall satisfaction in their experience. This finding is consistent with the previous studies (Lee et al., 2007; Murray & Howat, 2002) in that the perceived value had a positive effect on satisfaction. It is worth noting that the effect of service quality is not immediately observable because the effect is usually cumulative just as the typical advertising effect is (Parasuraman et al., 1994). As a result, the operations office of motor boat racing should make strong connections among the areas of service quality and perceived value for constant customer satisfaction. Hypothesis 4 was empirically supported, indicating that the spectator satisfaction of motor boat racing affects their intention for word-of-mouth. This result is consistent with the result of Kim’s (2012) study. They found that spectator satisfaction among Korean professional baseball spectators positively affected their intention of re-viewing future games. They also found that customer satisfaction was closely associated with service quality of young children’s sports club participation, customer satisfaction, their intention of reusing facilities, and word-of-mouth intention. Confirmation of the hypothesis 4 of the current study supports the result of previous studies, revealing that customer satisfaction played a more positive role in purchase intention than service quality does. In other words, it indicates that customer satisfaction is a significant leading variable of word-of-mouth (Anderson, 1998; Maxham, 2001; Reichheld, 1996). This type of result may suggest to practitioners that it is necessary to improve customer satisfaction for watching motor boat racing and enhance customers’ intention of word-of-mouth through good service quality.Intention for word-of-mouth refers to the collective external activity that customers voluntarily and actively take. This behavioral intention often plays a critical role in the information processing of potential customers’ decision-making process. The literature consistently indicates that customers’ intention for word-of-mouth is affected by the level of service quality (Bitner, 1990; Dabholkar, Shepherd, & Thorpe, 2000; Oliver, 1981; Reichheld & Sasser, 1990). To concentrate on the mediating influences of perceived value, the current research did not add a hypothesis path between service quality and WOM. Parasuraman et al. (1994) reported that when the service quality provided by a company is high, customers’ loyalty towards the company increases, which positively enhances the relationship between the company and the customers. On the contrary, when the service quality provided by a company is low, customers’ loyalty of the company decreases, which leads to a negative relationship between the company and customers (Lee & Kim, 2003). Additionally, the results of this study suggest that the factors of service quality and customer satisfaction have a positive influence on behavioral intention. Customer satisfaction has been a focus of academics and practitioners in light of the fact that it is related to most organizations’ source of revenue. Therefore, the primary goal for most service companies today is achieving customer satisfaction. This, in turn, build a close relationship with member loyalty, understanding the behavioral aspects of customer loyalty and the repurchase intentions of a product or service. Limitation of this study is that the combined effect is greater than what can be explained by a single factor. The perceived value was measured via a single item and this might not comprehensively cover the concept of perceived value in the sport marketing setting. For this reason, it is suggested that perceived value might be better measured by a multi-dimensional scale in future studies.
6. Conclusions
- The purpose of this study was to examine the structural relationships among provided service quality, perceived service quality, satisfaction, and spectators’ intention for word-of-mouth in the context of motor boat racing. The researchers believe that the empirical investigation of proposed variables provide insights to establish an operational plan and marketing strategy for the entrepreneurs in motor boat racing industry. Given the result of this work, it was found that provided service quality had a significant influence on customer satisfaction through perceived service quality. In other words, it is necessary to work intentionally with customers to help develop a spectator’s perceived sense of service quality. The approach is needed as a strategy to achieve word-of-mouth advertising through customer satisfaction. More specifically, operations offices should probe the ways to provide additional quality service to customers such as value-added items like posters, miniature boats, giveaways, etc. Implementing pass-by interviews would be helpful to assess levels of satisfaction or to ask how likely is that a spectator would tell a friend about their experience, if it was a good one or how it could be made better. While there is an ample amount of literature on WOM and marketing in sport, this study is unique because of the perceived linkages that connect service quality and behavioral intention.
References
| [1] | Anderson, E. W. (1998). Customer satisfaction and word of mouth. Journal of service research, 1(1), 5-17. |
| [2] | Anderson, J. C., Gerbing, D. W. (1991). Predicting the performance of measures in a confirmatory factor analysis with a pretest assessment of their substantive validities. Journal of Applied Psychology, 76(5), 732-40. |
| [3] | Backman, S. J., & Veldkamp. C. (1995). Examination of the relationship between service quality and user loyalty. Journal of Park and Recreation Administration, 13(2), 29-41. |
| [4] | Bagozzi, R. P. & Yi, Y. (1988). On the Evaluation of Structural Equation Models. Journal of the Academy of Marketing Science, 16(1), 74-94. |
| [5] | Bitner, M. J. (1990). Evaluating service encounters: the effects of physical surroundings and employee responses. The Journal of Marketing, 69-82. |
| [6] | Bitner, M. J., & Hubbert, A. R. (1994). Encounter satisfaction versus overall satisfaction versus quality. Service quality: New directions in theory and practice, 72-94. |
| [7] | Brady, M. K. & Cronin, J. (2001). Some new thoughts on conceptualizing perceived service quality: a hierarchical approach. Journal of Marketing 65, 34-49. |
| [8] | Branscombe, N. R., & Wann, D. L. (1994). Sport Psychology. In Magill(Ed). Survey of social sciences: Psychology, 263-268. Pasadena, CA: Salem. |
| [9] | Carlson, J., & O'Cass, A. (2010). Exploring the relationships between e-service quality, satisfaction, attitudes and behaviours in content-driven e-service web sites. Journal of Services Marketing, 24(2), 112-127. |
| [10] | Chelladurai, P., Scott, F. L., & Haywood-Farmer, J. (1987). Dimensions of fitness services: Development of a model. Journal of Sport Management, 1, 159–172. |
| [11] | Cook, C., & Thompson, B. (2000). Reliability and validity of SERVQUAL scores used to evaluate perceptions of library service quality. Journal of Academic Librarianship, 26(4), 248-258. |
| [12] | Dabholkar, P. A, Shepherd, C. D., & Thorpe. D. I. (2000). A comprehensive framework for service quality: An investigation of critical conceptual and measurement issues through a longitudinal study. Journal of Retailing, 76(2), 139-173. |
| [13] | Gallarza, M. G., Gil‐Saura, I., & Holbrook, M. B. (2011). The value of value: Further excursions on the meaning and role of customer value. Journal of Consumer Behaviour, 10(4), 179-191. |
| [14] | Grönroos, C. (1984). A service quality model and its marketing implications. European Journal of Marketing, 18(4), 36-44. |
| [15] | Howat, G., & Assaker, G. (2013). The hierarchical effects of perceived quality on perceived value, satisfaction, and loyalty: Empirical results from public, outdoor aquatic centres in Australia. Sport Management Review, 16(3), 268-284. |
| [16] | Hume, M., & Mort, G. S. (2010). The consequence of appraisal emotion, service quality, perceived value and customer satisfaction on repurchase intent in the performing arts. Journal of Services Marketing, 24(2), 170-182. |
| [17] | Kim, Y. M. (2012). The relationship between cheering satisfaction of professional baseball spectator, attitude toward watching, watching satisfaction, re-watching intention and word of mouth intention. Korea Journal of Sport Management, 17(2), 35-49. |
| [18] | Kim, S. K., & Kim, C. (2006).A Study on the Service Factor, Image and, Marketing Satisfaction of Racing Spectator. Korea Journal of Sport Management, 11(4), 11-20. |
| [19] | Ko, Y. J., Zhang, J., Cattani, K., & Pastore, D. (2011). Assessment of event quality in major spectator sports. Managing Service Quality, 21(3), 304-322. |
| [20] | Kwon, H. H., Trail, G., & James, J. D. (2007). The mediating role of perceived value: Team identification and purchase intention of team-licensed apparel. Journal of Sport Management, 21(4), 540-554. |
| [21] | Lee, J. H., & Kim, Y. (2003). Sports marketing SWOT strategies of motor boat racing business. The Korean Journal of Physical Education, 42(4), 519-527. |
| [22] | Lee, J. H., Kim, H. D., Ko, Y. J., & Sagas, M. (2011). The influence of service quality on satisfaction and intention: A gender segmentation strategy. Sport Management Review, 14(1), 54-63. |
| [23] | Lee, C. K., Yoon, Y. S., & Lee, S. K. (2007). Investigating the relationships among perceived value, satisfaction, and recommendations: The case of the Korean DMZ. Tourism management, 28(1), 204-214. |
| [24] | Maxham III, J. G. (2001). Service recovery's influence on consumer satisfaction, positive word-of-mouth, and purchase intentions. Journal of Business Research, 54(1), 11-24. |
| [25] | Moon, K. S., Ko, Y. J., Connaughton, D. P., & Lee, J. H. (2013). A mediating role of destination image in the relationship between event quality, perceived value, and behavioral intention. Journal of Sport & Tourism, 18(1), 49-66. |
| [26] | Murray, D., & Howat, G. (2002). The relationships among service quality, value, satisfaction, and future intentions of customers at an Australian sports and leisure center. Sport Management Review, 5(1), 25-43. |
| [27] | Oliver, R. L.(1981). Measurement and evaluation of satisfaction processes in retail settings. Journal of Retailing, 57(3), 25-48. |
| [28] | Papadimitriou, D. A., & Karteroliotis, K. (2000). The service quality expectations in private sport and fitness centres: A re-examination of the factor structure. Sports Marketing Quarterly, 9, 157-164. |
| [29] | Parasuraman, A., Zeithaml, V. A., & Berry, L. L. (1994). Reassessment of expectations as a comparison standard in measuring service quality: implications for further research. Journal of Marketing, 58, 111-24. |
| [30] | Park, S. J. (2000). A reasonable placed plan for racing business. Seoul: Korea Institute of Sport Science. |
| [31] | Peng, L. Y., & Wang, Q. (2006). Impact of relationship marketing tactics (RMTs) on switchers and stayers in a competitive service industry. Journal of Marketing Management, 22(2), 25-59. |
| [32] | Reichheld, F. F. (1996). Learning from customer defections. Harvard Business Review, 74(2), 56-69. |
| [33] | Reichheld, F. F., & Sasser, W. E. (1990). Zero defections: quality comes to services. Harvard Business Review, 68(5), 105-111. |
| [34] | Shilbury, D., Westerbeek, H., Quick, S., & Funk, D. (2009). Strategic sport marketing. Allen & Unwin. |
| [35] | Sloan, L. R. (1989). The motives of sports fans. In J. H. Goldstein (Ed.), Sports, games and play: Social and psychological viewpoints (2nd ed.), 175-240. Hillsdale, NJ: Lawrence Erlbaum. |
| [36] | Sport Business Research Network (2013). Market research results. Retrieved November 22, 2013 fromhttp://www.sbrnet.com.libproxy.troy.edu/research.asp?subRID=420. |
| [37] | Sweeney, J., & Soutar, G. (2001). Consumer perceived value: the development of a multiple item scale. Journal of Retailing, 77(2), 203-220. |
| [38] | Tam, J. L. (2004). Customer satisfaction, service quality and perceived value: an integrative model. Journal of Marketing Management, 20(7-8), 897-917. |
| [39] | Woodruff, R. B. (1997). Customer value: The next source for competitive advantage. Journal of the Academy of Marketing Science, 25(2), 139–153. |
| [40] | Zeithaml, V. A. (1988). Consumer perceptions of price, quality, and value: A means-end model and synthesis of evidence. Journal of Marketing, 52(3), 2-22. |
| [41] | Zeithaml, V. A., Berry, L. L., & Parasuraman, A. (1996). The behavioral consequences of service quality. Journal of Marketing, 31-46. |